
Rationale and Objectives
The impact of varying image acquisition parameters on the precision of measurements using quantitative computed tomography is currently based on studies performed before the advent of helical image acquisition and multidetector-row scanners. The aim of this study was to evaluate helical multidetector-row quantitative computed tomography to determine the factors contributing to the overall precision of measurements on quantitative computed tomography conducted using current vintage computed tomographic (CT) scanners.
Materials and Methods
The effects of CT protocol parameters (x-ray tube voltage and current, pitch, gantry rotation speed, detector configuration, table height, and reconstruction algorithm) and short-term scanner variation were examined on two commercially available quantitative CT (QCT) systems (ie, a combination of reference phantoms and analysis software) using seven multidetector-row CT scanners (available from a single vendor) operated in helical mode. Combined with simulated patient repositioning using three ex vivo spine specimens, precision (coefficient of variation) estimates were made on the basis of three scenarios: “best case,” “routine case,” and “worst case.”
Results
The overall best-case QCT precision was 1.4%, provided that no changes were permitted to the bone mineral density (BMD) scan protocol. Routine-case examination (with a BMD reference phantom in place) that permitted some variation in the x-ray tube current and table speed produced a precision of 1.8%. Without any constraints on the clinical QCT examinations, the worst-case precision was estimated at 3.6%.
Conclusions
Although small in appearance, these errors are for single time points and may increase substantially when monitoring changes through QCT measurements over several time points. This calls for increased caution and attention to detail whenever using helical multidetector-row quantitative computed tomography for the assessment of BMD change.
Dual-energy x-ray absorptiometry (DXA) has become the standard clinical method of screening for osteoporosis ( ). For some patients and under certain circumstances, quantitative computed tomography is an attractive alternative to DXA and is often used to assess osteoporosis and metabolic bone disease ( ). Quantitative computed tomography can be helpful to place mineral mass value in a broader context, as with spinal metastases, fractures, or arthritis ( ). The calibration of computed tomographic (CT) images is not unique to quantitative computed tomography and may be required for other specific quantification tasks, such as the assessment of coronary artery calcification ( ), detection of the progression of emphysema ( ), the characterization of lung nodules ( ), and the development of finite element models for bone strength prediction ( ).
No systematic studies have yet investigated how acquisition parameters can influence the precision of quantitative CT (QCT) measurements conducted using modern helical multidetector-row CT (MDCT) scanners. Several investigators have shown DXA to be superior or equal to single-slice quantitative computed tomography in terms of accuracy and the precision of bone mineral density (BMD) measurements ( ). In addition to the basic technique parameters of x-ray tube voltage, current, and rotation speed, additional parameters that must be controlled for MDCT scanners include overall x-ray beam width, detector configuration (how detector elements are assigned to individual data channels), table speed, and reconstructed image thickness.
Get Radiology Tree app to read full this article<
Get Radiology Tree app to read full this article<
Materials and methods
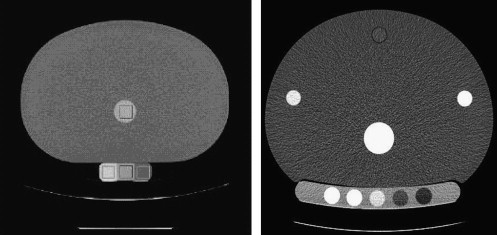
BMD Phantoms
Get Radiology Tree app to read full this article<
Get Radiology Tree app to read full this article<
Get Radiology Tree app to read full this article<
QCT Phantom Scan Acquisition
Get Radiology Tree app to read full this article<
Get Radiology Tree app to read full this article<
QCT Phantom Image Data Analysis
Get Radiology Tree app to read full this article<
CT Scanner Models
Get Radiology Tree app to read full this article<
Get Radiology Tree app to read full this article<
Helical MDCT Scan Parameter Variation
Get Radiology Tree app to read full this article<
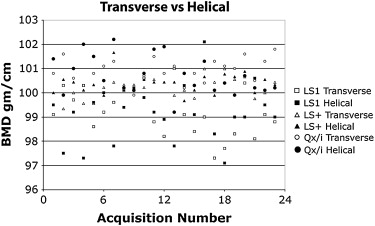
Transverse Versus Helical Acquisition Mode (Using Three CT Scanners)
Get Radiology Tree app to read full this article<
Protocol Parameters (Using a Single CT Scanner)
Get Radiology Tree app to read full this article<
Get Radiology Tree app to read full this article<
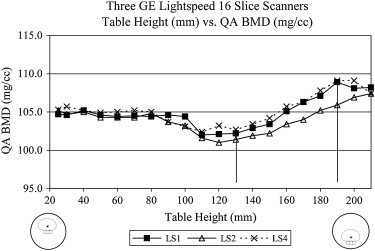
Table Height Variation (Using Three CT Scanners)
Get Radiology Tree app to read full this article<
Table 1
Proposed Clinical QCT Protocol on a 16-Channel Helical MDCT Scanner
Parameter Value X-ray tube potential (kVp) 120 X-ray tube current (mA) 230 Pitch (table travel per rotation/beam width) 0.938 Gantry rotation speed (s/rotation) 0.5 Image thickness (mm) 1.25 Display field of view (cm) 36 Detector configuration (channels × channel width [mm]) 16 × 0.625 Reconstruction algorithm Standard
MDCT, multidetector-row computed tomographic; QCT, quantitative computed tomographic.
Get Radiology Tree app to read full this article<
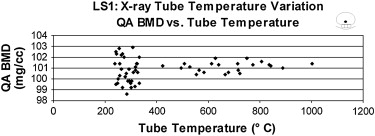
X-Ray Tube Temperature (Using a Single CT Scanner)
Get Radiology Tree app to read full this article<
Get Radiology Tree app to read full this article<
Short-Term Scanner-to-Scanner Variation (Using Seven CT Scanners)
Get Radiology Tree app to read full this article<
Simulated Patient Repositioning Determination (Using a Single CT Scanner)
Get Radiology Tree app to read full this article<
Statistical Analysis
Get Radiology Tree app to read full this article<
Get Radiology Tree app to read full this article<
Get Radiology Tree app to read full this article<
Results
Transverse Versus Helical Acquisition Mode (Using Three MDCT Scanners)
Get Radiology Tree app to read full this article<
Get Radiology Tree app to read full this article<
Protocol Parameters (Using a Single CT Scanner)
Get Radiology Tree app to read full this article<
Get Radiology Tree app to read full this article<
Get Radiology Tree app to read full this article<
Get Radiology Tree app to read full this article<
Table Height Variation (Using Three CT Scanners)
Get Radiology Tree app to read full this article<
Get Radiology Tree app to read full this article<
X-Ray Tube Temperature (Using a Single CT Scanner)
Get Radiology Tree app to read full this article<
Get Radiology Tree app to read full this article<
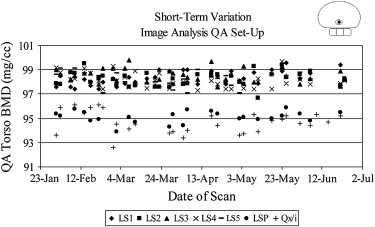
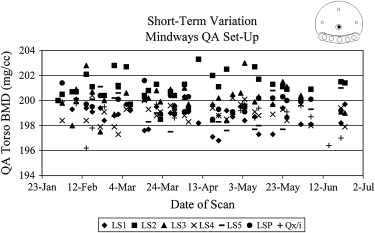
Short-term Scanner-to-Scanner Variation (Using Seven CT Scanners)
Get Radiology Tree app to read full this article<
Table 2
Short-Term QCT Precision
Scanner QCT System LS1 LS2 LS3 LS4 LS5 LSP QX/i All Scanners Combined Image Analysis Mean ± SD (mg/cm 3 ) 98.5 ± 0.57 98.1 ± 0.63 98.2 ± 0.57 98.3 ± 0.60 98.3 ± 0.56 95.1 ± 0.48 94.7 ± 0.91 97.5 ± 1.57 CV (%) 0.58 0.64 0.58 0.61 0.57 0.51 0.96 1.56 Mindways Mean ± SD (mg/cm 3 ) 200.2 ± 1.15 199.0 ± 1.06 199.3 ± 1.06 201.1 ± 1.16 198.8 ± 0.93 199.9 ± 0.76 199.0 ± 1.12 199.6 ± 1.24 CV (%) 0.57 0.53 0.53 0.58 0.47 0.38 0.56 0.62
CV, coefficient of variation; LS1 to LS5, LightSpeed 16-channel scanners; LSP, LightSpeed Plus four-channel scanner; QX/i, LightSpeed QX/i four-channel scanner; QCT, quantitative computed tomographic; SD, standard deviation.
For short-term QCT precision, measurements were made on seven separate scanners over a 6-month period, using both Image Analysis and Mindways systems. The Mindways system was able to adapt to individual scanners and demonstrated an equivalent variation among all scanners (CV, 0.47%–0.58%); however, the Image Analysis measurements resulted in more variation among the seven scanners (CV, 0.51%–0.96%).
Get Radiology Tree app to read full this article<
Simulated Patient Repositioning Determination (Using a Single CT Scanner)
Get Radiology Tree app to read full this article<
Table 3
BMD Assessed for Three Ex Vivo Spine Segments, Each Scanned 10 Times After Intentional Repositioning, using the Proposed Clinical Protocol ( Table 1 )
Spine 1 Spine 2 Spine 3 Mean ± SD BMD (mg/cm 3 ) (center vertebra) 228.0 ± 2.1 141.9 ± 1.7 83.8 ± 0.9 CV (%) 0.9% 1.2% 1.1%
BMD, bone mineral density; CV, coefficient of variation; SD, standard deviation.
Get Radiology Tree app to read full this article<
Multislice Helical QCT Precision for Three Scenarios
Get Radiology Tree app to read full this article<
Table 4
Overall Helical MDCT Precision Results for QCT Measurements
Scenario Sources of Variability Incorporated Overall Precision (CV) † Least Significant Change (%) ‡ Best case Short-term variation of a single helical MDCT scanner (CV, 0.62%), patient repositioning (CV, 1.23%) 1.4% 3.9% Routine case ⁎ Best-case scenario plus table speed and product of tube current and rotation time (CV, 1.2%), reconstruction algorithm (CV, 0.08%) 1.8% 5.0% Worst case Routine-case scenario plus table height (CV, 2.3%), tube heat (CV, 1.0%), and 140 kVp (CV, 1.8%) 3.6% 10.0%
CV, coefficient of variation; MDCT, multidetector-row computed tomographic; QCT, quantitative computed tomographic.
Get Radiology Tree app to read full this article<
Get Radiology Tree app to read full this article<
Get Radiology Tree app to read full this article<
Get Radiology Tree app to read full this article<
Get Radiology Tree app to read full this article<
Get Radiology Tree app to read full this article<
Discussion
Get Radiology Tree app to read full this article<
Get Radiology Tree app to read full this article<
Get Radiology Tree app to read full this article<
Get Radiology Tree app to read full this article<
Get Radiology Tree app to read full this article<
Get Radiology Tree app to read full this article<
Get Radiology Tree app to read full this article<
Get Radiology Tree app to read full this article<
Get Radiology Tree app to read full this article<
Get Radiology Tree app to read full this article<
Table 5
Overall Recommendations for QCT Examinations Performed on Helical MDCT Scanners
Perform each QCT exam on the same scanner for an individual patient. Use acquisition parameters on replacement CT scanners to best match previous QCT technique. Do not use 140 kVp for QCT measurements. Do not permit variation for pitch, detector configuration, table speed, or gantry rotation speed for QCT exams. Table height used for baseline QCT exam should be used for all subsequent QCT exams. Do not perform QCT exams with a CT scanner that has been idle. Warm up x-ray tube when necessary. Minimize patient repositioning variability as much as possible. Implement a rigorous QA program according to QCT system vendor specifications.
CT, computed tomographic; MDCT, multidetector-row computed tomographic; QA, quality assurance; QCT, quantitative computed tomographic.
Get Radiology Tree app to read full this article<
Get Radiology Tree app to read full this article<
Get Radiology Tree app to read full this article<
Get Radiology Tree app to read full this article<
References
1. Genant H.K.: Current assessment of osteoporosis: proceedings of an international symposium convened during ECR’95 in Vienna, Austria. Eur J Radiol 1995; 20: pp. 163-164.
2. Raggi P., Bellasi A., Ferramosca E., et. al.: Pulse wave velocity is inversely related to vertebral bone density in hemodialysis patients. Hypertension 2007; 49: pp. 1278-1284.
3. Bousson V., Le Bras A., Roqueplan F., et. al.: Volumetric quantitative computed tomography of the proximal femur: relationships linking geometric and densitometric variables to bone strength. Osteoporos Int 2006; 17: pp. 855-864.
4. Mylona M., Leotsinides M., Alexandrides T., et. al.: Comparison of DXA, QCT and trabecular structure in beta-thalassaemia. Eur J Haematol 2005; 74: pp. 430-437.
5. Rehman Q., Lang T., Modin G., et. al.: Quantitative computed tomography of the lumbar spine, not dual x-ray absorptiometry, is an independent predictor of prevalent vertebral fractures in postmenopausal women with osteopenia receiving long-term glucocorticoid and hormone-replacement therapy. Arthrit Rheum 2002; 46: pp. 1292-1297.
6. Guglielmi G., van Kuijk C., Li J., et. al.: Influence of anthropometric parameters and bone size on bone mineral density using volumetric quantitative computed tomography and dual x-ray absorptiometry at the hip. Acta Radiol 2006; 47: pp. 574-580.
7. McCullough C.H., Ulzheimer S., Halliburton S.S., et. al.: Coronary artery calcium: a multi-institutional, multimanufacturer international standard for quantification at cardiac CT. Radiology 2007; 243: pp. 527-538.
8. Hong C., Pilgram T.K., Zhu F., et. al.: Improving mass measurement of coronary artery calcification using threshold correction and thin collimation in multi-detector row computed tomography: in vitro experiment. Acad Radiol 2003; 10: pp. 969-977.
9. Parr D.G., Stoel B.C., Stolk J., et. al.: Influence of calibration on densitometric studies of emphysema progression using computed tomography. Am J Respir Crit Care Med 2004; 170: pp. 883-890.
10. Buckley J.M., Loo K., Motherway J.: Comparison of quantitative computed tomography-based measures in predicting vertebral compressive strength. Bone 2007; 40: pp. 767-774.
11. Keaveny T.M., Donley D.W., Hoffmann P.F., et. al.: Effects of teriparatide and alendronate on vertebral strength as assessed by finite element modeling of QCT scans in women with osteoporosis. J Bone Miner Res 2007; 22: pp. 149-157.
12. Lian K.-C., Lang T.F., Keyak J.H., et. al.: Differences in hip quantitative computed tomography (QCT) measurements of bone mineral density and bone strength between glucocorticoid-treated and glucocorticoid-naive postmenopausal women. Osteoporos Int 2005; 16: pp. 642-650.
13. Crawford R.P., Cann C.E., Keaveny T.M., et. al.: Finite element models predict in vitro vertebral body compressive strength better than quantitative computed tomography. Bone 2003; 33: pp. 744-750.
14. Cann C.E.: Quantitative CT applications: comparison of current scanners. Radiology 1987; 162: pp. 257-261.
15. Ebbesen E.N., Thomsen J.S., Beck-Nielsen H., et. al.: Lumbar vertebral body compressive strength evaluated by dual-energy x-ray absorptiometry, quantitative computed tomography, and ashing. Bone 1999; 25: pp. 713-724.
16. Kaneko T.S., Pejcic M.R., Tehranzadeh J., et. al.: Relationships between material properties and CT scan data of cortical bone with and without metastatic lesions. Med Eng Phys 2003; 25: pp. 445-454.
17. Wigderowitz C.A., Paterson C.R., Dashti H., et. al.: Prediction of bone strength from cancellous structure of the distal radius: can we improve on DXA?. Osteoporos Int 2000; 11: pp. 840-846.
18. Snyder S.M., Schneider E.: Estimation of mechanical properties of cortical bone by computed tomography. J Orthop Res 1991; 9: pp. 422-431.
19. Gampp S., Jergas M., Lang P., et. al.: Quantitative CT assessment of the lumbar spine and radius in patients with osteoporosis. AJR Am J Roentgenol 1996; 167: pp. 133-140.
20. Dougherty G.: Quantitative CT in the measurement of bone quantity and bone quality for assessing osteoporosis. Med Eng Phys 1996; 18: pp. 557-568.
21. Brassow F. Correlations between breaking load and CT absorption values of vertebral bodies. Eur J Radiol 198; 22:99–101.
22. Genant H.K.: Quantitative computed tomography: update 1987. Calcif Tissue Int 1987; 41: pp. 179-186.
23. Image Analysis.2003.Image AnalysisColumbia, KY
24. Mindways Software.2005.Mindways SoftwareAustin, TX
25. Gluer C.C., Blake G.: Accurate assessment of precision errors: how to measure the reproducibility of bone densitometry techniques. Osteoporos Int 1995; 5: pp. 262-270.
26. Bevington P.R., Robinson D.K.: Data reduction and error analysis for physical sciences.2002.McGraw-HillNew York:pp. 48.
27. Kachigan S.: Statistical analysis: an interdisciplinary introduction to univariate & multivariate methods.1986.RadiusNew York
28. Genant H.K., Cann C.E., Ettinger B., et. al.: Quantitative computed tomography for spinal mineral assessment: current status. J Compt Assist Tomogr 1985; 9: pp. 602-604.
29. Chafetz N., Genant H.K.: Computed tomography of the lumbar spine. Orthop Clin North Am 1983; 14: pp. 147-169.
30. Hawkinson J., Timins J., Angelo D., et. al.: Technical white paper: bone densitometry. J Am Coll Radiol 2007; 4: pp. 320-327.
31. Cann C.E., Genant H.K.: Precise measurement of vertebral mineral content using computed tomography. J Comput Assist Tomogr 1980; 4: pp. 493-500.
32. Goodwin P.N.: Methodologies for the measurement of bone density and their precision and accuracy. Semin Nucl Med 1987; 17: pp. 293-304.
33. Jergas M., Genant H.K.: Current methods and recent advances in the diagnosis of osteoporosis. Arthrit Rheum 1993; 36: pp. 1649-1662.
34. Lenchik L., Shi R., Register T.C., et. al.: Measurement of trabecular bone mineral density in the thoracic spine using cardiac gated quantitative computed tomography. J Comput Assist Tomogr 2004; 28: pp. 134-139.
35. Wong M., Papa A., Lang T., et. al.: Validation of thoracic quantitative computed tomography as a method to measure bone mineral density. Calcif Tissue Int 2005; 76: pp. 7-10.
36. Hirbe A.: Skeletal complications of breast and prostate cancer therapies.Favus M.J.Primer on the metabolic bone diseases and disorders of mineral metabolism.2006.American Society for BoneWashington, DC:pp. 390-395.
37. Link T.M., Koppers B.B., Licht T., et. al.: In vitro and in vivo spiral CT to determine bone mineral density: initial experience in patients at risk for osteoporosis. Radiology 2004; 231: pp. 805-811.