
Rationale and Objectives
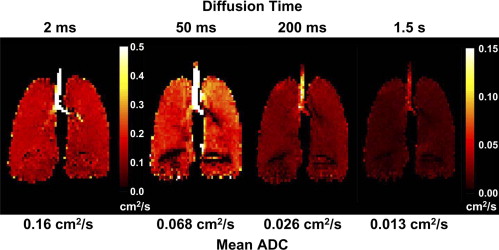
Diffusion magnetic resonance imaging (MRI) with hyperpolarized 3 He gas is a powerful technique for probing the characteristics of the lung microstructure. A key parameter for this technique is the diffusion time, which is the period during which the atoms are allowed to diffuse within the lung for measurement of the signal attenuation. The relationship between diffusion time and the length scales that can be explored is discussed, and representative, preliminary results are presented from ongoing studies of the human lung for diffusion times ranging from milliseconds to several seconds.
Materials and Methods
3 He diffusion MRI of the human lung was performed on a 1.5T Siemens Sonata scanner. Using gradient echo-based and stimulated echo-based techniques for short and medium-to-long diffusion times, respectively, measurements were performed for times ranging from 2 milliseconds to 6.5 seconds in two healthy subjects, a subject with subclinical chronic obstructive pulmonary disease and a subject with bronchopulmonary dysplasia.
Results
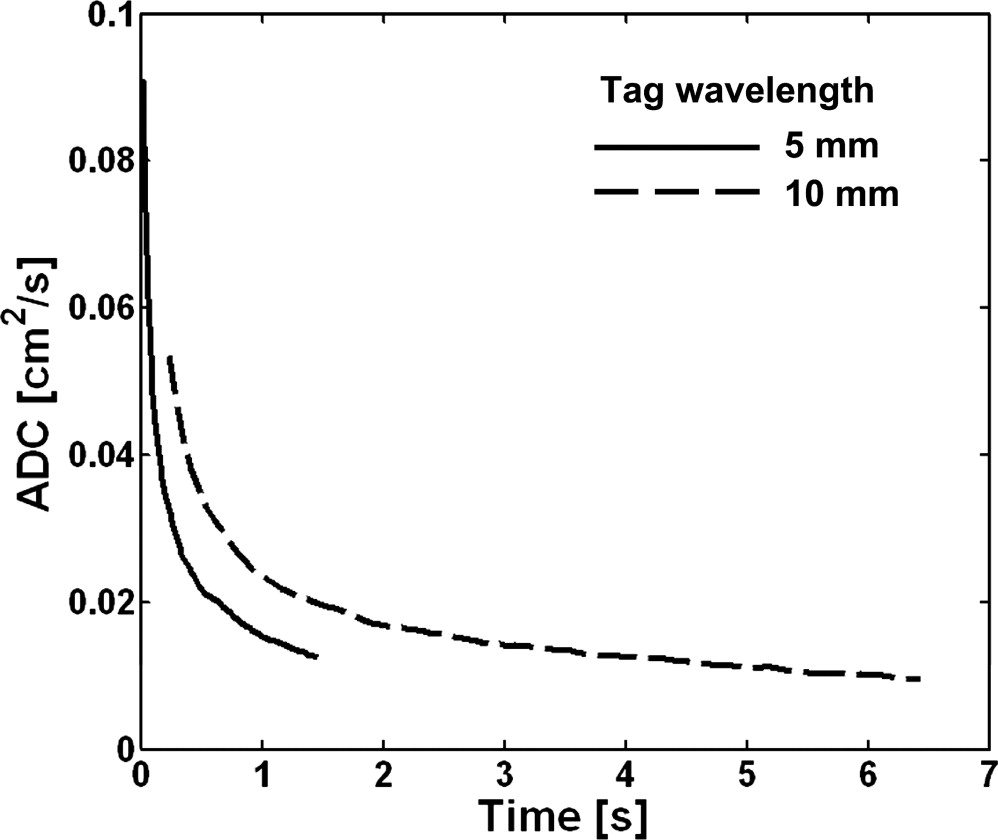
In healthy subjects, the apparent diffusion coefficient decreased by about 10-fold, from approximately 0.2 to 0.02 cm 2 /second, as the diffusion time increased from approximately 1 millisecond to 1 second. Results in subjects with disease suggest that measurements made at diffusion times substantially longer than 1 millisecond may provide improved sensitivity for detecting certain pathologic changes in the lung microstructure.
Conclusions
With appropriately designed pulse sequences it is possible to explore the diffusion of hyperpolarized 3 He in the human lung over more than a 1,000-fold variation of the diffusion time. Such measurements provide a new opportunity for exploring and characterizing the microstructure of the healthy and diseased lung.
The lung parenchyma and airspaces are poorly visualized with conventional, proton-based magnetic resonance imaging (MRI) because of the low concentration of water and the inhomogeneous magnetic environment, both of which diminish the strength of the MRI signal compared with that from other organs in the body. In contrast, inhalation of hyperpolarized helium-3 ( 3 He) gas provides a strong signal from the lung airspaces that permits high-spatial-resolution MRI ( ). Before performing an MRI examination with 3 He, the gas is polarized outside of the scanner using a dedicated, laser-based device within which, over minutes to hours (depending on the quantity of gas and details of system design), the nuclear polarization of the 3 He atoms builds up to tens of percent. This polarization is several orders of magnitude larger than that achieved for protons when the human body is placed in an MRI scanner and offsets the low density of the gas so that high-quality MRIs of 3 He in the airspaces of the lung can be obtained.
Several imaging strategies have been used for hyperpolarized 3 He MRI of the lung to investigate diseases such as asthma and emphysema ( ). Of particular interest is the application of diffusion MRI techniques to probe the characteristics of the lung microstructure. These methods provide a measurement that reflects the random Brownian motion of the 3 He gas atoms within the airspaces of the lung (as opposed to the transmembrane diffusion of the gas) and the degree to which this random motion is restricted by the structure of the lung tissue. Diffusion results in attenuation of the MRI signal, from which an apparent diffusion coefficient (ADC) can be calculated. The measured ADC varies inversely with the degree to which the diffusion of the gas is restricted. For example, the ADC for 3 He gas in healthy lung parenchyma is substantially smaller than the corresponding diffusion coefficient in an unrestricted space, and the ADC measured in a lung with severe emphysema is larger than that for a healthy lung, reflecting the enlargement of airspaces caused by the tissue destruction that occurs with emphysema. Thus regional changes of the microstructure that occur in pulmonary diseases such as emphysema can be characterized by measuring the ADC of 3 He gas in the lung ( ). Further, appropriately designed measurement protocols permit representative structural dimensions to be determined ( ), and recent evidence suggests that ADC measurements may permit detection of subtle, subclinical structural changes before they become apparent on high-resolution computed tomography ( ).
Get Radiology Tree app to read full this article<
Get Radiology Tree app to read full this article<
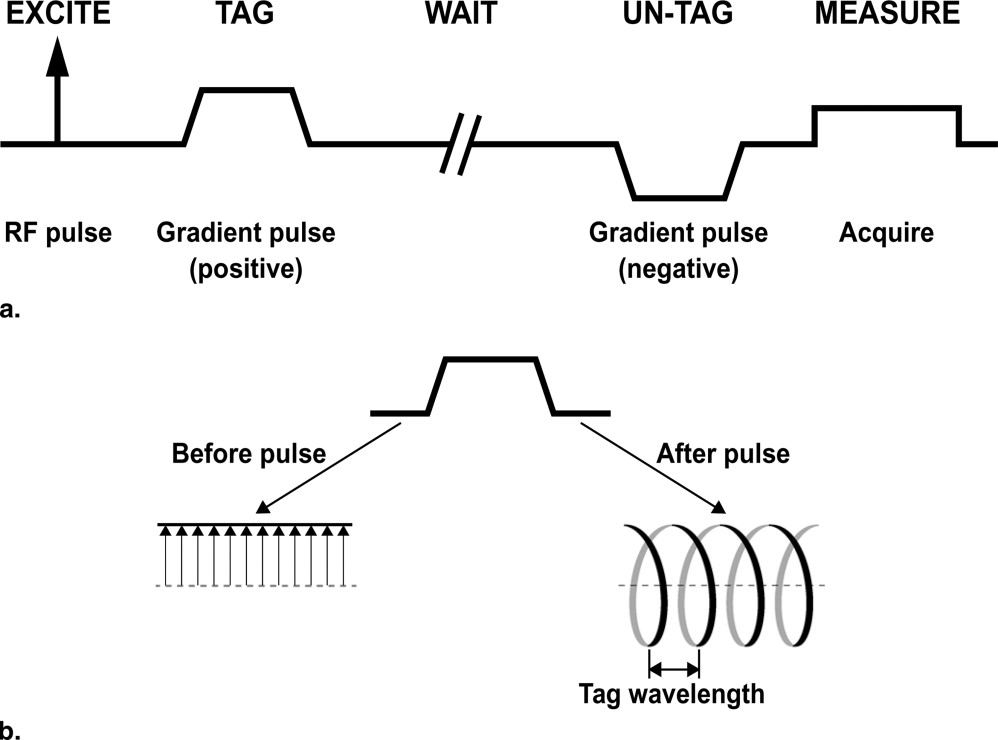
ADC measurement and diffusion time
Get Radiology Tree app to read full this article<
Get Radiology Tree app to read full this article<
Get Radiology Tree app to read full this article<
Get Radiology Tree app to read full this article<
Get Radiology Tree app to read full this article<
Get Radiology Tree app to read full this article<
Get Radiology Tree app to read full this article<
Get Radiology Tree app to read full this article<
Get Radiology Tree app to read full this article<
Get Radiology Tree app to read full this article<
Materials and methods
Get Radiology Tree app to read full this article<
Get Radiology Tree app to read full this article<
Get Radiology Tree app to read full this article<
Get Radiology Tree app to read full this article<
Results and discussion
Get Radiology Tree app to read full this article<
Get Radiology Tree app to read full this article<
Get Radiology Tree app to read full this article<
Get Radiology Tree app to read full this article<
Get Radiology Tree app to read full this article<
Get Radiology Tree app to read full this article<
Get Radiology Tree app to read full this article<
Get Radiology Tree app to read full this article<
Get Radiology Tree app to read full this article<
Get Radiology Tree app to read full this article<
Conclusions
Get Radiology Tree app to read full this article<
Acknowledgments
Get Radiology Tree app to read full this article<
Get Radiology Tree app to read full this article<
References
1. Moller H.E., Chen X.J., Saam B., et. al.: MRI of the lungs using hyperpolarized noble gases. Magn Reson Med 2002; 47: pp. 1029-1051.
2. van Beek E.J., Wild J.M., Kauczor H.U., et. al.: Functional MRI of the lung using hyperpolarized 3-helium gas. J Magn Reson Imaging 2004; 20: pp. 540-554.
3. Altes T.A., Powers P.L., Knight-Scott J., et. al.: Hyperpolarized 3 He MR lung ventilation imaging in asthmatics: preliminary findings. J Magn Reson Imaging 2001; 13: pp. 378-384.
4. de Lange E.E., Altes T.A., Patrie J.T., et. al.: Evaluation of asthma with hyperpolarized helium-3 MRI: correlation with clinical severity and spirometry. Chest 2006; 130: pp. 1055-1062.
5. Saam B.T., Yablonskiy D.A., Kodibagkar V.D., et. al.: MR imaging of diffusion of 3 He gas in healthy and diseased lungs. Magn Reson Med 2000; 44: pp. 174-179.
6. Salerno M., de Lange E.E., Altes T.A., et. al.: Emphysema: hyperpolarized helium 3 diffusion MR imaging of the lungs compared with spirometric indexes—initial experience. Radiology 2002; 222: pp. 252-260.
7. Yablonskiy D.A., Sukstanskii A.L., Leawoods J.C., et. al.: Quantitative in vivo assessment of lung microstructure at the alveolar level with hyperpolarized 3 He diffusion MRI. Proc Natl Acad Sci U S A 2002; 99: pp. 3111-3116.
8. Shanbhag D.D., Altes T.A., Miller G.W., et. al.: q-Space analysis of lung morphometry in vivo with hyperpolarized 3 He spectroscopy. J Magn Reson Imaging 2006; 24: pp. 84-94.
9. Fain S.B., Panth S.R., Evans M.D., et. al.: Early emphysematous changes in asymptomatic smokers: detection with 3He MR imaging. Radiology 2006; 239: pp. 875-883.
10. Wang C., Miller G.W., Altes T.A., et. al.: Time dependence of 3 He diffusion in the human lung: Measurement in the long-time regime using stimulated echoes. Magn Reson Med 2006; 56: pp. 296-309.
11. Woods J.C., Yablonskiy D.A., Chino K., et. al.: Magnetization tagging decay to measure long-range 3 He diffusion in healthy and emphysematous canine lungs. Magn Reson Med 2004; 51: pp. 1002-1008.
12. Woods J.C., Yablonskiy D.A., Choong C.K., et. al.: Long-range diffusion of hyperpolarized 3 He in explanted normal and emphysematous human lungs via magnetization tagging. J Appl Physiol 2005; 99: pp. 1992-1997.
13. Fichele S., Paley M.N., Woodhouse N., et. al.: Measurements and modeling of long range 3 He diffusion in the lung using a “slice-washout” method. J Magn Reson 2005; 174: pp. 28-33.
14. Stejskal E.O., Tanner J.E.: Spin diffusion measurements: Spin echoes in the presence of a time-dependent field gradient. J Chem Phys 1965; 42: pp. 288-292.
15. Salerno M., Brookeman J.R., de Lange E.E., et. al.: Hyperpolarized 3 He lung imaging at 0.5 and 1.5 Tesla: a study of susceptibility-induced effects. Magn Reson Med 2005; 53: pp. 212-216.
16. Tanner J.E.: Use of the stimulated echo in NMR diffusion studies. J Chem Phys 1970; 52: pp. 2523-2526.
17. Terry P.B., Traystman R.J., Newball H.H., et. al.: Collateral ventilation in man. N Engl J Med 1978; 298: pp. 10-15.
18. Conradi M.S., Yablonskiy D.A., Woods J.C., et. al.: 3 He diffusion MRI of the lung. Acad Radiol 2005; 12: pp. 1406-1413.
19. Knudson R.J., Lebowitz M.D., Holberg C.J., et. al.: Changes in the normal maximal expiratory flow-volume curve with growth and aging. Am Rev Respir Dis 1983; 127: pp. 725-734.
20. Wang C., Miller G.W., Altes T.A., et. al.: Measuring medium- and long-time-scale regional 3 He diffusion using stimulated echoes.2007. 458
21. Fichele S., Paley M.N., Woodhouse N., et. al.: Investigating 3 He diffusion NMR in the lungs using finite difference simulations and in vivo PGSE experiments. J Magn Reson 2004; 167: pp. 1-11.
22. Altes T.A., Mata J., de Lange E.E., et. al.: Assessment of lung development using hyperpolarized helium-3 diffusion MR imaging. J Magn Reson Imaging 2006; 24: pp. 1277-1283.
23. Fain S.B., Altes T.A., Panth S.R., et. al.: Detection of age-dependent changes in healthy adult lungs with diffusion-weighted 3 He MRI. Acad Radiol 2005; 12: pp. 1385-1393.
24. Wang C., Altes T.A., Miller G.W., et. al.: Short-time-scale and long-time-scale 3 He diffusion MRI in emphysema: Which is more sensitive?.2007. 941
25. Wang C., Miller G.W., Altes T.A., et. al.: Measurement of the diffusion of hyperpolarized 3 He in human lungs over short and long time scales during one breath hold.2007. 1284