
Rationale and Objectives
The objective of this study was to investigate the relationship between hemodynamics patterns and aneurysmal rupture in cerebral aneurysms of the same morphology regardless their location. Particularly, terminal aneurysms in both the anterior and posterior circulation were studied.
Materials and Methods
A total of 42 patient-specific vascular models were constructed from three-dimensional rotational angiography images. All patients had terminal aneurysms at different arteries: a) middle cerebral; b) anterior communicating; c) internal carotid (terminus); d) internal carotid–posterior communicating; e) basilar; or f) anterior cerebral. Hemodynamics information (intra-aneurysmal velocity and wall shear stress distributions) was derived from image-based computational fluid dynamics models with realistic patient-specific anatomies.
Results
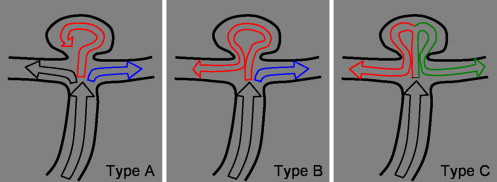
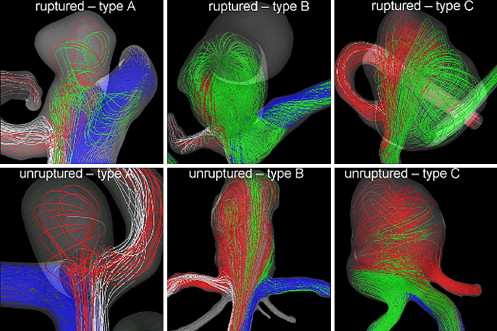
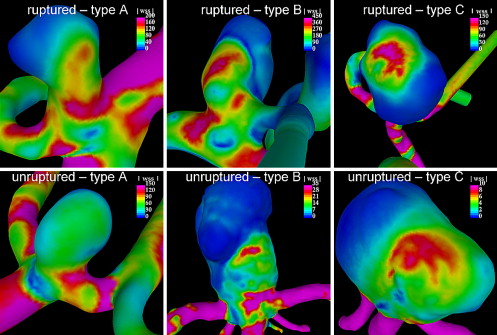
The group of aneurysms with an inflow jet that splits in two secondary jets, one of which enters the aneurysm before reaching one of the daughter vessels (type B), had the highest peak wall shear stress (WSS) and the highest rupture rate. The peak WSS averaged over each flow type showed a higher value in the ruptured group. The average peak WSS in the ruptured group (all types) was 188 dyn/cm 2 (compared to 118 dyn/cm 2 for the unruptured).
Conclusions
This finding is in agreement with a previous work in which only anterior communicating artery aneurysms were investigated. The significance of these findings is that, if they are statistically confirmed with larger number of cases, flow types could be directly observed during angiographic examinations and linked to WSS categories that may help evaluate which aneurysms are more likely to rupture.
It is widely believed that the initiation, growth, and ultimately rupture of cerebral aneurysms is related to the interaction between hemodynamic forces with the arterial wall biology resulting in a focalized weakening of the wall. For example, anterior communicating artery (AcoA) aneurysms can be experimentally produced in hypertensive rats by unilaterally ligation of the common carotid artery , suggesting a causative relationship between increased flow and aneurysm formation. The flow dynamics of cerebral aneurysms have been studied in numerous experimental models and clinical studies to investigate the role of hemodynamics in their initiation, growth, and rupture . Although this work has characterized the complexity of intra-aneurysmal hemodynamics, the studies have largely focused on idealized aneurysm geometries or surgically created aneurysms in animals. Each of these approaches has had significant limitations in connecting the hemodynamic factors studied with clinical events. Recently, computational fluid dynamics studies have tried to replicate the exact anatomy of specific patients and investigate connections between hemodynamic variables and aneurysm rupture . In this study, a further analysis of the relationship between hemodynamic characteristics and aneurysm rupture is carried out using image-based, patient-specific computational models. In our previous study of anterior communicating artery aneurysms, we found a possible association between both the flow pattern and the high wall shear stress with rupture . Given that most aneurysms had a flow pattern compatible with a terminal location, that single morphological type (terminal aneurysms) is investigated in this work.
Material and methods
Patients and Images
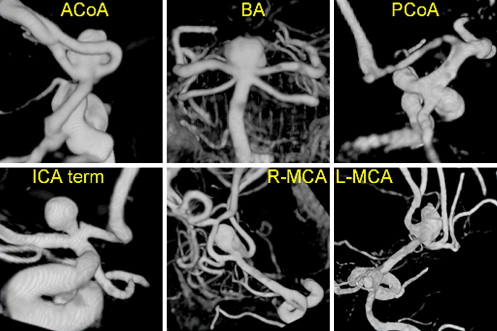
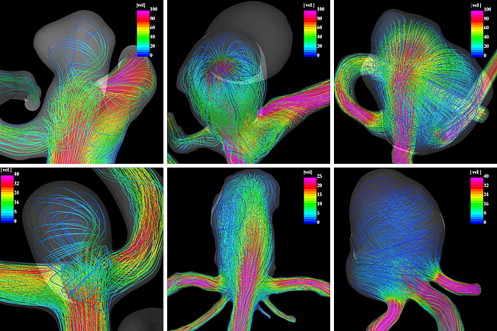
A total of 42 consecutive terminal cerebral aneurysms were selected from our database for this study. Patients referred to the interventional neuroradiological service of the Inova Fairfax Hospital (Virginia) between 2003 and 2005, and diagnosed with cerebral aneurysms by conventional catheter angiograms and three-dimensional rotational angiography were considered. Rotational angiography images were obtained during a 180° rotation and imaging at 15 frames per second for a total of 8 seconds, by using an Integris system (Philips Medical Systems, Best, The Netherlands). The corresponding 120 projection images were reconstructed into a three-dimensional data set of 128 × 128 × 128 voxels covering a field of view of 54.02 mm on a dedicated Philips workstation. The selected aneurysms occurred at the bifurcation apex of a single inflow vessel subdivided into two branches of roughly the same diameter. This study included terminal cerebral aneurysms at different locations: 22 in the AcoA, 9 in the middle cerebral artery, 5 in the basilar artery, 3 in the internal carotid artery terminus, 2 at the internal carotid artery–posterior communicating artery bifurcation, and 1 in the anterior cerebral artery (anterior cerebral artery-pericallosa). In this sample, there were 25 ruptured aneurysms (59%) and 17 unruptured aneurysms (41%). Patient characteristics are included in Table 1 . Examples of terminal cerebral aneurysms at different locations are shown in Figure 1 . The rotational angiography images were obtained during a 180° rotation and imaging at 15 frames per second for a total of 8 seconds, using a Phillips Integris System. The corresponding 120 projection images were reconstructed into three-dimensional datasets of 256 × 256 × 256 voxels covering a field of view of 54.02 mm on a dedicated Phillips workstation. The voxel data were exported to a PC for patient-specific computational modeling.
Table 1
Patient Characteristics
Gender No. % Location No. Male 18 42% Acom bilateral 11 Female 24 58% Acom unilateral 11 Ruptured MCA bifurcation 9 Yes 25 59% BA tip 5 No 17 41% Pcom 2 Age ICA terminus 3 Min 35 ACA-pericallose 1 Max 88 Mean 56 Total 42
Acom: anterior communicating artery; MCA: middle cerebral artery; BA: basilar artery; Pcom: posterior communicating artery; ICA: internal carotid artery; ACA: anterior cerebral artery.
Get Radiology Tree app to read full this article<
Patient-Specific Models
Get Radiology Tree app to read full this article<
Get Radiology Tree app to read full this article<
Hemodynamics Characterization
Get Radiology Tree app to read full this article<
Get Radiology Tree app to read full this article<
Get Radiology Tree app to read full this article<
Get Radiology Tree app to read full this article<
Get Radiology Tree app to read full this article<
Results
Get Radiology Tree app to read full this article<
Get Radiology Tree app to read full this article<
Table 2
Number and Percentage of Ruptured (R) and Unruptured (UR) Aneurysms in each Flow Type
Type R % UR % Total A 6 50% 6 50% 12 B 15 68% 7 32% 22 C 2 33% 4 67% 6 Total 23 58% 17 42% 40
In these results, the two ruptured aneurysms with a pathological reduction of the lumen proximal to the aneurysms and a consequent extremely elevated wall shear stress were excluded.
Get Radiology Tree app to read full this article<
Get Radiology Tree app to read full this article<
Table 3
Maximum Wall Shear Stress Averaged over Flow Type for Ruptured (R) and Unruptured (UR) Aneurysms
Type R Range UR Range A 89 35–200 68 10–150 B 226 50–600 175 10–570 C 165 160–170 93 10–40 Mean 188 35–600 118 10–570
In these results, the two ruptured aneurysms with a pathological reduction of the lumen proximal to the aneurysms and a consequent extremely elevated wall shear stress were excluded. If they were included, the average wall shear stress of the ruptured group would be 271 dyn/cm 2 .
Get Radiology Tree app to read full this article<
Get Radiology Tree app to read full this article<
Get Radiology Tree app to read full this article<
Conclusion
Get Radiology Tree app to read full this article<
Get Radiology Tree app to read full this article<
Get Radiology Tree app to read full this article<
Get Radiology Tree app to read full this article<
Get Radiology Tree app to read full this article<
Get Radiology Tree app to read full this article<
References
1. Hashimoto N., Handa H., Nagata I., et. al.: Experimentally induced cerebral aneurysms in rats: part V, relation of hemodynamics in the circle of Willis to formation of aneurysms. Surg Neurol 1980; 13: pp. 41-45.
2. Nakatani H., Hashimoto N., Kang Y., et. al.: Cerebral blood flow patterns at major vessel bifurcations and aneurysms in rats. J Neurosurg 1991; 74: pp. 258-262.
3. Gonzalez C.F., Cho Y.I., Ortega H.V., et. al.: Intracranial aneurysms: flow analysis of their origin and progression. AJNR Am J Neuroradiol 1992; 13: pp. 181-188.
4. Gobin Y.P., Counord J.L., Flaud P., et. al.: In vitro study of haemodynamics in a giant saccular aneurysm model: influence of flow dynamics in the parent vessel and effects of coil embolization. Neuroradiology 1994; 36: pp. 530-536.
5. Burleson A.C., Strother C.M., Turitto V.T., et. al.: Computer modeling of intracranial saccular and lateral aneurysms for the study of their hemodynamics. Neurosurgery 1995; 37: pp. 774-784.
6. Tenjin H., Asakura F., Nakahara H., et. al.: Evaluation of intraaneurysmal blood velocity by time-density curve analysis and digital subtraction angiography. AJNR Am J Neuroradiol 1998; 19: pp. 1303-1307.
7. Ujie H., Tachibana H., Hiramatsu O., et. al.: Effects of size and shape (aspect ratio) on the hemodynamics of saccular aneurysms: a possible index for the surgical treatment of intracranial aneurysms. Neurosurgery 1999; 45: pp. 119-130.
8. Tateshima S., Murayama Y., Villablanca J.P., et. al.: Intraaneurysmal flow dynamics study featuring an acrylic aneurysm model manufactured using computerized tomography angiogram as a mold. J Neurosurg 2001; 95: pp. 1020-1027.
9. Saton T., Onoda K., Tsuchimoto S., et. al.: Visualization of intraaneurysmal flow patterns with transluminal flow images of 3D MR angiograms in conjunction with aneurysmal configurations. Am J Neuroradiol 2003; 24: pp. 1436-1445.
10. Liou T.M., Liou S.N.: A review of in vitro studies of hemodynamic characteristics in terminal and lateral aneurysm models. Proc. Natl. Sci. Counc. ROC(B) 1999; 23: pp. 133-148.
11. Cebral J.R., Castro M.A., Appanaboyina S., et. al.: Efficient pipeline for image-based patient-specific analysis of cerebral aneurysm hemodynamics: technique and sensitivity. IEEE Trans Med Imaging 2005; 24: pp. 457-467.
12. Cebral J.R., Castro M.A., Burguess J.E., et. al.: Characterization of cerebral aneurysm for assessing risk of rupture using patient-specific computational hemodynamics models. AJNR Am J Neuroradiol 2005; 26: pp. 2550-2559.
13. Castro M.A., Putman C.M., Sheridan M.J., et. al.: Hemodynamic patterns of anterior communicating artery aneurysms: a possible association with rupture. AJNR Am J Neuroradiol 2009; 30: pp. 297-302.
14. Yim P.J., Vasbinder G.B., Ho V.B., et. al.: A deformable isosurface and vascular applications. SPIE Med Imaging 2002; 4684: pp. 1390-1397.
15. Castro M.A., Putman C.M., Cebral J.R., et. al.: Computational fluid dynamics modeling of intracranial aneurysms: effects of parent artery segmentation on intra-aneurysmal hemodynamics. AJNR Am J Neuroradiol 2006; 27: pp. 1703-1709.
16. Taubin G.: Signal processing approach to fair surface design. Comp Graphics 1995; pp. 351-358.
17. Cebral J.R., Löhner R.: From medical images to anatomically accurate finite element grids. Int J Numerical Meth Engineer 2001; 51: pp. 985-1008.
18. Löhner R.: Automatic unstructured grid generators. Finite Elements Anal Design 1997; 25: pp. 111-134.
19. Löhner R.: Communications in numerical methods in engineering 1996; 12: pp. 683-702.
20. Löhner R.: Regridding surface triangulations. J Comp Phys 1996; 126: pp. 1-10.
21. Mazumdar J.: Biofluid mechanics.1992.World ScientificSingapore
22. Cebral J.R., et. al.: Flow-area relationship in internal carotid and vertebral arteries. Physiol Meas 2008; 29: pp. 585-594.
23. Womersley J.R.: Method for the calculation of velocity, rate of flow and viscous drag in arteries when the pressure gradient is known. J Physiol 1955; 127: pp. 553-563.
24. Taylor C.A., Hughes T.J.R., Zarins C.K., et. al.: Finite element modeling of blood flow in arteries. Comp Meth Appl Mechand Engineer 1998; 158: pp. 155-196.
25. Stehbens W.E.: Intracranial arterial aneurysms in pathology of the cerebral blood vessels 1972; pp. 351-470.
26. Weir B.: Unruptured intracranial aneurysms: a review. J Neurosurg 2002; 96: pp. 3-42.
27. Foutrakis G.N., Yonas H., Scablassi R., et. al.: Saccular aneurysm formation in curved and bifurcation arteries. AJNR Am J Neuroradiol 1999; 20: pp. 1309-1317.
28. Tomasello F., D’Avella D., Salpietro F.M., et. al.: Asymptomatic aneurysms. Literature meta-analysis and indications for treatment. J Neurosurg Sci 1998; 42: pp. 47-51.
29. Winn H.R., Jane J.A., Taylor J., et. al.: Prevalence of asymptomatic incidental aneurysms: review of 4568 arteriograms. J Neurosurg 2002; 96: pp. 43-49.
30. Linn F.H.H., Rinkel G.J.E., Algra A., et. al.: Incidence of subarachnoid hemorrhage: role of region, year, and rate of computed tomography: a meta-analysis. Stroke 1996; 27: pp. 625-629.
31. Kaminogo M., Yonekura M., Shibata S., et. al.: Incidence and outcome of multiple intracranial aneurysms in a defined population. Stroke 2003; 34: pp. 16-21.
32. Kim C., Cervós-Navarro J., Pätzold C., et. al.: In vivo study of flow pattern at human carotid bifurcation with regard to aneurysm development. Acta Neurochir (Wien) 1992; 115: pp. 112-117.
33. Kassell N.F., Torner J.C.: The International Cooperative Study on the Timing of Aneurysm Surgery. Part 1: overall management results. J Neurosurg 1990; 73: pp. 18-36.
34. Nishioka H., Torner J.C., Graf C.J., et. al.: Cooperative study of intracranial aneurysms and subarachnoid hemorrhage: a long-term prognostic study. II. Ruptured intracranial aneurysms managed conservatively. Arch Neurol 1984; 41: pp. 1142-1146.
35. White P.M., Wardlaw J.M.: Unruptured intracranial aneurysms. J Neuroradiol 2003; 30: pp. 336-350.
36. Reneman R.S., et. al.: Wall shear stress—an important determination of endothelial cell function and structure—in arterial system in vivo. J Vasc Res 2006; 43: pp. 251-269.
37. Forsberg F., Morvay Z., Rawool N.M., et. al.: Shear rate estimation using a clinical ultrasound scanner. J Ultrasound Med 2000; 19: pp. 323-327.