
Rationale and Objectives
Perfusion imaging of the liver has attracted interest as a potential means for earlier detection of hepatic metastases, but the techniques are complex and do not form part of routine imaging protocols. This study assesses whether the hemodynamic status of the liver of patients with colorectal cancer but apparently normal hepatic morphology is reflected by texture features within a single portal-phase contrast enhanced computed tomography (CT) image and correlates texture with overall survival.
Materials and Methods
Portal-phase CT images from 27 patients with colorectal cancer but no apparent hepatic metastases were processed using a band-pass filter that highlighted image features at different spatial frequencies. A range of parameters reflecting liver texture on filtered images were correlated against CT hepatic perfusion index (HPI) and patient survival.
Results
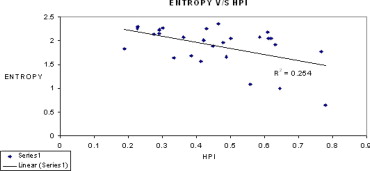
After image filtration, entropy values from hepatic regions were inversely correlated with HPI ( r = –0.503978, P = .007355), and directly correlated with survival ( r = 0.489642, P = .009533). An entropy value below 2.0 identified four patients who died within 36 months of their CT scan with sensitivity 100% and specificity 65% ( P < .03).
Conclusion
The hemodynamic status of the liver is reflected by subtle changes in coarse texture on portal phase images that can be revealed by texture analysis. Texture analysis has the potential to identify colorectal cancer patients with an apparently normal portal phase hepatic CT but reduced survival.
Colorectal cancer is the second most common malignancy in Western societies ( ). Most patients undergo resection of the primary tumor, but up to 40% of these patients will relapse and die of their disease, making colorectal cancer the second leading cause of death related to cancer ( ). In 20%–40% of patients, the liver is the sole site of metastases ( ). It is common practice to follow-up patients after their curative resection but there is wide variation in follow-up strategies. A recent systemic literature review concluded that there is an overall survival benefit for intensifying the follow-up of such patients, with imaging of the liver being associated with reduced mortality (odds ratio = 0.66, 95% confidence limits 0.46–0.95) ( ), and the American Society of Clinical Oncology now recommends annual computed tomography (CT) of the chest and abdomen for 3 years after primary therapy for patients at higher risk of recurrence ( ). Current techniques for detection of metastases can be divided into two main categories based on the information used: structural and functional information of the tissue in question. In structural imaging, routine helical CT, CT arterioportography, magnetic resonance imaging, and ultrasound are employed. CT scanning is well established and widely available technique and so is the first choice when staging cancer. Magnetic resonance imaging is as sensitive as CT in detecting focal liver lesions, but at present limited access and relatively high costs preclude magnetic resonance imaging as a viable screening test. CT arterioportography was developed to improve detection, definition and differentiate liver metastases from other liver lesions before surgery ( ). It has reported sensitivity of 84%–90% compared with 65% with conventional CT; however, its specificity is poor and it is also an invasive procedure, which exempts it from becoming a general screening technique. Other functional imaging techniques include Doppler and power ultrasound in assessing blood flow changes and nuclear medicine procedures such as fluoro-deoxy-glucose positron emission tomography used for evaluation of glucose metabolism. These ultrasound techniques are user-dependent, whereas positron emission tomography is relatively complex and expensive with limited availability. Hence CT of the liver is widely employed as a means of diagnosing hepatic metastases during restaging of patients with colorectal cancer.
The detection of hepatic metastases by CT is improved by use of contrast media. Yet, even with contrast enhancement and modern multidetector CT systems, metastases smaller than 5 mm in diameter cannot be detected reliably. Thus perfusion imaging of the liver has attracted interest as a potential means to overcome this shortcoming on the basis that hepatic metastases too small to visualize on conventional images (ie, micrometastases) are associated with alterations in hepatic blood flow ( ).
Get Radiology Tree app to read full this article<
 Open full size image
Figure 1
Summary of the hemodynamic changes in the liver in the presence of metastases. The thickness of the arrows is proportional to the blood flow.
Get Radiology Tree app to read full this article<
Get Radiology Tree app to read full this article<
Get Radiology Tree app to read full this article<
Get Radiology Tree app to read full this article<
Materials (patients) and methods
Get Radiology Tree app to read full this article<
Get Radiology Tree app to read full this article<
Image Acquisition
Get Radiology Tree app to read full this article<
Get Radiology Tree app to read full this article<
Assessment of Hepatic Hemodynamics
Get Radiology Tree app to read full this article<
![Figure 2, Summary of the method for assessing hepatic hemodynamics with contrast-enhanced CT as described by Miles et al [ 26 ]. Note the complexity of the technique which requires a rapid series of CT images (around 11 slices) acquired without table movement following an intravenous bolus of contrast media (top row) and subsequent analysis of time-attenuation curves (bottom right) derived from several regions of interest (bottom left).](https://storage.googleapis.com/dl.dentistrykey.com/clinical/HepaticEnhancementinColorectalCancer/0_1s20S1076633207003741.jpg)
Get Radiology Tree app to read full this article<
Get Radiology Tree app to read full this article<
HPI=maximalrateofarterialphaseenhancementmaximalrateofarterialphaseenhancement+maximalrateofportalphaseenhancement HPI
=
maximal
rate
of
arterial
phase
enhancement
maximal
rate
of
arterial
phase
enhancement
+
maximal
rate
of
portal
phase
enhancement
HPI was calculated using Winfun (University of Cambridge Radiology Department, Cambridge, UK), a PC-based program developed for the determination of CT perfusion parameters for hepatic ROI constructed just within the boundaries of the liver but excluding areas of fat and major blood vessels. Time-attenuation curves were generated for the liver, spleen, and aorta.
Get Radiology Tree app to read full this article<
Texture Analysis
Get Radiology Tree app to read full this article<
Get Radiology Tree app to read full this article<
Statistical Analysis
Get Radiology Tree app to read full this article<
Results
Get Radiology Tree app to read full this article<
Table 1
Median, Multiple Regression ( r ), and Significance ( P ) Values for Correlation Against HPI and Survival Data for Mean Gray-Level Intensity Values Obtained from Band-Pass Filtered and Unfiltered Portal-Phase Hepatic Region of Interest of Each Patient
Sigma Median Mean Gray-Level Intensity HPI Survival_r_ Value_P_ Value_r_ Value_P_ Value 0.5 5.4415 −0.140294 .485202 0.053982 .789146 0.8 5.3149 −0.300998 .127095 0.096 .633839 1 4.4805 −0.374741 .054115 0.091106 .65131 1.5 3.1459 −0.474886 .012313 0.089402 .657438 1.8 2.6681 −0.509865 .006591 0.103038 .609051 2 2.3897 −0.520397 .005391 0.114235 .570471 2.5 2.1574 −0.518466 .005596 0.137264 .494773 2.8 1.9715 −0.509036 .006695 0.148945 .458407 3 1.8257 −0.50043 .007851 0.154762 .440839 3.5 1.6555 −0.473484 .012609 0.162506 .418024 3.8 1.5283 −0.458395 .016185 0.163724 .414495 4 1.4619 −0.448546 .018942 0.163073 .41638 Unfiltered 52.807 −0.241046 .225818 −0.022829 .910012
HPI: hepatic perfusion index.
Table 2
Median, Multiple Regression ( r ), and Significance ( P ) Values for Correlation Against HPI and Survival Data for Entropy Values Obtained from Band-Pass Filtered and Unfiltered Portal-Phase Hepatic Region of Interest of Each Patient
Sigma Median Entropy HPI Survival_r_ Value_P_ Value_r_ Value_P_ Value 0.5 3.1918 −0.15647 .435751 0.17723 .376498 0.8 2.9953 −0.299227 .129458 0.274486 .16588 1 2.8493 −0.344525 .078437 0.300449 .127824 1.5 2.543 −0.438864 .022017 0.367989 .058955 1.8 2.3701 −0.48828 .009765 0.412593 .032454 2 2.2756 −0.502508 .007557 0.449133 .018768 2.5 2.0505 −0.503978 .007355 0.489642 .009533 2.8 1.92 −0.492043 .009135 0.505218 .007188 3 1.8449 −0.482975 .010716 0.516013 .005866 3.5 1.636 −0.442154 .020929 0.534927 .004042 3.8 1.5161 −0.423793 .027602 0.536362 .003926 4 1.4354 −0.407064 .03509 0.530926 .004381 Unfiltered 5.0376 −0.219673 .270914 −0.036881 .855087
HPI: hepatic perfusion index.
Table 3
Median, Multiple Regression ( r ), and significance ( P ) Values for Correlation Against HPI and Survival Data for Uniformity Values Obtained From Band-Pass Filtered and Unfiltered Portal-Phase Hepatic Region of Interest of Each Patient
Sigma Median Uniformity HPI Survival_r_ Value_P_ Value_r_ Value_P_ Value 0.5 0.3167 0.236427 .235109 −0.346789 .076368 0.8 0.3516 0.237253 .233429 −0.366938 .059738 1 0.375 0.232593 .243009 −0.371867 .056136 1.5 0.4437 0.270069 .173075 −0.411206 .0331 1.8 0.4826 0.311981 .113143 −0.449482 .018665 2 0.5017 0.324177 .099012 −0.484043 .010519 2.5 0.5607 0.348081 .075205 −0.522744 .00515 2.8 0.5905 0.351822 .071915 −0.53701 .003875 3 0.6062 0.350624 .072957 −0.545924 .003223 3.5 0.6385 0.322773 .100568 −0.56539 .002117 3.8 0.6648 0.316274 .108007 −0.568909 .001957 4 0.683 0.306122 .120438 −0.563515 .002207 Unfiltered 0.0364 0.22615 .256677 0.02192 .913581
HPI: hepatic perfusion index.
Get Radiology Tree app to read full this article<
Get Radiology Tree app to read full this article<
Get Radiology Tree app to read full this article<
Get Radiology Tree app to read full this article<
Get Radiology Tree app to read full this article<
Discussion
Get Radiology Tree app to read full this article<
Get Radiology Tree app to read full this article<
Get Radiology Tree app to read full this article<
Get Radiology Tree app to read full this article<
Get Radiology Tree app to read full this article<
Get Radiology Tree app to read full this article<
Get Radiology Tree app to read full this article<
Get Radiology Tree app to read full this article<
APPENDIX
Image Filtration
Get Radiology Tree app to read full this article<
Get Radiology Tree app to read full this article<
G(x,y)=e−x2+y22πσ2 G
(
x
,
y
)
=
e
−
x
2
+
y
2
2
π
σ
2
where (x, y) is the spatial coordinates of the image matrix and sigma, σ is the standard deviation. The two-dimensional (2D) Gaussian distribution effectively blurs the image, wiping out all structures at scales much smaller than the sigma of the Gaussian. Thus Gaussian distribution would enable highlighting only hepatic textural features of a particular scale in contrast agent–enhanced CT images corresponding to the sigma (σ) value. To assess independently whether liver parenchyma and liver vascularity affect the hemodynamic status of the liver, we have employed this filtration technique to filter out textural features of varying scale: fine scale enhances parenchyma, whereas medium to coarse scale enhances blood vessels of varying sizes. For these reasons, such as selective hepatic feature extraction at a particular scale and reducing the effects of noise, Gaussian smoothening, which suppresses noise and has the desirable characteristics of being smooth and localized in both the spatial and frequency domains, was carried out before actually employing the Laplacian filter, because it is less likely to introduce any changes that were not present in the original image.
Get Radiology Tree app to read full this article<
Get Radiology Tree app to read full this article<
∇2G(x,y)=−1πσ4(1−x2+y22σ2)e−(x2+y22σ2) ∇
2
G
(
x
,
y
)
=
-
1
π
σ
4
(
1
−
x
2
+
y
2
2
σ
2
)
e
−
(
x
2
+
y
2
2
σ
2
)
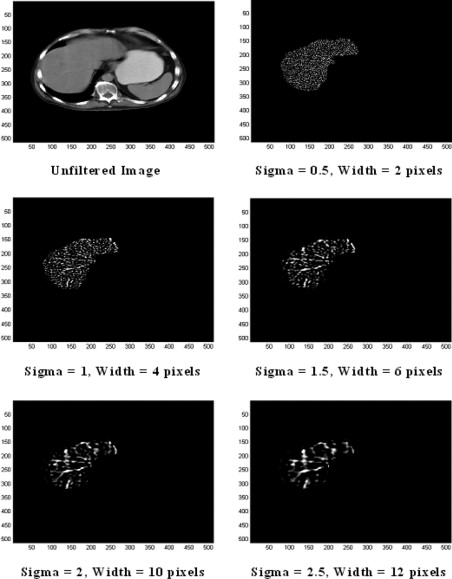
From the mathematical expression of this circularly symmetric filter at different sigma (σ) values, the number of pixels representing the width between the diametrically opposite zero-crossing points in this filter can be calculated (see Fig 5 ). The width of the filter at different sigma (σ) values are obtained by evaluating the LoG spatial distribution along the x and y directions. The higher the sigma value, the higher is the width of the filter in the spatial domain; this corresponds to a smaller pass-band region of the filter in the frequency domain, highlighting coarse features in the filtered image in the spatial domain. Similarly, the lower the sigma value, the smaller is the width of the filter in the spatial domain and the larger is the pass-band region of the filter in the frequency domain, highlighting fine details or features in the filtered image in the spatial domain. Thus the filter can be modulated so as to highlight liver features of a particular size (ie, at known spatial frequencies). Table 4 indicates the filter width in pixels for a range of sigma values. This width can be considered as the scale at which the structures in the image will be highlighted and enhanced whilst structures below this scale will become blurred. From Fig 3 , it is clear that fine texture predominantly highlights only liver parenchyma, whereas coarse texture predominantly highlights portal blood vessels.
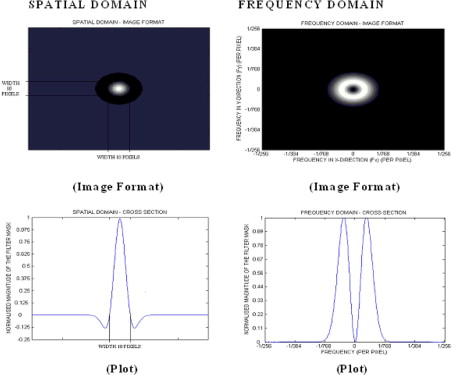
Table 4
Filter Sigma Value and the Corresponding Width of the Filter (Pixels)
Sigma (σ) Filter Width (Pixels) 0.5 2 1 4 1.5 6 1.8 8 2 10 2.5 12 3 14 3.5 16 3.8 18 4 20
Get Radiology Tree app to read full this article<
Get Radiology Tree app to read full this article<
Quantification of Texture
Get Radiology Tree app to read full this article<
MeanGrey−LevelIntensity(m)=1N∑(x,y)∈Ra[x,y] Mean
Grey
−
Level
Intensity
(
m
)
=
1
N
∑
(
x
,
y
)
∈
R
a
[
x
,
y
]
Entropy (e)=−∑kl=1[p(l)]log2[p(l)] Entropy (e)
=
−
∑
l
=
1
k
[
p
(
l
)
]
log
2
[
p
(
l
)
]
Uniformity (u)=−∑kl=1[p(l)]2 Uniformity (u)
=
−
∑
l
=
1
k
[
p
(
l
)
]
2
Get Radiology Tree app to read full this article<
Get Radiology Tree app to read full this article<
References
1. Jemal A., Murray T., Ward E., et. al.: Cancer statistics, 2005. CA Cancer J Clin 2005; 55: pp. 10-30.
2. Obrand D., Gordon P.: Incidence and patterns of recurrence following curative resection of colon cancer. Dis Colon Rectum 1997; 40: pp. 15-24.
3. Morgan-Parkes J.H.: Metastases: mechanisms, pathways, and cascades. AJR Am J Roentgenol 1995; 164: pp. 1075-1082.
4. Jeffrey GM, Hickey BE, Hider P. Follow-up strategies for patients treated for non-metastatic colorectal cancer (Cochrane Review). In: The Cochrane Library, Issue 2 2003. Oxford: Update Software.
5. Desch C.E., Benson A.B., Somerfield M.R., et. al., American Society of Clinical Oncology: Colorectal cancer surveillance: 2005 update of an American Society of Clinical Oncology practice guideline. J Clin Oncol 2005; 23: pp. 8512-8519.
6. Inoue E., Fujita M., Hosomo N., et. al.: Double phase CT arteriography of the whole liver in the evaluation of hepatic tumors. J Comput Assist Tomogr 1998; 22: pp. 64-68.
7. Pandharipande P.V., Krinsky G.A., Rusinek H., et. al.: Perfusion imaging of the liver: current challenges and future goals. Radiology 2005; 234: pp. 661-673.
8. Dugdale P.E., Miles K.A.: Hepatic metastases: the value of quantitative assessment of contrast enhancement on computed tomography. Eur J Radiol 1999; 30: pp. 206-213.
9. Koseoglu K., Taskin F., Ozsunar Y., et. al.: Transient hepatic attenuation differences at biphasic spiral CT examinations. Diagn Interv Radiol 2005; 11: pp. 96-101.
10. Leggett D.A.C., Kelley B.B., Bunce I.H., et. al.: Colorectal cancer: diagnostic potential of CT measurements of hepatic perfusion and implications for contrast enhancement protocols. Radiology 1997; 205: pp. 716-720.
11. Tsushima Y., Blomley M.K., Yokoyama H., et. al.: Does the presence of distant and local malignancy alter parenchymal perfusion in apparently disease-free areas of liver?. Dig Dis Sci 2001; 46: pp. 2113-2119.
12. Cuenod C.A., Leconte I., Siauve N., et. al.: Early changes in liver perfusion caused by occult metastases in rats: detection with quantitative CT. Radiology 2001; 218: pp. 556-561.
13. Platt J.F., Francis I.R., Ellis J.H., et. al.: Liver metastases: early detection based on abnormal contrast material enhancement at dual-phase helical CT. Radiology 1997; 205: pp. 49-53.
14. Sheafor D.H., Killius J.S., Paulson E.K., et. al.: Hepatic parenchymal enhancement during triple-phase helical CT: Can it be used to predict which patients with breast cancer will develop hepatic metastases?. Radiology 2000; 214: pp. 875-880.
15. Miles K.A., Colyvas K., Griffiths M.R., et. al.: Colon cancer: risk stratification using perfusion CT. Eur Radiol 2004; 14: pp. 129.
16. Tourassi G.D.: Journey towards computer-aided diagnosis: role of image texture analysis. Radiology 1999; 213: pp. 317-320.
17. Bilello M., Gokturk S.B., Desser T., et. al.: Automatic detection and classification of hypodense hepatic lesions on contrast-enhanced venous-phase CT. Med Phys 2004; 31: pp. 2584-2593.
18. Gletsos M., Mougiakakou S.G., Metsopoulos G.K., et. al.: A computer-aided diagnostic system to characterize CT focal liver lesions: design and optimization of a neural network classifier. IEEE Trans Inf Technol Biomed 2003; 7: pp. 153-162.
19. Klein H.M., Klose K.C., Eisele T., et. al.: The diagnosis of focal liver lesions by the texture analysis of dynamic computed tomograms. [in German] Rofo 1993; 159: pp. 10-15.
20. Kim T., Federle M.P., Baron R.L., et. al.: Discrimination of small hepatic hemangiomas from hypervascular malignant tumors smaller than 3 cm with three-phase helical CT. Radiology 2001; 219: pp. 699-706.
21. Semler L., Dettori L., Furst J.: Wavelet-based texture classification of tissues in computed tomography. IEEE CBMS 2005; pp. 265-270.
22. Agam G., Wu C.: Probabilistic modeling based vessel enhancement in thoracic CT scans. IEEE CVPR 2005; 2: pp. 649-654.
23. Mir A.H., Hanmandlu M., Tandon S.N.: Texture analysis of CT-images for early detection of liver malignancy. Biomed Sci Instrum 1995; 31: pp. 213-217.
24. Dixon A.K., Walshe J.M.: Computed tomography of the liver in Wilson disease. J Comp Assisted Tomogr 1984; 8: pp. 46-49.
25. Bezy-Wendling J., Kretowski M., Rolland Y., et. al.: Towards a better understanding of texture in vascular CT scan simulated images. IEEE Trans Biomed Eng 2001; 48: pp. 120-124.
26. Miles K.A., Hayball M.P., Dixon A.K.: Functional images of hepatic perfusion obtained with dynamic computed tomography. Radiology 1993; 188: pp. 405-411.
27. Kruskal J.B., Thomas P., Kane R.A., et. al.: Hepatic perfusion changes in mice livers with developing colorectal cancer metastases. Radiology 2004; 231: pp. 482-490.
28. Moertel C.G.: Drug therapy: chemotherapy for colorectal cancer. N Engl J Med 1994; 330: pp. 1136-1142.
29. Hugier M., Maheswari S., Toussaint P., et. al.: Hepatic flow scintigraphy in evaluation of hepatic metastases with gastrointestinal malignancy. Arch Surg 1993; 128: pp. 1057-1059.
30. Marr D.: Representing the image: zero-crossings and the raw primal sketch.Wilson J.Monsour P.Vision.1982.W.H. Freeman and CompanySan Francisco:pp. 54-68.