
Rationale and Objectives
The aim of this study was to identify the optimal parameter configuration of a new algorithm for fully automatic segmentation of hepatic vessels, evaluating its accuracy in view of its use in a computer system for three-dimensional (3D) planning of liver surgery.
Materials and Methods
A phantom reproduction of a human liver with vessels up to the fourth subsegment order, corresponding to a minimum diameter of 0.2 mm, was realized through stereolithography, exploiting a 3D model derived from a real human computed tomographic data set. Algorithm parameter configuration was experimentally optimized, and the maximum achievable segmentation accuracy was quantified for both single two-dimensional slices and 3D reconstruction of the vessel network, through an analytic comparison of the automatic segmentation performed on contrast-enhanced computed tomographic phantom images with actual model features.
Results
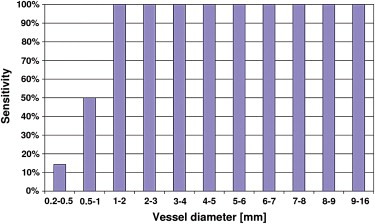
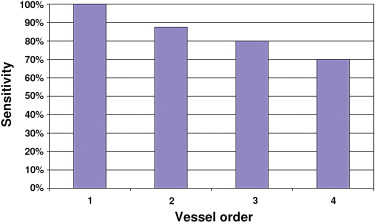
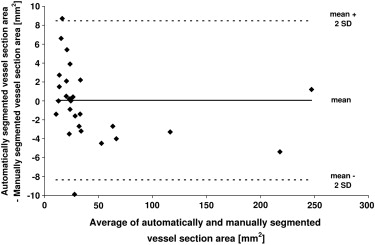
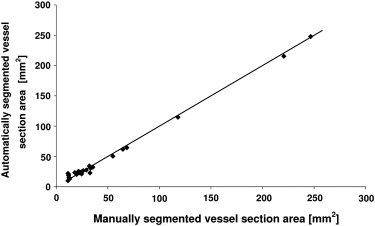
The optimal algorithm configuration resulted in a vessel detection sensitivity of 100% for vessels > 1 mm in diameter, 50% in the range 0.5 to 1 mm, and 14% in the range 0.2 to 0.5 mm. An average area overlap of 94.9% was obtained between automatically and manually segmented vessel sections, with an average difference of 0.06 mm 2 . The average values of corresponding false-positive and false-negative ratios were 7.7% and 2.3%, respectively.
Conclusions
A robust and accurate algorithm for automatic extraction of the hepatic vessel tree from contrast-enhanced computed tomographic volume images was proposed and experimentally assessed on a liver model, showing unprecedented sensitivity in vessel delineation. This automatic segmentation algorithm is promising for supporting liver surgery planning and for guiding intraoperative resections.
Recent literature has highlighted the need for methods that allow planning liver operations on the basis of individual patient data . The liver has a complex internal anatomy, which in some cases may differ notably from commonly adopted schematic classifications , thus making liver resection a challenging operation.
Planning systems for liver surgery use specific algorithms to identify relevant anatomic structures within images obtained through computed tomographic (CT) or magnetic resonance imaging. The most crucial step is the segmentation process, consisting of the assignment of image voxels to anatomic structures. In fact, any kind of localized liver treatment requires the same information: fine liver surface segmentation, accurate detection of tumors, and precise vessel topography . Automatic liver segmentation is a challenging task, because the liver usually shares image intensity values with other nearby organs (eg, the kidneys), and the boundaries of target structures are generally not sharp . As a consequence, several liver segmentation methods have been implemented and validated in recent years, showing numerous possible compromises between segmentation accuracy, computational complexity, and the degree of algorithm automation .
Get Radiology Tree app to read full this article<
Get Radiology Tree app to read full this article<
Get Radiology Tree app to read full this article<
Get Radiology Tree app to read full this article<
Get Radiology Tree app to read full this article<
Get Radiology Tree app to read full this article<
Materials and methods
Liver Phantom Production Processes and Measurements
Get Radiology Tree app to read full this article<
Get Radiology Tree app to read full this article<
Liver CAD Model
Get Radiology Tree app to read full this article<
Get Radiology Tree app to read full this article<
Get Radiology Tree app to read full this article<
Get Radiology Tree app to read full this article<
STL Apparatus
Get Radiology Tree app to read full this article<
Get Radiology Tree app to read full this article<
Get Radiology Tree app to read full this article<
Liver Phantom Fabrication
Get Radiology Tree app to read full this article<
Get Radiology Tree app to read full this article<
Get Radiology Tree app to read full this article<
CAD Model Correction and Final Phantom Assembly
Get Radiology Tree app to read full this article<
Get Radiology Tree app to read full this article<
k=AphantomAmodel, k
=
A
phantom
A
model
,
where A phantom is the vessel section area measured on phantom images, and A model is the area of the same vessel section measured on the CAD model. The k values obtained for each vessel section were averaged over each of the six images considered, and the average of the resulting six mean values was assumed as the correction factor for vessel section areas throughout the entire phantom.
Get Radiology Tree app to read full this article<
Get Radiology Tree app to read full this article<
Get Radiology Tree app to read full this article<
Acquisition of CECT Images
Phantom Filling Procedure
Get Radiology Tree app to read full this article<
Get Radiology Tree app to read full this article<
Get Radiology Tree app to read full this article<
Get Radiology Tree app to read full this article<
Image Acquisition
Get Radiology Tree app to read full this article<
Get Radiology Tree app to read full this article<
Image Segmentation and Experimental Optimization of Algorithm Configuration
Get Radiology Tree app to read full this article<
Get Radiology Tree app to read full this article<
v=⎧⎩⎨0[1−exp(−R2A2α2)]⋅exp(R2B2β2)⋅[1−exp(−S22c2)]if λ2>0 or λ3>0otherwise, v
=
{
0
if λ
2
0 or λ
3
0
[
1
−
exp
(
−
R
A
2
2
α
2
)
]
⋅
exp
(
R
B
2
2
β
2
)
⋅
[
1
−
exp
(
−
S
2
2
c
2
)
]
otherwise
,
where
RA=|λ2||λ3|, R
A
=
|
λ
2
|
|
λ
3
|
,
RB=|λ1||λ2⋅λ3|√, R
B
=
|
λ
1
|
|
λ
2
⋅
λ
3
|
,
S=λ21+λ22+λ23−−−−−−−−−−√, S
=
λ
1
2
+
λ
2
2
+
λ
3
2
,
and α, β, and c are constant coefficients having the following values: α = 0.5, β = 0.5, and c = 5.
Get Radiology Tree app to read full this article<
Get Radiology Tree app to read full this article<
Get Radiology Tree app to read full this article<
v0=maxv(σ)σ. v
0
=
max
v
(
σ
)
σ
.
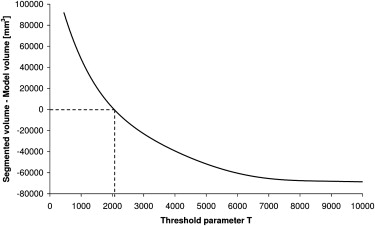
Finally, the value of v 0 for each image voxel was compared with an experimentally determined threshold parameter T to decide whether the considered voxel had to be depicted as a vessel voxel in the final output image. At the end of the segmentation process, the segmented liver structures could be viewed either as a 3D object or as a sequence of 2D slices through ITK-SNAP.
Get Radiology Tree app to read full this article<
Get Radiology Tree app to read full this article<
Get Radiology Tree app to read full this article<
Techniques for Segmentation Accuracy Evaluation
Get Radiology Tree app to read full this article<
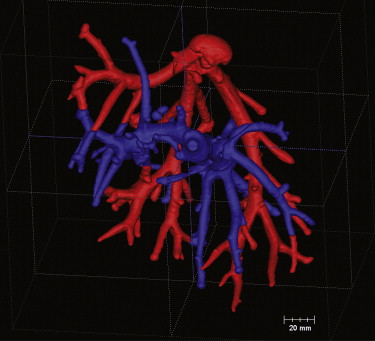
Three-Dimensional Analysis of the Segmented Vessel Tree
Get Radiology Tree app to read full this article<
Get Radiology Tree app to read full this article<
Get Radiology Tree app to read full this article<
sensitivity=TPTP+FN, sensitivity
=
TP
TP
+
FN
,
where TP represents the true-positives (ie, phantom vessels that were correctly segmented by the algorithm) and FN the “false-negatives” (ie, phantom vessels that were not identified by the algorithm).
Get Radiology Tree app to read full this article<
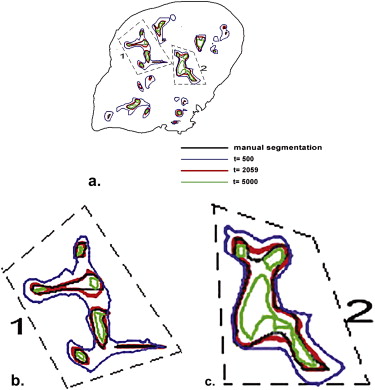
Two-Dimensional Analysis of Liver Slices
Get Radiology Tree app to read full this article<
Get Radiology Tree app to read full this article<
Get Radiology Tree app to read full this article<
Get Radiology Tree app to read full this article<
DSC=2(M1∩A1)M1+A1, DSC
=
2
(
M
1
∩
A
1
)
M
1
+
A
1
,
FPR=2(M0∩A1)M1+A1, FPR
=
2
(
M
0
∩
A
1
)
M
1
+
A
1
,
and
FNR=2(M1∩A0)M1+A1, FNR
=
2
(
M
1
∩
A
0
)
M
1
+
A
1
,
where A and M represent, respectively, automatic and manual segmentation, and 1 and 0 correspond, respectively, to the consideration of vessel and parenchyma pixels.
Get Radiology Tree app to read full this article<
Results
CAD Model Correction
Get Radiology Tree app to read full this article<
Get Radiology Tree app to read full this article<
Optimization of Algorithm Threshold Parameter
Get Radiology Tree app to read full this article<
Get Radiology Tree app to read full this article<
Get Radiology Tree app to read full this article<
Get Radiology Tree app to read full this article<
Get Radiology Tree app to read full this article<
Get Radiology Tree app to read full this article<
Get Radiology Tree app to read full this article<
Get Radiology Tree app to read full this article<
Get Radiology Tree app to read full this article<
Get Radiology Tree app to read full this article<
Three-Dimensional Analysis of the Segmented Vessel Tree
Get Radiology Tree app to read full this article<
Get Radiology Tree app to read full this article<
Get Radiology Tree app to read full this article<
Get Radiology Tree app to read full this article<
Get Radiology Tree app to read full this article<
Get Radiology Tree app to read full this article<
Table 1
Number of Vessels in the Phantom and Number of Vessels Identified by the Automatic Segmentation Algorithm, Grouped by Corresponding Subsegment Order
Vessel Order Total 1 (9.8–16.0 mm) 2 (0.4–9.4 mm) 3 (0.5–3.1 mm) 4 (0.2–2.0 mm) Phantom vessels 2 16 15 10 43 Segmented vessels 2 14 12 7 35
Get Radiology Tree app to read full this article<
Two-Dimensional Analysis of Liver Slices
Get Radiology Tree app to read full this article<
Get Radiology Tree app to read full this article<
Get Radiology Tree app to read full this article<
Get Radiology Tree app to read full this article<
Discussion
Get Radiology Tree app to read full this article<
Get Radiology Tree app to read full this article<
Get Radiology Tree app to read full this article<
Get Radiology Tree app to read full this article<
Get Radiology Tree app to read full this article<
Get Radiology Tree app to read full this article<
Get Radiology Tree app to read full this article<
Get Radiology Tree app to read full this article<
Get Radiology Tree app to read full this article<
Conclusions
Get Radiology Tree app to read full this article<
Get Radiology Tree app to read full this article<
Get Radiology Tree app to read full this article<
Get Radiology Tree app to read full this article<
Acknowledgments
Get Radiology Tree app to read full this article<
Get Radiology Tree app to read full this article<
References
1. Lehmann K.S., Ritz J.-P., Valdeig S., et. al.: Portal vein segmentation of a 3D-planning system for liver surgery—in vivo evaluation in a porcine model. Ann Surg Oncol 2008; 15: pp. 1899-1907.
2. Coinaud C.: Le foie: etudes anatomiques et chirurgicales.1957.MassonParis, France
3. Fasel J.H.D., Selle D., Evertsz C.J.G., et. al.: Segmental anatomy of the liver: poor correlation with CT. Radiology 1998; 206: pp. 151-156.
4. van Leeuwen M.S., Fernandez M.A., van Es H.W., et. al.: Variations in venous and segmental anatomy of the liver: two- and three-dimensional MR imaging in healthy volunteers. AJR Am J Roentgenol 1994; 162: pp. 1337-1345.
5. Fischer L., Cardenas C., Thorn M., et. al.: Limits of Coinaud’s liver segment classification: a quantitative computer-based three-dimensional analysis. J Comput Assist Tomogr 2002; 26: pp. 962-967.
6. Fischer L., Thorn M., Neumann J.O., et. al.: The segments of the hepatic veins—is there a spatial correlation to the Coinaud liver segments?. Eur J Radiol 2005; 53: pp. 245-255.
7. Lamata P., Lamata F., Sojar V., et. al.: Use of the Resection Map system as guidance during hepatectomy. Surg Endosc 2010; 24: pp. 2327-2337.
8. Massoptier L., Casciaro S.: Segmentation of liver anatomy and pathology.Casciaro S.Samset E.Novel technologies for minimally invasive therapies.2007.Lupiensis Biomedical PublicationsLecce, Italy:pp. 57-66.
9. Masutani Y., Uozumi K., Akahane M., et. al.: Liver CT image processing: a short introduction of the technical elements. Eur J Radiol 2006; 58: pp. 246-251.
10. Saitoh T., Tamura Y., Kaneko T.: Automatic segmentation of liver region based on extracted blood vessels. Syst Comput Japan 2004; 35: pp. 633-641.
11. Lamecker H., Lange T., Seebaß M.: Segmentation of the liver using a 3D statistical shape model. ZIB Technical Report 04-09.2004.Zuse Institute BerlinBerlin, Germany
12. Okada T., Shimada R., Hori M., et. al.: Automated segmentation of the liver from 3D CT images using probabilistic atlas and multilevel statistical shape model. Acad Radiol 2008; 15: pp. 1390-1403.
13. Liu F., Zhao B., Kijewski P.K.: Liver segmentation for CT images using GVF snake. Med Phys 2005; 32: pp. 3699-3706.
14. Massoptier L., Casciaro S.: A new fully automatic and robust algorithm for fast segmentation of liver tissue and tumors from CT scans. Eur Radiol 2008; 18: pp. 1658-1665.
15. Sboarina A., Foroni R.I., Minicozzi A., et. al.: Software for hepatic vessel classification: feasibility study for virtual surgery. Int J Comput Assist Radiol Surg 2010; 5: pp. 39-48.
16. Kamiyama T., Nakagawa T., Nakanishi K., et. al.: Preoperative evaluation of hepatic vasculature by three-dimensional computed tomography in patients undergoing hepatectomy. World J Surg 2006; 30: pp. 400-409.
17. Hansen C., Zidowitz S., Hindennach M., et. al.: Interactive determination of robust safety margins for oncologic liver surgery. Int J Comput Assist Radiol Surg 2009; 4: pp. 469-474.
18. Osada S., Yoshida K., Saji S.: A novel strategy by cryoablation for advanced hepatoma. Anticancer Res 2009; 29: pp. 5203-5209.
19. Elhawary H., Oguro S., Tuncali K., et. al.: Multimodality non-rigid image registration for planning, targeting and monitoring during CT-guided percutaneous liver tumor cryoablation. Acad Radiol 2010; 17: pp. 1334-1344.
20. Fagnoni F.F., Zerbini A., Pelosi G., et. al.: Combination of radiofrequency ablation and immunotherapy. Front Biosci 2008; 13: pp. 369-381.
21. Meijerink M.R., van Waesberghe J.H., van der Weide L., et. al.: Early detection of local RFA site recurrence using total liver volume perfusion CT: initial experience. Acad Radiol 2009; 16: pp. 1215-1222.
22. Frericks B.B., Ritz J.P., Albrecht T., et. al.: Influence of intrahepatic vessels on volume and shape of percutaneous thermal ablation zones: in vivo evaluation in a porcine model. Invest Radiol 2008; 43: pp. 211-218.
23. Albrecht D., Germer C.T., Isbert C., et. al.: Interstitial laser coagulation: evaluation of the effect of normal liver blood perfusion and the application mode on lesion size. Lasers Surg Med 1998; 23: pp. 40-47.
24. Frericks B.B., Ritz J.P., Roggan A., et. al.: Multipolar radiofrequency ablation of hepatic tumors: initial experience. Radiology 2005; 237: pp. 1056-1062.
25. Isbert C., Roggan A., Ritz J.P., et. al.: Laser-induced thermo-therapy: intra- and extralesionary recurrence after incomplete destruction of experimental liver metastasis. Surg Endosc 2001; 15: pp. 1320-1326.
26. Ritz J.P., Isbert C., Roggan A., et. al.: Laser-induced thermo-therapy of liver metastases. Front Radiat Ther Oncol 2004; 38: pp. 106-121.
27. Esneault S., Lafon C., Dillenseger J.-L.: Liver vessels segmentation using a hybrid geometrical moments/graph cuts method. IEEE Trans Biomed Eng 2010; 57: pp. 276-283.
28. Kaftan J.N., Tek H., Aach T.: A two stage approach for fully automatic segmentation of venous vascular structures in liver CT images.Pluim J.P.W.Dawant B.M.Medical imaging 2009: image processing.2009.SPIEOrlando, FL: 725911-1–12
29. Greco A., Esposito Corcione C., Maffezzoli A.: Temperature evolution during stereolithography building with a commercial epoxy resin. Polym Eng Sci 2006; 46: pp. 493-502.
30. Greco A., Licciulli A., Maffezzoli A.: Stereolithography of ceramic suspensions. J Mater Sci 2001; 36: pp. 99-105.
31. Corcione C., Greco A., Montagna F., et. al.: Silica moulds built by stereolithography. J Mater Sci 2005; 40: pp. 4899-4904.
32. Licciulli A., Corcione C., Greco A., et. al.: Laser stereolithography of ZrO 2 toughened Al 2 O 3 . J Eur Ceramic Soc 2005; 25: pp. 1581-1589.
33. Corcione C., Montagna F., Greco A., et. al.: Free form fabrication of silica moulds for aluminum casting by stereolithography. J Rapid Prototyping 2006; 12: pp. 184-188.
34. Frangi A.F., Niessen W.J., Vincken K.L., et. al.: Multiscale vessel enhancement filtering.Wells W.M.Colchester A.Delp S.L.1998.Springer VerlagBerlin, Germany:pp. 130-137.
35. Altman D.G., Bland J.M.: Measurements in medicine: the analysis of method comparison studies. Statistician 1983; 32: pp. 307-317.
36. Frericks B.B., Caldarone F.C., Nashan B., et. al.: 3D CT modeling of hepatic vessel architecture and volume calculation in living donated liver transplantation. Eur Radiol 2004; 14: pp. 326-333.
37. Radtke A., Nadalin S., Sotiropoulos G.C., et. al.: Computer-assisted operative planning in adult living donor liver transplantation: a new way to resolve the dilemma of the middle hepatic vein. World J Surg 2007; 31: pp. 175-185.
38. Lang H., Radtke A., Hindennach M., et. al.: Impact of virtual tumor resection and computer-assisted risk analysis on operation planning and intraoperative strategy in major hepatic resection. Arch Surg 2005; 140: pp. 629-638.
39. Lamade W., Glombitza G., Fischer L., et. al.: The impact of 3-dimensional reconstructions on operation planning in liver surgery. Arch Surg 2000; 135: pp. 1256-1261.
40. Frericks B.B., Kirchhoff T.D., Shin H.O., et. al.: Preoperative volume calculation of the hepatic venous draining areas with multi-detector row CT in adult living donor liver transplantation: impact on surgical procedure. Eur Radiol 2006; 16: pp. 2803-2810.
41. Lang H., Radtke A., Liu C., et. al.: Extended left hepatectomy-modified operation planning based on three-dimensional visualization of liver anatomy. Langenbecks Arch Surg 2004; 389: pp. 306-310.
42. Fuchs J., Warmann S.W., Sieverding L., et. al.: Impact of virtual imaging procedures on treatment strategies in children with hepatic vascular malformations. J Pediatr Gastroenterol Nutr 2010; 50: pp. 67-73.
43. Takahashi K., Sasaki R., Kondo T., et. al.: Preoperative 3D volumetric analysis for liver congestion applied in a patient with hilar cholangiocarcinoma. Langenbecks Arch Surg 2010; 395: pp. 761-765.