
Rationale and Objectives
The study aimed to evaluate the feasibility of imaging or tracking hepatocellular carcinoma cells by modifying these cells to carry a multimodality reporter gene, enabling fluorescence, bioluminescence, and magnetic resonance imaging (MRI) in vitro and in vivo.
Materials and Methods
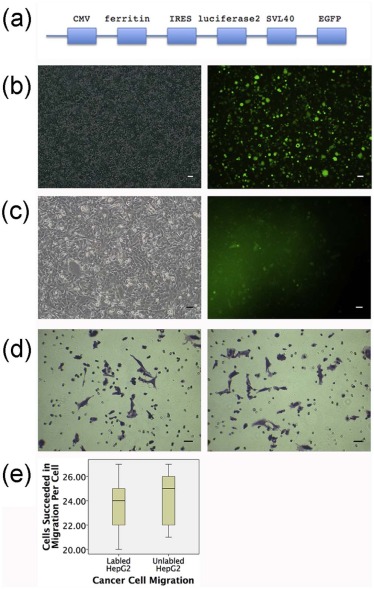
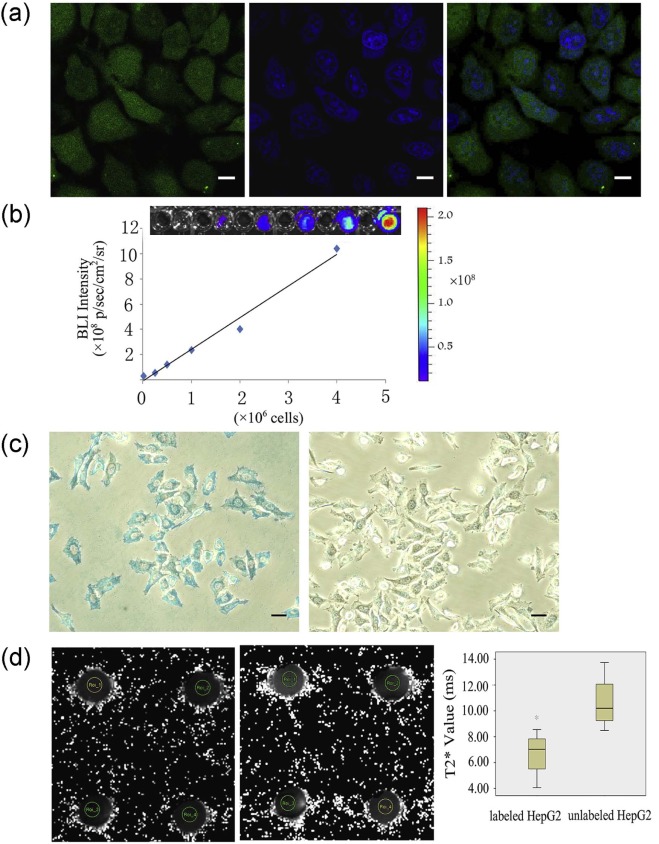
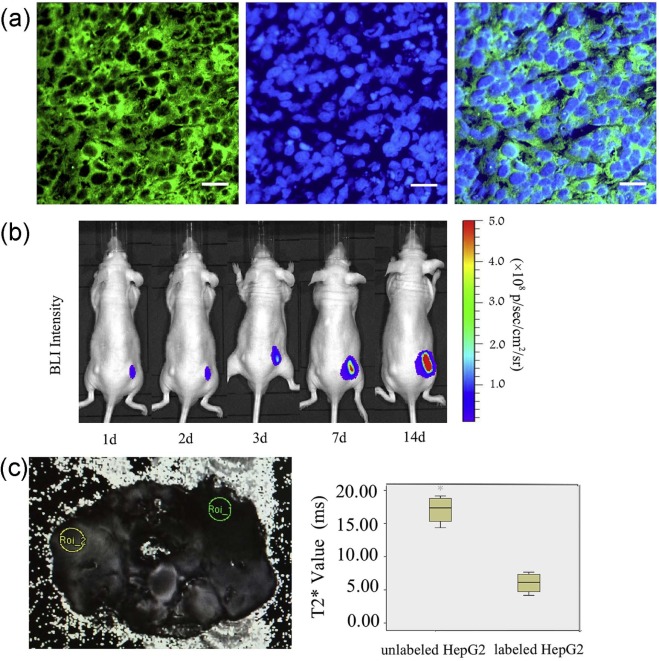
HepG2 cells were labeled with the enhanced green fluorescent protein (EGFP)/luciferase2/ferritin—the multimodality reporter gene (labeled HepG2 cells). The labeled and unlabeled HepG2 cells were cultured in vitro and then injected subcutaneously into mice as a hepatoma model in vivo. The expressions of EGFP, luciferase2, and ferritin in HepG2 cell suspensions and hepatoma model were investigated using fluorescence, bioluminescence, and MRI.
Results
Individual HepG2 cells expressing EGFP were identified under blue laser excitation. The linear coefficient between the optical signal intensity of luciferase2 and the number of labeled cells was 0.993. MRI was used to distinguish the T2* signal of 2 × 10 7 cells/mL between the labeled (6.67 ± 1.88 ms) and unlabeled cells (10.66 ± 2.22 ms) ( P = 0.034). In vivo, individual HepG2 cells expressing EGFP in frozen sections were observed. Labeled cells expressing luciferase2 have been detected since the second day after injection, and the bioluminescence increased with the tumor size. The T2* signal was significantly different between the labeled (6.04 ± 1.60 ms) and unlabeled cells (17.06 ± 2.17 ms) ( P < 0.001).
Conclusions
A multimodality reporter gene consisting of EGFP, luciferase2, and ferritin was successfully integrated into the HepG2 cell genome via a lentiviral vector and was highly expressed in the daughter cells. These cells could be detected by fluorescence, bioluminescence, and MRI in vitro and in vivo.
Introduction
Hepatocellular carcinoma (HCC) is one of the most common forms of cancer and is the fifth most prevalent cause of tumor-related death globally . The absolute number of new HCC cases continues to increase, and HCC is projected to remain as the largest cancer burden for the next several decades. Although advancements in gene diagnosis and treatment modalities have helped improve the survival and prognosis of HCC patients, HCC diagnosis predominantly depends on imaging studies such as computed tomography and magnetic resonance imaging (MRI), limiting the early diagnosis of the disease . Several biomarkers have been proposed , but no available theory can explain how these malignant cells are capable of evading immune clearance or when and where they prefer to reside and metastasize. This limited knowledge has hindered our understanding of the pathologic changes caused by HCC and our identification of potential therapeutic targets. Thus, tracing or imaging HCC cells in vitro and in vivo at the molecular level is a challenge for the treatment of HCC.
Gene imaging , which is a distinct imaging from exogenous tracers, can be visualized stably in cells, enabling the precise localization of labeled cells. Both optical imaging and MRI facilitate the noninvasive tracking of transplanted cells in living organisms. Due to its advantages in terms of sensitivity and specificity, bioluminescent reporters are among the most widely used, as they can provide qualitative and quantitative information about the cells . However, due to photo attenuation and light scattering within deep tissues, bioluminescence imaging (BLI) lacks tomographic resolution and limits its application to small animals or superficial areas . Ferritin has been used as a T2*-weighted MRI probe to dynamically track cells in vivo because of the low-intensity signals generated from T2*-weighted MRI . In contrast to optical imaging, MRI displays the advantages of unlimited depth penetration, high spatial resolution, and multiple imaging parameters; however, MRI cannot distinguish whether or not the transplanted cells are surviving . Apparently, the combination of these two imaging tools may overcome their disadvantages while benefiting from each of their advantages to provide improved cell tracking in vivo . Moreover, because the expression of enhanced green fluorescent protein (EGFP) can be detected in single cells, the sensitivity of EGFP enables its function as a sorting and qualitative marker for cell tracing. Therefore, the expression of reporter genes that can be used for several imaging modalities in targeted cells would have complementary advantages in sensitivity and specificity and would provide a complete and precise description of the biological processes in these cells.
Get Radiology Tree app to read full this article<
Materials and Methods
Instruments and Reagents
Get Radiology Tree app to read full this article<
Plasmid Construction
Get Radiology Tree app to read full this article<
Culture and Transfection of HepG2 Cells
Get Radiology Tree app to read full this article<
Transwell Migration/Invasion Assay
Get Radiology Tree app to read full this article<
Fluorescence Analysis of EGFP for In Vitro Targeting of Labeled Cells
Get Radiology Tree app to read full this article<
Bioluminescence Analysis of Luciferase2 In Vitro
Get Radiology Tree app to read full this article<
Prussian Blue Iron Staining to Detect the Fe3+ Content in Transfected Cells
Get Radiology Tree app to read full this article<
MRI Analysis of Ferritin In Vitro
Get Radiology Tree app to read full this article<
Nude Mouse Hepatoma Model
Get Radiology Tree app to read full this article<
Get Radiology Tree app to read full this article<
Fluorescence Analysis of EGFP for In Vivo Targeting of Labeled Cells
Get Radiology Tree app to read full this article<
Bioluminescence Analysis of Luciferase2 In Vivo
Get Radiology Tree app to read full this article<
MRI Analysis of Ferritin In Vivo
Get Radiology Tree app to read full this article<
Statistical Methods
Get Radiology Tree app to read full this article<
Results
Plasmid Construction and Verification and Lentivirus Packaging
Get Radiology Tree app to read full this article<
Get Radiology Tree app to read full this article<
Get Radiology Tree app to read full this article<
Culture and Transfection of HepG2 Cells
Get Radiology Tree app to read full this article<
Cancer Cell Migration
Get Radiology Tree app to read full this article<
Fluorescence Analysis of EGFP Imaging In Vitro
Get Radiology Tree app to read full this article<
Get Radiology Tree app to read full this article<
Bioluminescence Analysis of Luciferase2 In Vitro
Get Radiology Tree app to read full this article<
Prussian Blue Iron Staining for Iron Assessment In Vitro
Get Radiology Tree app to read full this article<
MRI for Ferritin In Vitro
Get Radiology Tree app to read full this article<
Fluorescence Analysis of EGFP Imaging In Vivo
Get Radiology Tree app to read full this article<
Get Radiology Tree app to read full this article<
Bioluminescence Analysis of Luciferase2 in Vivo
Get Radiology Tree app to read full this article<
MRI for Ferritin In Vivo
Get Radiology Tree app to read full this article<
Discussion
Get Radiology Tree app to read full this article<
Get Radiology Tree app to read full this article<
Get Radiology Tree app to read full this article<
Get Radiology Tree app to read full this article<
Get Radiology Tree app to read full this article<
Get Radiology Tree app to read full this article<
Acknowledgments
Get Radiology Tree app to read full this article<
References
1. Siegel R.L., Miller K.D., Jemal A.: Cancer statistics, 2015. CA Cancer J Clin 2015; 65: pp. 5-29.
2. Tejeda-Maldonado J., García-Juárez I., Aguirre-Valadez J., et. al.: Diagnosis and treatment of hepatocellular carcinoma: an update. World J Hepatol 2015; 7: pp. 362-376.
3. Forner A., Llovet J.M., Bruix J.: Hepatocellular carcinoma. Lancet 2012; 379: pp. 1245-1255.
4. Youn H., Chung J.K.: Reporter gene imaging. AJR Am J Roentgenol 2013; 201: pp. 206-214.
5. Brader P., Serganova I., Blasberg R.G.: Noninvasive molecular imaging using reporter genes. J Nucl Med 2013; 54: pp. 167-172.
6. Lin Y., Molter J., Lee Z., et. al.: Bioluminescence imaging of hematopoietic stem cell repopulation in murine models. Methods Mol Biol 2008; 430: pp. 295-306.
7. Hasegawa S., Furukawa T., Saga T.: Molecular MR imaging of cancer gene therapy: ferritin transgene reporter takes the stage. Magn Reson Med Sci 2010; 9: pp. 37-47.
8. Shen L., Li Y., Chen J., et. al.: Generation of a recombinant classical swine fever virus stably expressing the firefly luciferase gene for quantitative antiviral assay. Antiviral Res 2014; 109: pp. 15-21.
9. Wu J.C., Sundaresan G., Iyer M., et. al.: Noninvasive optical imaging of firefly luciferase reporter gene expression in skeletal muscles of living mice. Mol Ther 2001; 4: pp. 297-306.
10. Amsalem Y., Mardor Y., Feinberg M.S., et. al.: Iron-oxide labeling and outcome of transplanted mesenchymal stem cells in the infarcted myocardium. Circulation 2007; 116: pp. 38-45.
11. Sun J.H., Teng G.J., Ju S.H., et. al.: MR tracking of magnetically labeled mesenchymal stem cells in rat kidneys with acute renal failure. Cell Transplant 2008; 17: pp. 279-290.
12. Choi S.H., Cho H., Kim H.S., et. al.: Imaging and quantification of metastatic melanoma cells in lymph nodes with a ferritin MR reporter in living mice. NMR Biomed 2012; 25: pp. 737-745.
13. Wu C., Li J., Pang P., et. al.: Polymeric vector-mediated gene transfection of MSCs for dual bioluminescent and MRI tracking in vivo. Biomaterials 2014; 35: pp. 8249-8260.
14. Li Z., Hu X., Mao J., et. al.: Optimization of mesenchymal stem cells (MSCs) delivery dose and route in mice with acute liver injury by bioluminescence imaging. Mol Imaging Biol 2015; 17: pp. 185-194.
15. Sani I.K., Marashi S.H., Kalalinia F.: Solamargine inhibits migration and invasion of human hepatocellular carcinoma cells through down-regulation of matrix metalloproteinases 2 and 9 expression and activity. Toxicol In Vitro 2015; 29: pp. 893-900.
16. Kim H.S., Joo H.J., Woo J.S., et. al.: In vivo magnetic resonance imaging of transgenic mice expressing human ferritin. Mol Imaging Biol 2013; 15: pp. 48-57.
17. Iordanova B.1., Goins W.F., Clawson D.S., et. al.: Quantification of HSV-1-mediated expression of the ferritin MRI reporter in the mouse brain. Gene Ther 2013; 20: pp. 589-596.
18. Sheth R.A., Mahmood U.: Optical molecular imaging and its emerging role in colorectal cancer. Am J Physiol Gastrointest Liver Physiol 2010; 299: pp. G807-G820.
19. Cho I.K., Moran S.P., Paudyal R., et. al.: Longitudinal monitoring of stem cell grafts in vivo using magnetic resonance imaging with inducible maga as a genetic reporter. Theranostics 2014; 4: pp. 972-989.
20. Youn H., Hong K.J.: In vivo noninvasive small animal molecular imaging. Osong Public Health Res Perspect 2012; 3: pp. 48-59.
21. Alberti C.: From molecular imaging in preclinical/clinical oncology to theranostic applications in targeted tumor therapy. Eur Rev Med Pharmacol Sci 2012; 16: pp. 1925-1933.
22. Pei Z., Lan X., Cheng Z., et. al.: A multimodality reporter gene for monitoring transplanted stem cells. Nucl Med Biol 2012; 39: pp. 813-820.
23. Wu Y., Liao Q., Yang R., et. al.: A novel luciferase and GFP dual reporter virus for rapid and convenient evaluation of hepatitis C virus replication. Virus Res 2011; 155: pp. 406-414.
24. Shimizu T., Ohta Y., Tsutsuki H., et. al.: Construction of a novel bioluminescent reporter system for investigating Shiga toxin expression of enterohemorrhagic Escherichia coli. Gene 2011; 478: pp. 1-10.
25. Vande Velde G., Raman Rangarajan J., Vreys R., et. al.: Quantitative evaluation of MRI-based tracking of ferritin-labeled endogenous neural stem cell progeny in rodent brain. Neuroimage 2012; 62: pp. 367-380.
26. Iordanova B., Ahrens E.T.: In vivo magnetic resonance imaging of ferritin-based reporter visualizes native neuroblast migration. Neuroimage 2012; 59: pp. 1004-1012.
27. Qi Y., Feng G., Huang Z., et. al.: The application of super paramagnetic iron oxide-labeled mesenchymal stem cells in cell-based therapy. Mol Biol Rep 2013; 40: pp. 2733-2740.
28. Sun N., Lee A., Wu J.C.: Long term non-invasive imaging of embryonic stem cells using reporter genes. Nat Protoc 2009; 4: pp. 1192-1201.
29. Kang J.H., Chung J.K.: Molecular-genetic imaging based on reporter gene expression. J Nucl Med 2008; 49: pp. 164S-179S.
30. Gilad A.A., Winnard P.T., van Zijl P.C., et. al.: Developing MR reporter genes: promises and pitfalls. NMR Biomed 2007; 20: pp. 275-290.