
Rationale and Objectives
Our goal was to prospectively determine the value of perfusion computed tomography (CT) in the quantitative assessment of tumor-related angiogenesis in cirrhotic patients with hepatocellular carcinoma (HCC).
Materials and Methods
Forty-seven patients met all the following inclusion criteria: 1) Child-Pugh class A or B liver cirrhosis; 2) presence of a single lesion suspected as HCC at screening ultrasound examination; and 3) lesion diameter between 1 and 3 cm. All patients underwent contrast-enhanced ultrasound, pre- and post-contrast triple-phase CT, and perfusion computed tomographic study using multidetector 16-slice CT. Six parameters related to the blood microcirculation and tissue perfusion were measured for the focal liver lesion and cirrhotic parenchyma: perfusion (P), tissue blood volume (BV), hepatic perfusion index (HPI), arterial perfusion (AP), portal perfusion (PP), and time to peak (TTP). Perfusion parameters were described with quartile values of their distribution; univariate paired and unpaired Wilcoxon signed rank tests were used for statistical analysis.
Results
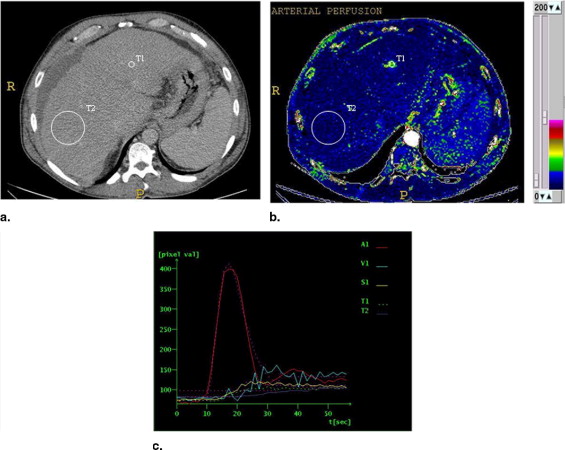
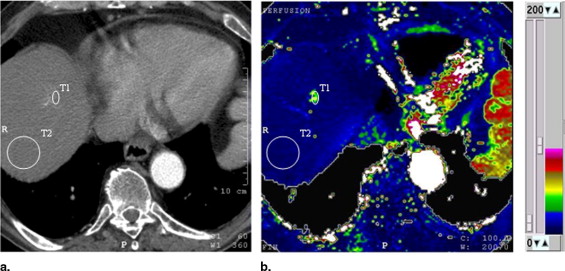
HCC was diagnosed in 21 of the 47 patients; in the remaining 26, HCC was not found at contrast-enhanced ultrasound and multidetector 16-slice computed tomographic study. The values of perfusion parameters measured within tumor tissue were: P (ml/s/100 g): median = 47.0 (first quartile = 36.0, third quartile = 61.4); BV (ml/100 mg): median = 24.0 (first quartile = 18.7, third quartile = 29.3); HPI (%): median = 78.4 (first quartile = 62.9, third quartile = 100); AP (ml/min): median = 45.9 (first quartile = 39.0, third quartile = 60.1); PP (ml/min): median = 9.0 (first quartile = 0.0, third quartile = 24.5); and TTP (seconds): median = 18.7 (first quartile = 16.3, third quartile = 26.5). The corresponding values calculated in cirrhotic surrounding parenchyma were P (ml/s/100 g): median = 11.5 (first quartile = 9.4, third quartile = 13.9); BV (ml/100 mg): median = 10.7 (first quartile = 7.1, third quartile = 14.2); HPI (%): median = 10.6 (first quartile = 8.7, third quartile = 11.9); AP (ml/min): median = 13.2 (first quartile = 10.1, third quartile = 15.5); PP (ml/min) median = 55.2 (first quartile = 40.1, third quartile = 79.5); and TTP (seconds): median = 41.7 (first quartile = 38.9, third quartile = 44.6). P, BV, HPI, and AP values were higher ( P < .001), whereas PP and TTP were lower ( P < .001) in HCC relative to the surrounding liver. Values of perfusion parameters in the cirrhotic liver of patients with and without HCC were not significantly different ( P > .001).
Conclusion
In cirrhotic patients with HCC, perfusion computed tomographic technique can provide quantitative information about tumor-related angiogenesis.
As many diseases induce early changes in tissue hemodynamic status, quantitative tissue perfusion imaging could have the ability to characterize pathologic states, establish a diagnosis, and map the response to treatment ( ). In patients with liver cirrhosis, a spectrum of focal lesions, including benign regenerative nodules, dysplastic nodules, and hepatocellular carcinoma (HCC) lesions, develop; differences in their respective blood supplies can assist in their detection and characterization ( ). Although regenerative nodules receive the majority of blood supply from the portal vein, the evolution from a low-grade dysplastic nodule to frank HCC is associated with a progression toward increasing arterial blood supply, mainly due to tumor-related arterial neovascularization (angiogenesis) ( ). This is a complex process involving endothelial cell proliferation, capillary formation, coordinated remodeling of extracellular tumor stroma, and anastomosis with the pre-existing host vasculature ( ). Tumor angiogenesis may have important implications in the diagnosis and treatment of liver tumors; therefore, the development of clinically applicable techniques enabling its characterization and quantification would be important in the management of these neoplasms ( ). Functional computed tomography (CT) with perfusion imaging is a new application in which a quantitative map of tissue perfusion is created from dynamic computed tomographic data and displayed using a color scale, allowing quantification of perfusion in absolute units at high spatial resolution ( ). Several earlier studies reporting a correlation between contrast enhancement parameters and histologic measurements of angiogenesis have suggested the possible use of perfusion computed tomographic technique as a marker of tumor angiogenesis ( ).
The purpose of this study was to determine the value of functional CT with perfusion imaging in the quantitative assessment of tumor-related arterial angiogenesis in patients with cirrhotic liver disease and HCC, as determined by the European Association for the Study of the Liver (EASL) criteria.
Materials and methods
Patients
Get Radiology Tree app to read full this article<
Contrast-Enhanced Ultrasound
Get Radiology Tree app to read full this article<
MDCT Imaging and Perfusion Computed Tomographic Protocol
Get Radiology Tree app to read full this article<
Get Radiology Tree app to read full this article<
Image Analysis and Quantification of Perfusion Parameters
Get Radiology Tree app to read full this article<
Get Radiology Tree app to read full this article<
Get Radiology Tree app to read full this article<
Get Radiology Tree app to read full this article<
Standard of Reference
Get Radiology Tree app to read full this article<
Statistical Analysis
Get Radiology Tree app to read full this article<
Results
Patients with HCC
Get Radiology Tree app to read full this article<
Perfusion Parameters in Patients with HCC
Get Radiology Tree app to read full this article<
Table 1
Descriptive Characteristics of Analyzed Perfusion Parameters
Hepatocellular Carcinoma Background Liver in Patients with Hepatocellular Carcinoma Background Liver in Patients without Hepatocellular Carcinoma Parameter Median First Quartile Third Quartile Median First Quartile Third Quartile Median First Quartile Third Quartile XP 47.0 36.0 61.4 10.4 9.3 13.2 11.5 9.4 13.9 BV 24.0 18.7 29.3 11.7 9.5 11.9 10.7 7.1 14.2 HPI 78.4 62.9 100 16.4 13.8 18.3 10.6 8.7 11.9 AP 45.9 39.0 60.1 10.4 9.5 11.9 13.2 10.1 15.5 PP 9.0 0 24.5 55.2 40.1 79.5 72.5 62.8 92.7 TTP 18.7 16.3 26.5 44.6 40.3 51.8 41.7 38.9 44.6
AP, arterial perfusion (ml/min); BV, tissue blood volume (ml/100 g); HPI, hepatic perfusion index (%); PP, portal perfusion (ml/min); TTP, time to peak (TTP, seconds); XP, hepatic perfusion (mL/s/100 g).
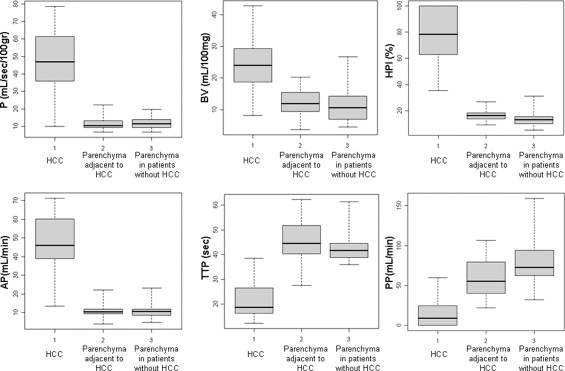
![Figure 4, Box plots of difference of perfusion parameters (perfusion [P], tissue blood volume [BV], hepatic perfusion index [HPI], arterial perfusion [AP], portal perfusion [PP], and time to peak [TTP]) between hepatocellular carcinoma and surrounding liver (21 patients). The lower boundary of boxes indicates 25th percentile, line within boxes marks median, and the higher boundary of boxes indicates 75th percentile. Errors bars below and above boxes indicate minimum and maximum values, respectively.](https://storage.googleapis.com/dl.dentistrykey.com/clinical/HepatocellularCarcinomainCirrhoticLiverDisease/3_1s20S1076633208001037.jpg)
Get Radiology Tree app to read full this article<
Patients without HCC
Get Radiology Tree app to read full this article<
Perfusion Parameters in Patients without HCC
Get Radiology Tree app to read full this article<
Discussion
Get Radiology Tree app to read full this article<
Get Radiology Tree app to read full this article<
Get Radiology Tree app to read full this article<
Get Radiology Tree app to read full this article<
Get Radiology Tree app to read full this article<
Get Radiology Tree app to read full this article<
Get Radiology Tree app to read full this article<
Conclusion
Get Radiology Tree app to read full this article<
References
1. Miles K.A., Hayball M., Dixon A.K.: Colour perfusion imaging: A new application of computed tomography. Lancet 1991; 337: pp. 643-645.
2. Itai Y., Matsui O.: Blood flow and liver imaging. Radiology 1997; 202: pp. 306-314.
3. Matsui O., Kadoya M., Kameyama T., et. al.: Benign and malignant nodules in cirrhotic livers: Distinction based on blood supply. Radiology 1991; 178: pp. 493-497.
4. Park Y.N., Yang C.P., Fernandez G.J., Cubukcu O., Thung S.N., Theise N.D.: Neoangio-genesis and sinusoidal capillarization in dysplastic nodules of the liver. Am J Surg Pathol 1998; 22: pp. 656-662.
5. Pluda J.M.: Tumor-associated angiogenesis: Mechanisms, clinical applications and therapeutic strategies. Semin Oncol 1997; 24: pp. 203-218.
6. Pandharipande P.V., Krinsky G.A., Rusinek H., Lee V.S.: Perfusion imaging of the liver: Current challenges and future goals. Radiology 2005; 234: pp. 661-673.
7. Miles K.A., Hayball M.P., Dixon A.K.: Functional images of hepatic perfusion obtained with dynamic CT. Radiology 1993; 188: pp. 405-411.
8. Miles K.A., Griffiths M.R.: Perfusion CT: A worthwhile enhancement?. Br J Radiol 2003; 76: pp. 220-231.
9. Miles K.A.: Perfusion CT for the assessment of tumour vascularity: Which protocol?. Br J Radiol 2003; 76: pp. 36-42.
10. Miles K.A., Charnsangavej C., Lee F.T., Fishman E.K., Horton K., Lee T.Y.: Application of CT in the investigation of angiogenesis in oncology. Acad Radiol 2000; 7: pp. 840-850.
11. Cuenod C.A., Leconte I., Siauve N., et. al.: Deconvolution technique for measuring tissue perfusion by dynamic CT: Application to normal and metastatic liver. Acad Radiol 2002; 9: pp. 205-211.
12. Van Beers B.E., Leconte I., Materne R., Smith A.M., Jamart J., Horsmans Y.: Hepatic perfusion parameters in chronic liver disease: Dynamic CT measurements correlated with disease severity. AJR Am J Roentgenol 2001; 176: pp. 667-673.
13. Bruix J., Sherman M., Llovet J.M., et. al.: Clinical management of hepatocellular carcinoma: Conclusions of the Barcelona–2000 EASL Conference. J Hepatol 2001; 35: pp. 421-430.
14. Bruix J., Sherman M.: Management of hepatocellular carcinoma. Hepatology 2005; 42: pp. 337-356.
15. Hollander M., Wolfe D.A.: Nonparametric Statistical Methods.2nd ed.1999.John Wiley and SonsNew York
16. Tsushima Y., Funabasama S., Aoki J.: Quantitative perfusion map of malignant liver tumors created from dynamic computed tomography data. Acad Radiol 2004; 11: pp. 215-223.
17. Passe T.J., Bluemke D.A., Siegelman S.S.: Tumor angiogenesis: Tutorial on implications for imaing. Radiology 1997; 203: pp. 593-600.
18. Li W.W.: Tumor angiogenesis: Molecular pathology, therapeutic targeting, and imaging. Acad Radiol 2000; 7: pp. 800-811.
19. Hayashi M., Matsui O., Ueda K., et. al.: Correlation between the blood supply and grade of malignancy of hepatocellular nodules associated with liver cirrhosis: Evaluation by CT during intraarterial injection of contrast medium. AJR Am J Roentgenol 1999; 172: pp. 969-976.
20. Kim C.K., Lim J.H., Park C.K., et. al.: Neoangiogenesis and sinusoidal capillarization in hepatocellular carcinoma: Correlation between dynamic CT and density of tumor microvessels. Radiology 2005; 237: pp. 529-534.
21. Fournier L.S., Cuenod C.A., de Bazelaire C., et. al.: Early modifications of hepatic perfusion measured by functional CT in a rat model of hepatocellular carcinoma using a blood pool contrast agent. Eur Radiol 2004; 14: pp. 2125-2133.
22. Kan Z., Kobayashi S., Phongkitkarun S., Charnsangavej C.: Functional CT quantification of tumor perfusion after transhepatic arterial embolization in a rat model. Radiology 2005; 1: pp. 144-150.
23. Kan Z., Phongkitkarun S., Kobayashi S., et. al.: Functional CT for quantifying tumor perfusion in antiangiogenic therapy in a rat model. Radiology 2005; 237: pp. 151-158.
24. Swensen S.J., Brown L.R., Colby T.V., Weaver A.L., Midthun D.E.: Lung nodule enhancement at CT: Prospective findings. Radiology 1996; 201: pp. 447-455.
25. Zhang M., Kono M.: Solitary pulmonary nodules: Evaluation of blood flow patterns with dynamic CT. Radiology 1997; 205: pp. 471-478.
26. Dugdale P.E., Miles K.A., Kelly B.B., Bunce I.H., Legget D.A.C.: CT measurements of perfusion and permeability within lymphoma masses: Relationship to grade, activity and chemotherapeutic response. J Comput Assist Tomogr 1999; 23: pp. 540-547.
27. Boone J.M.: Multidetector CT: Opportunities, challenges, and concerns associated with scanners with 64 or more detector rows. Radiology 2006; 241: pp. 334-337.