
Rationale and Objectives
Diffusion tensor imaging has been used to characterize tumor heterogeneity and invasion in human glioblastoma. Recently, higher order diffusion tensors have been proposed as solutions to errors associated with diffusion tensor imaging estimates of complex microstructures. The purpose of the current study was to examine higher order diffusion characteristics in human glioblastoma prior to surgical resection using the fourth-order diffusion tensor model.
Materials and Methods
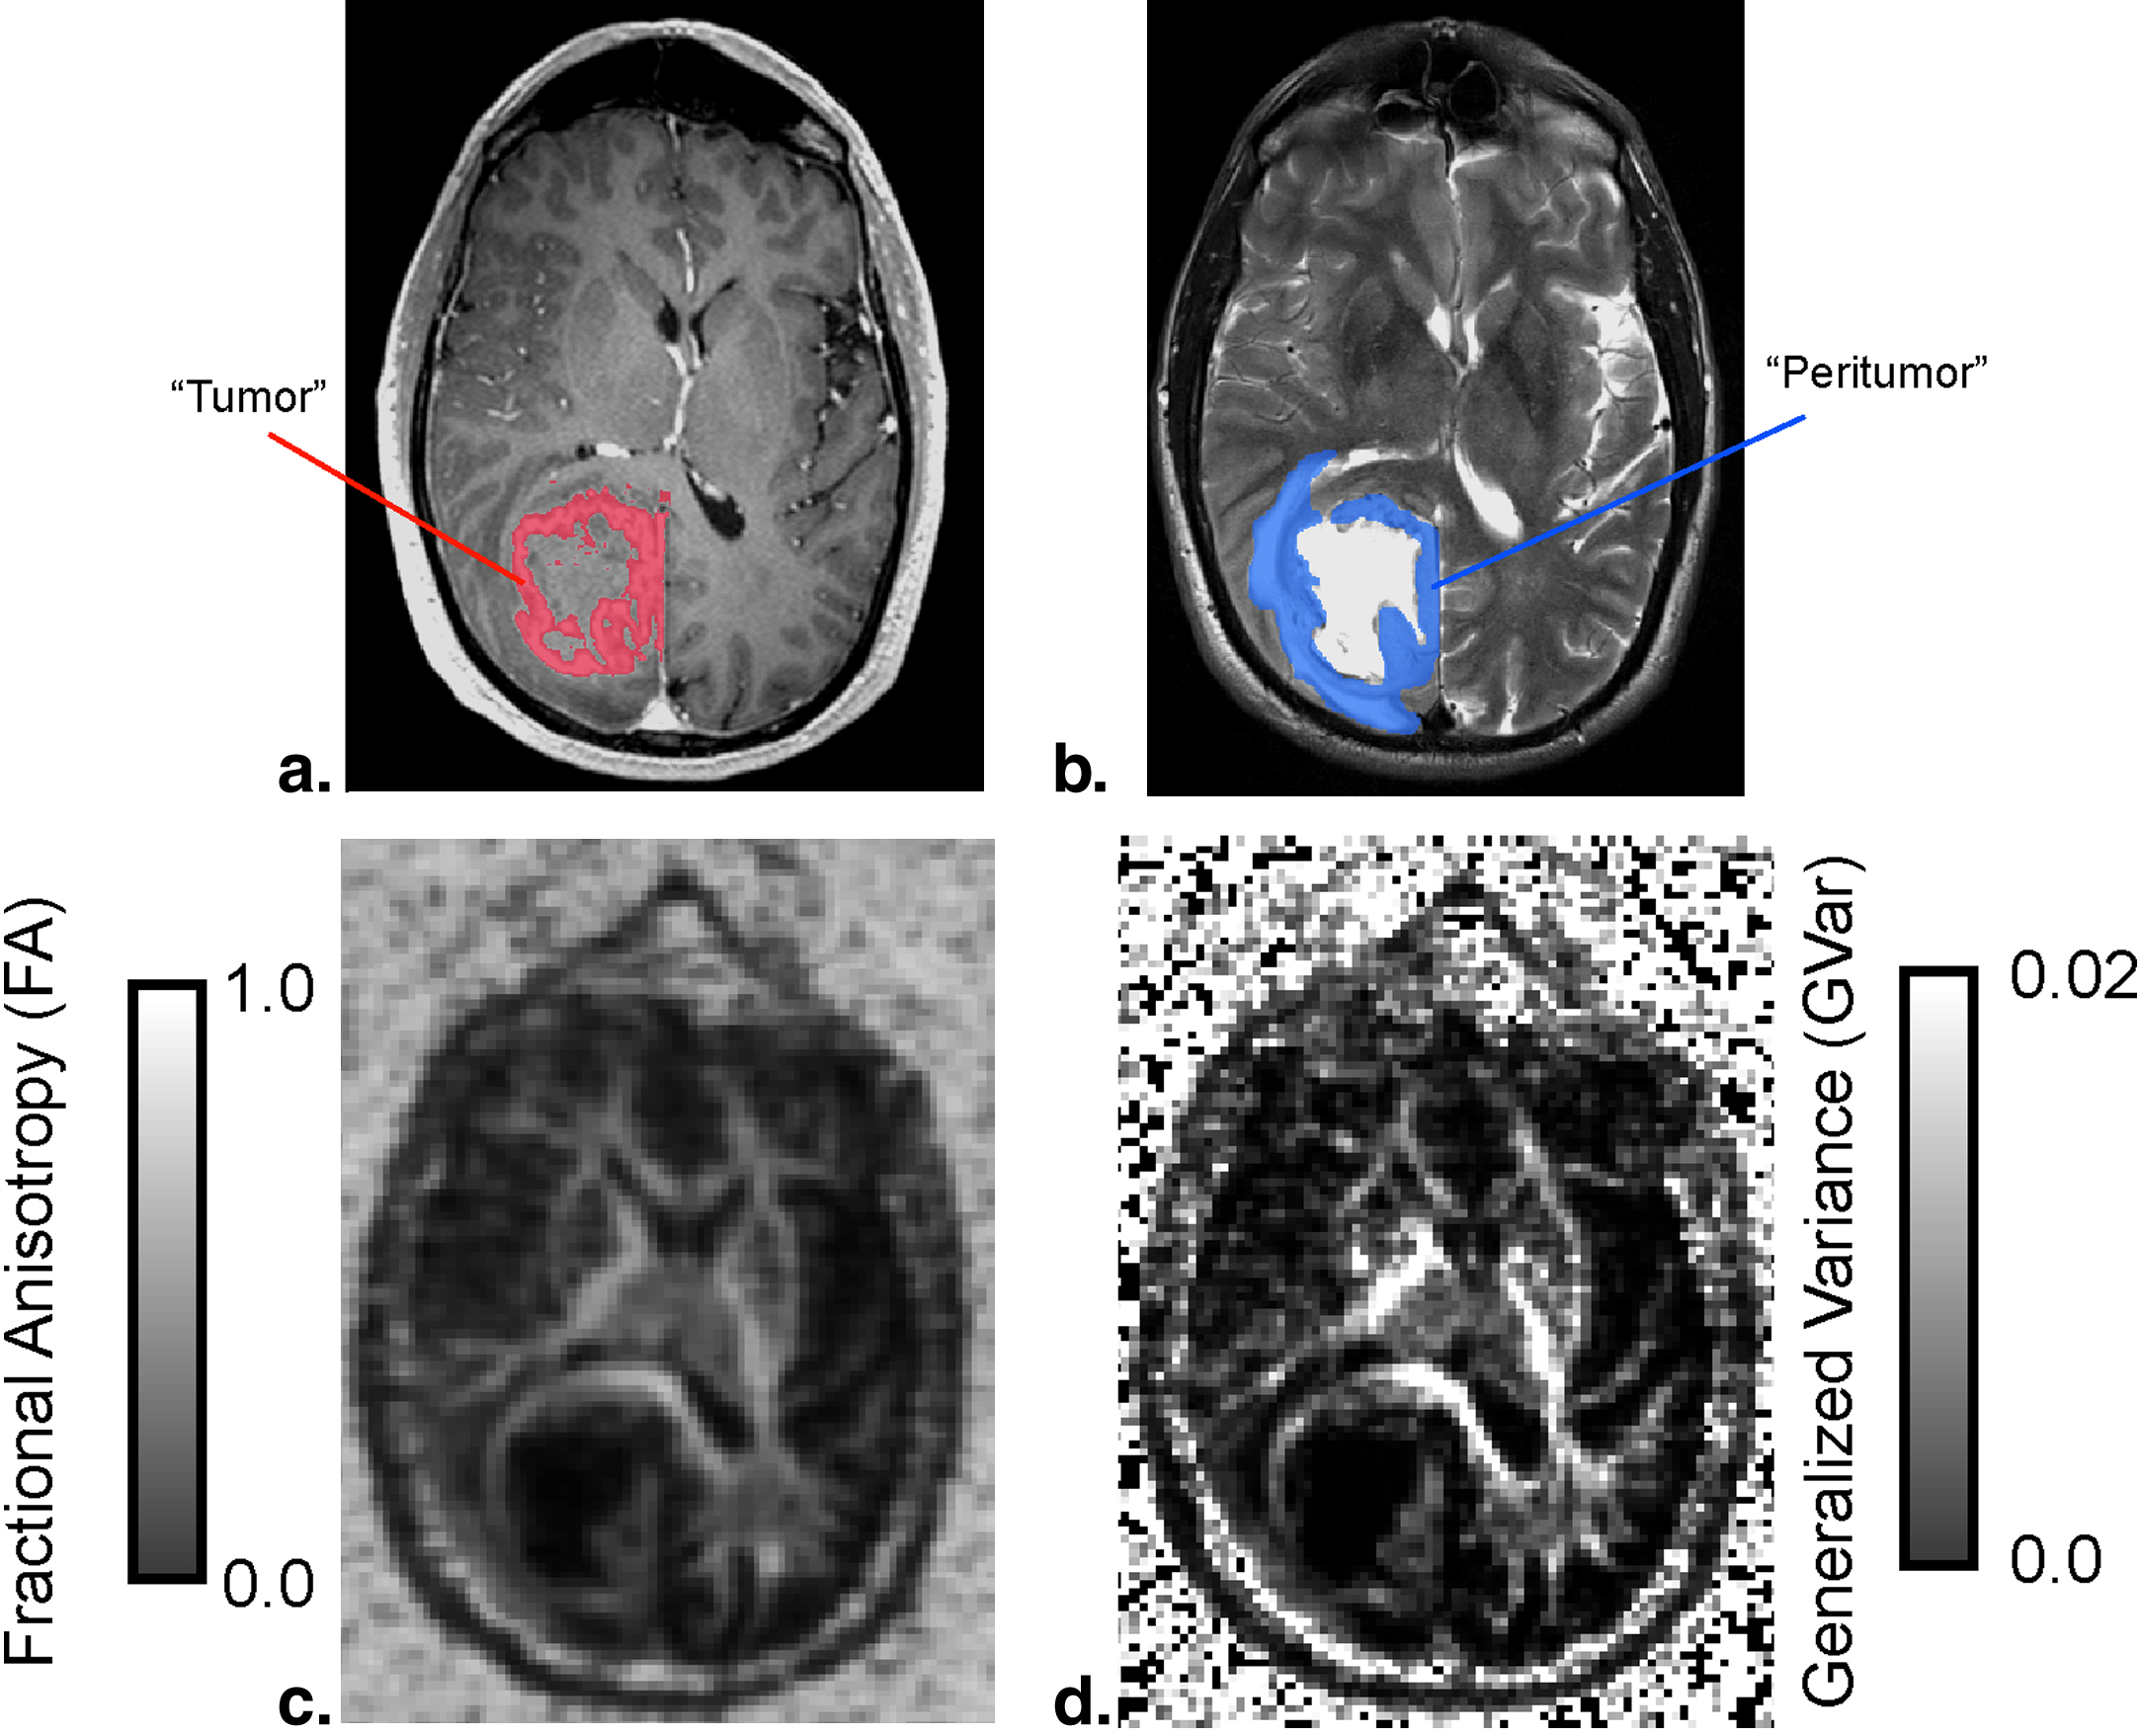
Twenty-five patients with newly diagnosed glioblastoma participated in the study. Diffusion-weighted images were collected in 21 directions. The second-order (traditional) and fourth-order diffusion tensors were calculated and compared in regions of contrast enhancement, T2 signal abnormality, and normal-appearing white matter.
Results
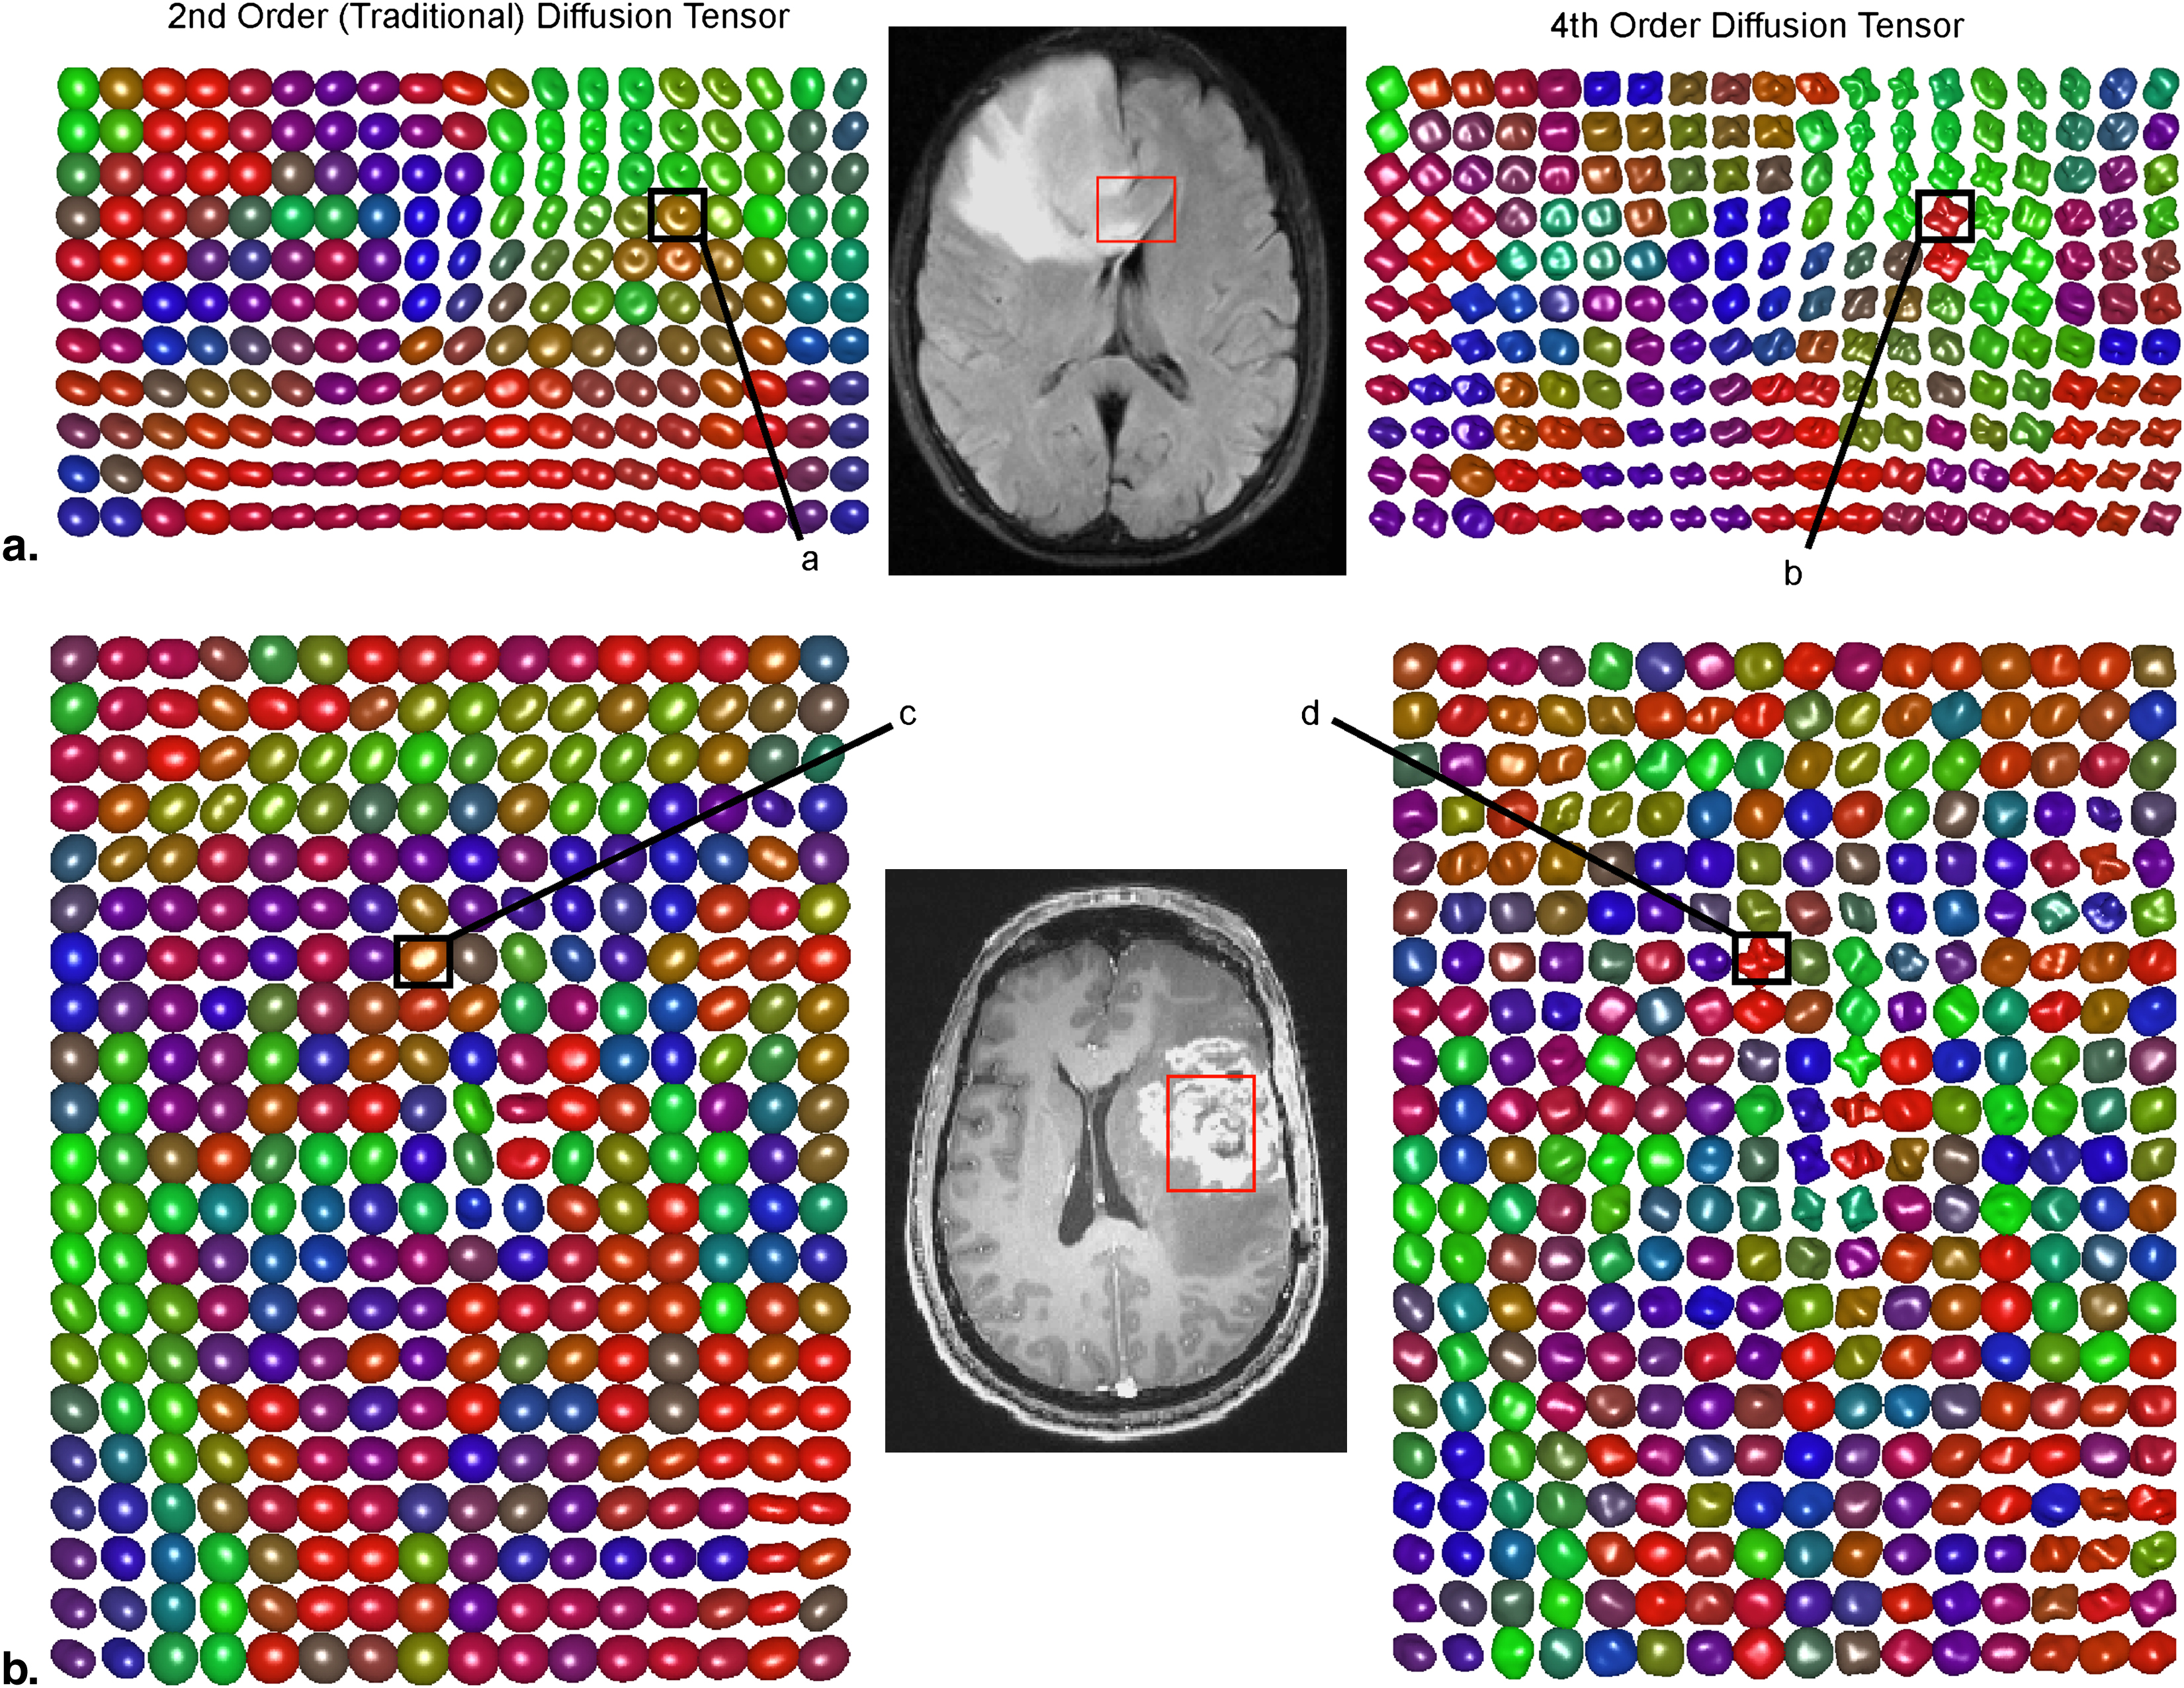
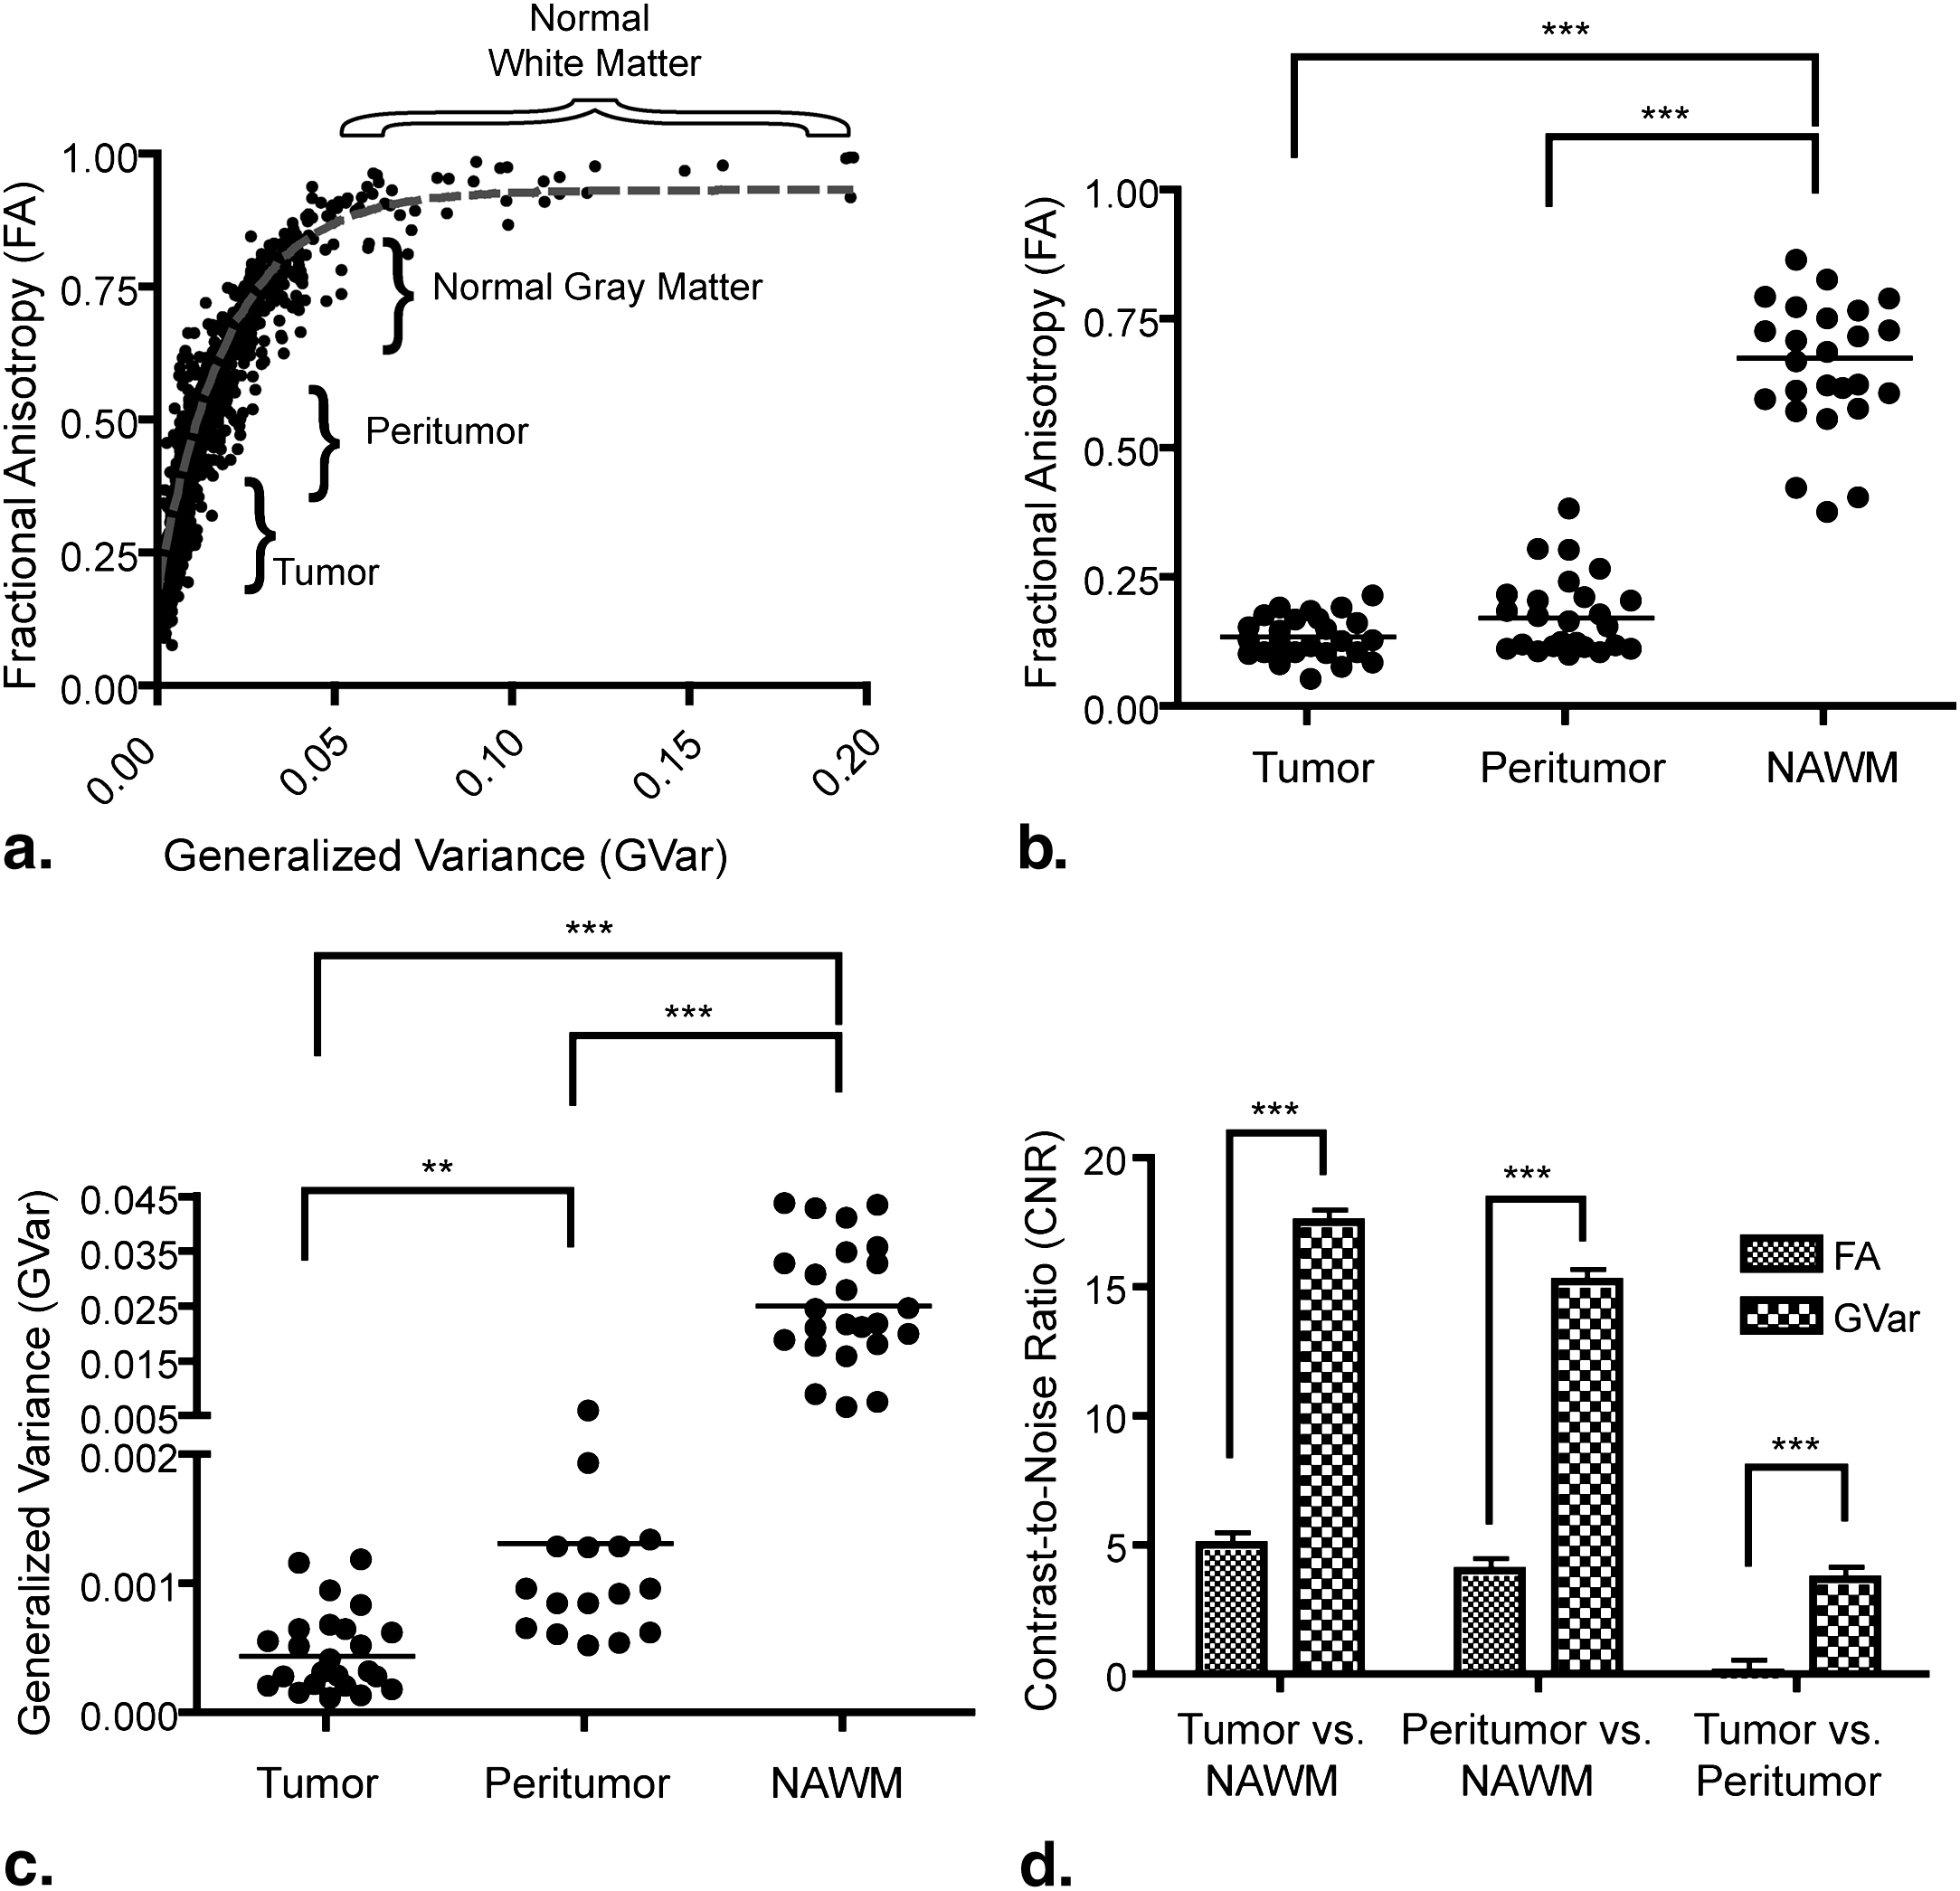
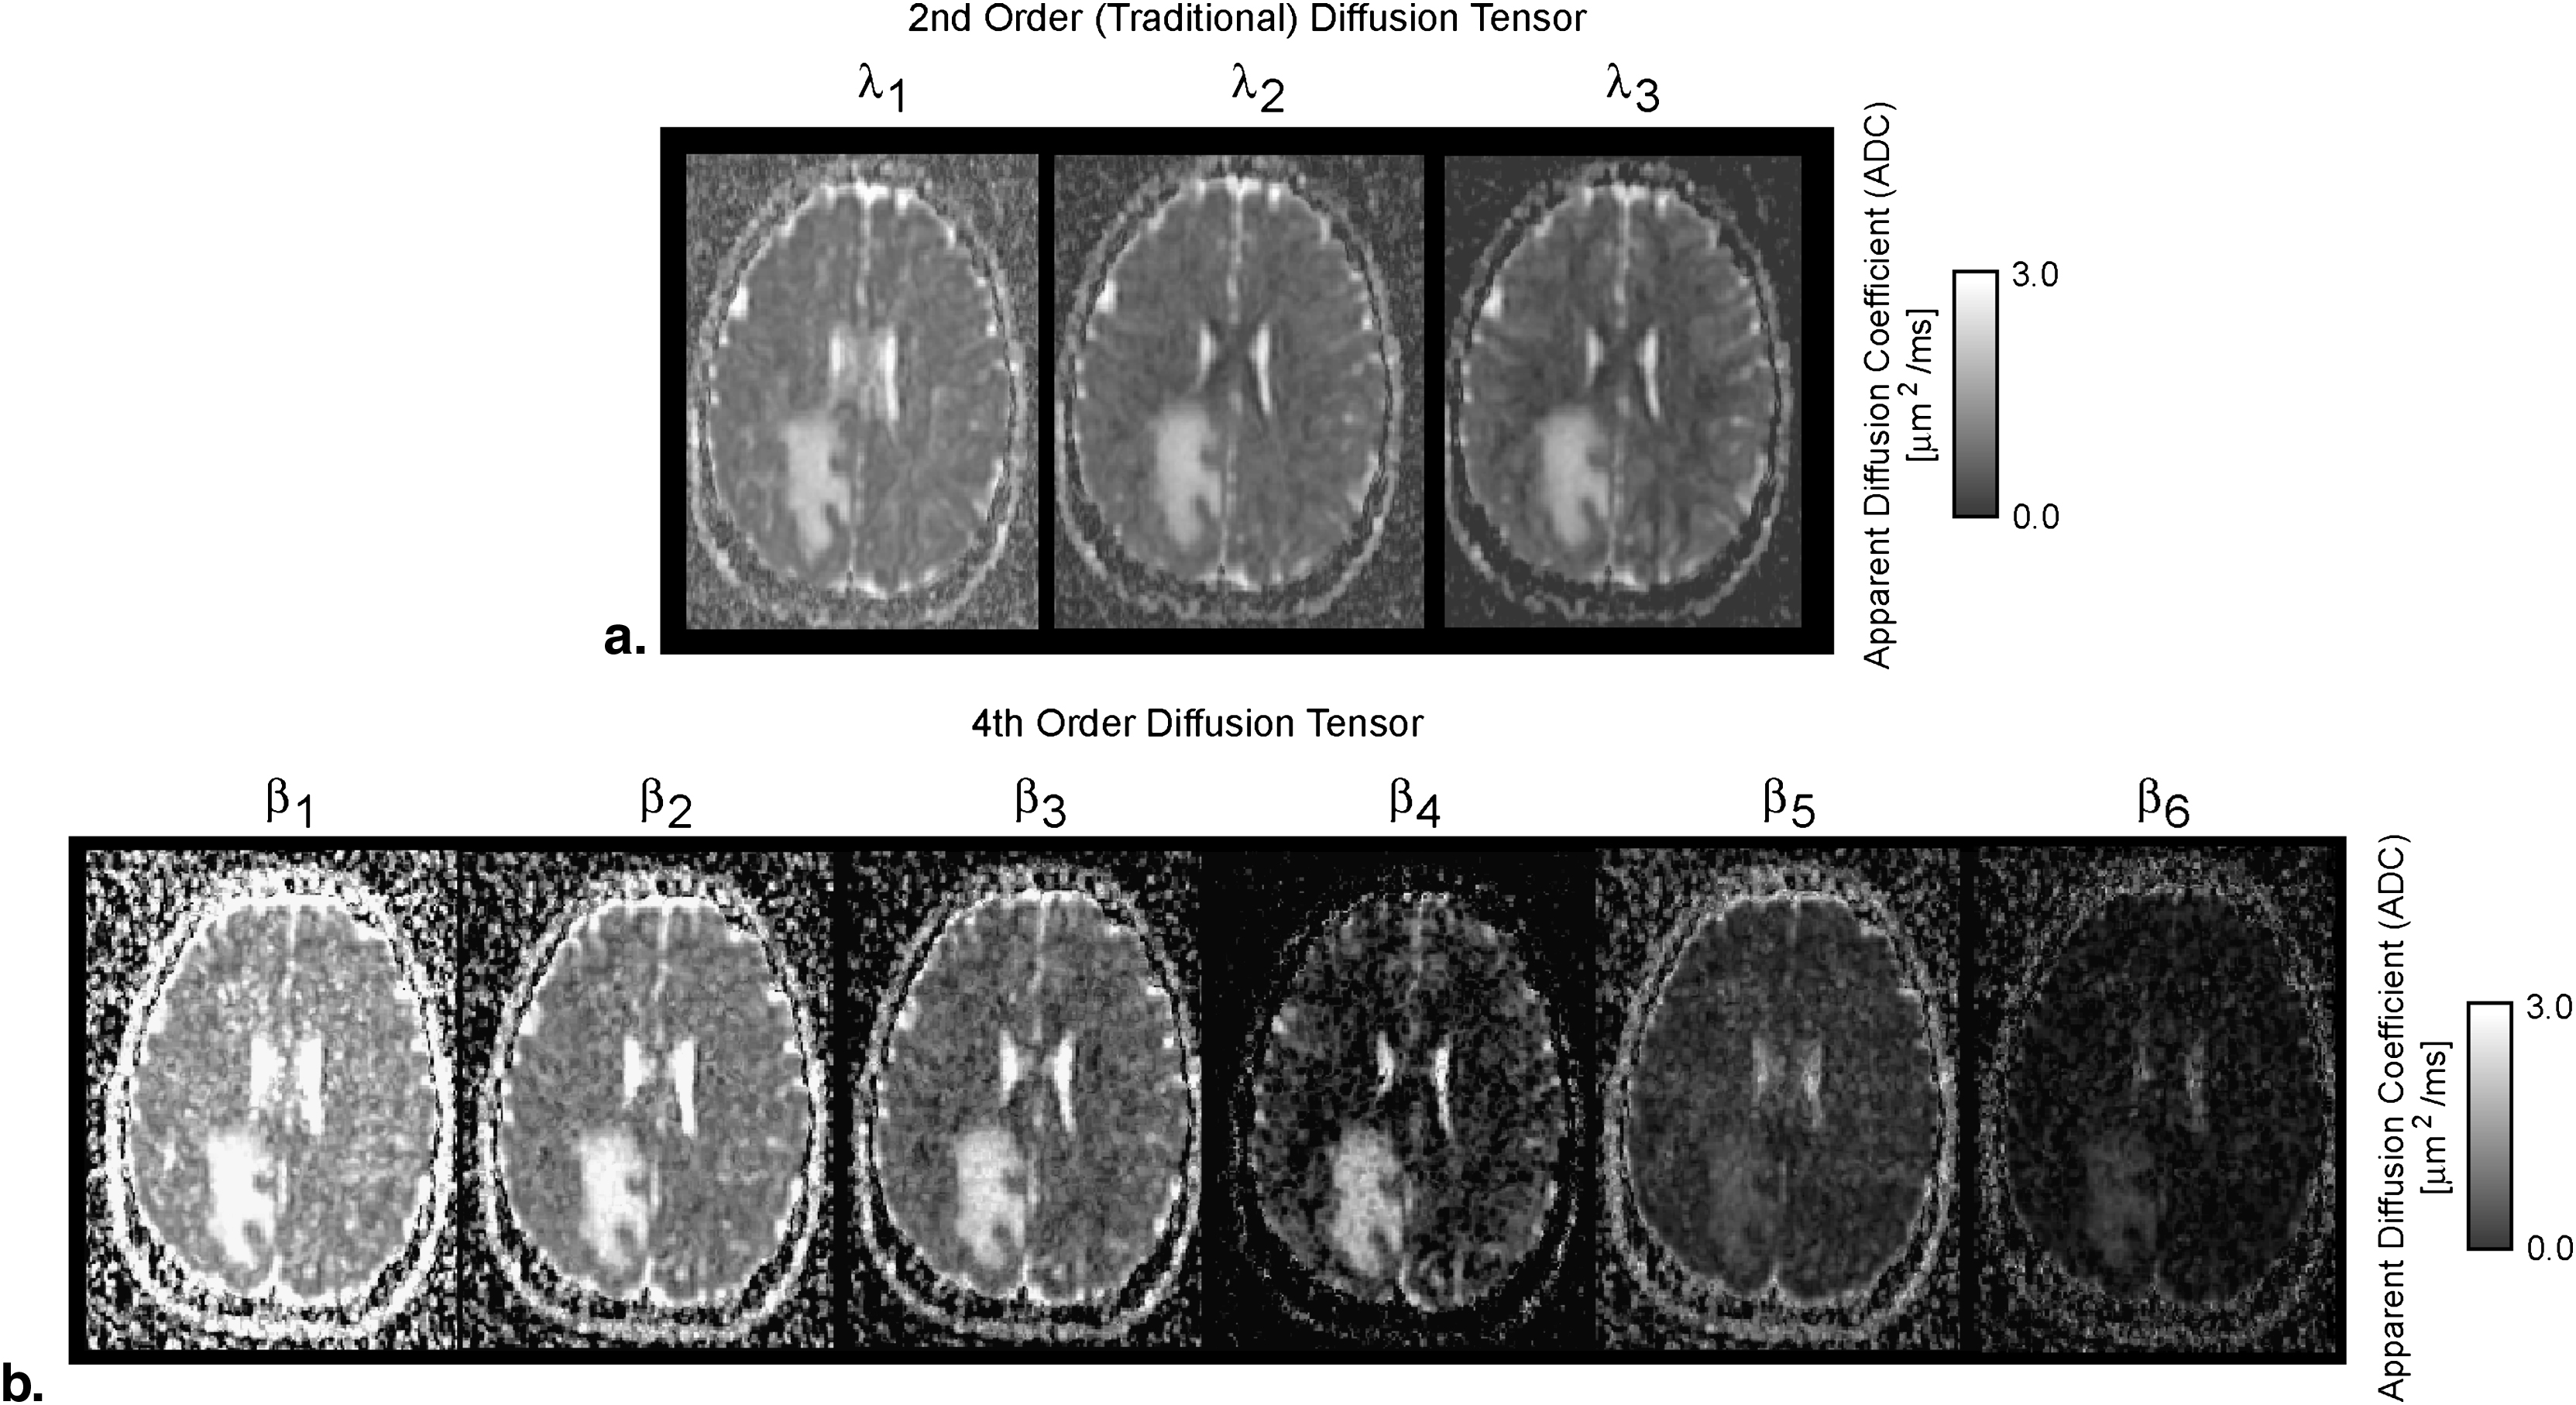
Orientation distribution functions were strikingly different between the two tensor models, particularly in regions with tumor heterogeneity and/or regions of suspected tumor invasion. Image contrast was significantly higher in fourth-order scalar measures compared to second-order scalars. Results of particular eigenvalues and scalars using the fourth-order tensor showed differences between T2 abnormal regions and contrast enhancement, whereas second-order eigenvalues and scalars did not show differences. This suggests that higher order diffusion images could potentially be more sensitive to tumor invasion.
Conclusions
These results suggest that the fourth-order diffusion tensor has the ability to add value to second-order (traditional) diffusion tensor imaging in the evaluation of glioblastoma.
Diffusion-weighted magnetic resonance imaging (MRI) techniques are highly sensitive to the underlying microstructural characteristics of biologic tissues. This sensitivity to subvoxel, microscopic features has helped provide insight into many physiologic changes that occur as a result of brain tumor growth and invasion, such as cerebral edema , hypoxia , the increase in diffusion observed after successful radiotherapy due to cell breakdown , and the change in diffusion characteristics resulting from increasing tumor cellularity and invasion . Additionally, diffusion magnetic resonance characteristics have been shown to be predictive and prognostic biomarkers in new brain tumor therapeutics and have shown utility in histopathologic grading of gliomas .
Diffusion tensor imaging (DTI) involves the addition of directional encoding to diffusion measurements, allowing novel structural information about the microenvironment to be acquired. For example, in normal tissues, DTI typically shows high diffusion anisotropy within tightly packed white matter fiber bundles because of diffusion restriction perpendicular to axon fibers. This high degree of diffusion anisotropy within white matter regions provides the basis for DTI tractography , in which pseudoaxonal tracts are “grown” from seed regions placed within white matter tracts. For relatively simple tissue structures, such as the thick white matter bundle within the corpus callosum, the “traditional” diffusion tensor model may be an adequate representation of the general tissue architecture. For more complex tissues, “nontraditional” diffusion models may be beneficial.
Get Radiology Tree app to read full this article<
Get Radiology Tree app to read full this article<
Materials and methods
Patients
Get Radiology Tree app to read full this article<
MRI
Get Radiology Tree app to read full this article<
Diffusion MRI Data
Get Radiology Tree app to read full this article<
Conventional Second-order DTI and Scalar Metrics
Get Radiology Tree app to read full this article<
D=⎡⎣⎢DxxDyxDzxDxyDyyDzyDxzDyzDzz⎤⎦⎥. D
=
[
D
x
x
D
x
y
D
x
z
D
y
x
D
y
y
D
y
z
D
z
x
D
z
y
D
z
z
]
.
Get Radiology Tree app to read full this article<
Get Radiology Tree app to read full this article<
Fourth-order DTI and Scalar Metrics
Get Radiology Tree app to read full this article<
Δ=⎡⎣⎢⎢⎢⎢⎢⎢⎢⎢⎢⎢⎢⎢⎢⎢⎢⎢⎢⎢DxxxxDxxxyDxxxzDxxxyDxxyyDxxyzDxxxzDxxyzDxxzzDxxxyDxxyyDxxyzDxxyyDxyyyDxyyzDxxyzDxyyzDxyzzDxxxzDxxyzDxxzzDxxyzDxyyzDxyzzDxxzzDxyzzDxzzzDxxxyDxxyyDxxyzDxxyyDxyyyDxyyzDxxyzDxyyzDxyzzDxxyyDxyyyDxyyzDxyyyDyyyyDyyyzDxyyzDyyyzDyyzzDxxyzDxyyzDxyzzDxyyzDyyyzDyyzzDxyzzDyyzzDyzzzDxxxzDxxyzDxxzzDxxyzDxyyzDxyzzDxxzzDxyzzDxzzzDxxyzDxyyzDxyzzDxyyzDyyyzDyyzzDxyzzDyyzzDyzzzDxxzzDxyzzDxzzzDxyzzDyyzzDyzzzDxzzzDyzzzDzzzz⎤⎦⎥⎥⎥⎥⎥⎥⎥⎥⎥⎥⎥⎥⎥⎥⎥⎥⎥⎥ Δ
=
[
D
x
x
x
x
D
x
x
x
y
D
x
x
x
z
D
x
x
x
y
D
x
x
y
y
D
x
x
y
z
D
x
x
x
z
D
x
x
y
z
D
x
x
z
z
D
x
x
x
y
D
x
x
y
y
D
x
x
y
z
D
x
x
y
y
D
x
y
y
y
D
x
y
y
z
D
x
x
y
z
D
x
y
y
z
D
x
y
z
z
D
x
x
x
z
D
x
x
y
z
D
x
x
z
z
D
x
x
y
z
D
x
y
y
z
D
x
y
z
z
D
x
x
z
z
D
x
y
z
z
D
x
z
z
z
D
x
x
x
y
D
x
x
y
y
D
x
x
y
z
D
x
x
y
y
D
x
y
y
y
D
x
y
y
z
D
x
x
y
z
D
x
y
y
z
D
x
y
z
z
D
x
x
y
y
D
x
y
y
y
D
x
y
y
z
D
x
y
y
y
D
y
y
y
y
D
y
y
y
z
D
x
y
y
z
D
y
y
y
z
D
y
y
z
z
D
x
x
y
z
D
x
y
y
z
D
x
y
z
z
D
x
y
y
z
D
y
y
y
z
D
y
y
z
z
D
x
y
z
z
D
y
y
z
z
D
y
z
z
z
D
x
x
x
z
D
x
x
y
z
D
x
x
z
z
D
x
x
y
z
D
x
y
y
z
D
x
y
z
z
D
x
x
z
z
D
x
y
z
z
D
x
z
z
z
D
x
x
y
z
D
x
y
y
z
D
x
y
z
z
D
x
y
y
z
D
y
y
y
z
D
y
y
z
z
D
x
y
z
z
D
y
y
z
z
D
y
z
z
z
D
x
x
z
z
D
x
y
z
z
D
x
z
z
z
D
x
y
z
z
D
y
y
z
z
D
y
z
z
z
D
x
z
z
z
D
y
z
z
z
D
z
z
z
z
]
Get Radiology Tree app to read full this article<
Get Radiology Tree app to read full this article<
Regions of Interest (ROIs), Contrast-to-noise Ratio (CNR), and Statistical Analyses
Get Radiology Tree app to read full this article<
CNR=mtissue1−mtissue2σ. CNR
=
m
tissue
1
−
m
tissue
2
σ
.
Where m tissue is the average measurement within the tissue, and σ is the standard deviation of the background image noise. Last, a repeated-measures analysis of variance (ANOVA) was performed to compare diffusion measurements among each of the ROIs outlined above (ie, tumor, peritumor, and NAWM). Tukey’s test for multiple comparisons test was used if the ANOVA showed statistical significance.
Get Radiology Tree app to read full this article<
Results
Get Radiology Tree app to read full this article<
Get Radiology Tree app to read full this article<
Get Radiology Tree app to read full this article<
Get Radiology Tree app to read full this article<
Get Radiology Tree app to read full this article<
Get Radiology Tree app to read full this article<
Get Radiology Tree app to read full this article<
Discussion
Get Radiology Tree app to read full this article<
Get Radiology Tree app to read full this article<
Get Radiology Tree app to read full this article<
Get Radiology Tree app to read full this article<
Study Limitations
Get Radiology Tree app to read full this article<
Get Radiology Tree app to read full this article<
References
1. Pavlisa G., Rados M., Pavlisa G., et. al.: The differences of water diffusion between brain tissue infiltrated by tumor and peritumoral vasogenic edema. Clin Imaging 2009; 33: pp. 96-101.
2. McMillan K.M., Rogers B.P., Field A.S., et. al.: Physiologic characterisation of glioblastoma multiforme using MRI-based hypoxia mapping, chemical shift imaging, perfusion and diffusion maps. J Clin Neurosci 2006; 13: pp. 811-817.
3. Chenevert T.L., Stegman L.D., Taylor J.M., et. al.: Diffusion magnetic resonance imaging: an early surrogate marker of therapeutic efficacy in brain tumors. J Natl Cancer Inst 2000; 92: pp. 2029-2036.
4. Ellingson B.M., Malkin M.G., Rand S.D., et. al.: Validation of functional diffusion maps (fDMs) as a biomarker for human glioma cellularity. J Magn Reson Imaging 2010; 31: pp. 538-548.
5. Lu S., Ahn D., Johnson G., et. al.: Diffusion-tensor MR imaging of intracranial neoplasia and associated peritumoral edema: introduction of the tumor infiltration index. Radiology 2004; 232: pp. 221-228.
6. Gerstner E.R., Chen P.J., Wen P.Y., et. al.: Infiltrative patterns of glioblastoma spread detected via diffusion MRI after treatment with cediranib. Neuro Oncol 2010; 12: pp. 466-472.
7. Pope W.B., Kim H.J., Huo J., et. al.: Recurrent glioblastoma multiforme: ADC histogram analysis predicts response to bevacizumab treatment. Radiology 2009; 252: pp. 182-189.
8. Khayal I.S., Polley M.Y., Jalbert L., et. al.: Evaluation of diffusion parameters as early biomarkers of disease progression in glioblastoma multiforme. Neuro Oncol 2010; 12: pp. 908-916.
9. Ellingson B.M., Malkin M.G., Rand S.D., et. al.: Volumetric analysis of functional diffusion maps is a predictive imaging biomarker for cytotoxic and anti-angiogenic treatments in malignant gliomas. J Neurooncol 2011; 102: pp. 95-103.
10. Jakab A, Molnar P, Emri M, et al. Glioma grade assessment by using histogram analysis of diffusion tensor imaging-derived maps. Neuroradiology. In press.
11. Basser P.J., Pajevic S., Pierpaoli C., et. al.: In vivo fiber tractography using DT-MRI data. Magn Reson Med 2000; 44: pp. 625-632.
12. Ferda J., Kastner J., Mukensnabl P., et. al.: Diffusion tensor magnetic resonance imaging of glial brain tumors. Eur J Radiol 2010; 74: pp. 428-436.
13. Byrnes T.J., Barrick T.R., Bell B.A., et. al.: Diffusion tensor imaging discriminates between glioblastoma and cerebral metastases in vivo. NMR Biomed 2011; 24: pp. 54-60.
14. Saksena S., Jain R.K., Narang J., et. al.: Predicting survival in glioblastoma using diffusion tensor imaging metrics. J Magn Reson Imaging 2010; 32: pp. 788-795.
15. Kleiser R., Staempfil P., Valavanis A., et. al.: Impact of fMRI-guided advanced DTI fiber tracking techniques on their clinical applications in patients with brain tumors. Neuroradiology 2010; 52: pp. 37-46.
16. Wu J.S., Zhou L.F., Tang W.J., et. al.: Clinical evaluation and follow-up outcome of diffusion tensor imaging-based functional neuronavigation: a prospective, controlled study in patients with gliomas involving pyramidal tracts. Neurosurgery 2007; 61: pp. 935-948.
17. Basser P.J., Mattiello J., LeBihan D.: MR diffusion tensor spectroscopy and imaging. Biophys J 1994; 66: pp. 259-267.
18. Basser P.J., Pajevic S.: Spectral decomposition of a 4th-order covariance tensor: applications to diffusion tensor MRI. Signal Process 2007; 87: pp. 220-236.
19. Tuch D.S., Reese T.G., Wiegell M.R., et. al.: Diffusion MRI of complex neural architecture. Neuron 2003; 40: pp. 885-895.
20. Jayachandra M.R., Rehbein N., Herweh C., et. al.: Fiber tracking of human brain using fourth-order tensor and high angular resolution diffusion imaging. Magn Reson Med 2008; 60: pp. 1207-1217.
21. Reese T.G., Heid O., Weisskoff R.M., et. al.: Reduction of eddy-current-induced distortion in diffusion MRI using a twice-refocused spin echo. Magn Reson Med 2003; 49: pp. 177-182.
22. Basser P.J.: New histological and physiological stains derived from diffusion-tensor MR images. Ann N Y Acad Sci 1997; 820: pp. 123-138.
23. Barmpoutis A., Hwang M.S., Howland D., et. al.: Regularized positive-definite fourth order tensor field estimation from DW-MRI. Neuroimage 2009; 45: pp. S153-S162.
24. Barmpoutis A., Jian B., Vemuri B.C., et. al.: Symmetric positive 4th order tensors & their estimation from diffusion weighted MRI. Inf Process Med Imaging 2007; 20: pp. 308-319.
25. Ozarslan E., Vemuri B.C., Mareci T.H.: Generalized scalar measures for diffusion MRI using trace, variance, and entropy. Magn Reson Med 2005; 53: pp. 866-876.
26. Goebell E., Paustenbach S., Vaeterlein O., et. al.: Low-grade and anaplastic gliomas: differences in architecture evaluated with diffusion-tensor MR imaging. Radiology 2006; 239: pp. 217-222.
27. Provenzale J.M., McGraw P., Mhatre P., et. al.: Peritumoral brain regions in gliomas and meningiomas: investigation with isotropic diffusion-weighted MR imaging and diffusion-tensor MR imaging. Radiology 2004; 232: pp. 451-460.
28. Price S.J., Burnet N.G., Donovan T., et. al.: Diffusion tensor imaging of brain tumours at 3T: a potential tool for assessing white matter tract invasion?. Clin Radiol 2003; 58: pp. 455-462.
29. Stecco A., Pisani C., Quarta R., et. al.: DTI and PWI analysis of peri-enhancing tumoral brain tissue in patients treated for glioblastoma. J Neurooncol 2010; 102: pp. 261-271.