
Rationale and Objectives
The aim of this work was to compare a high-resolution diffusion-weighted imaging (HR-DWI) acquisition (voxel size = 4.8 mm 3 ) to a standard diffusion-weighted imaging (STD-DWI) acquisition (voxel size = 29.3 mm 3 ) for monitoring neoadjuvant therapy-induced changes in breast tumors.
Materials and Methods
Nine women with locally advanced breast cancer were imaged with both HR-DWI and STD-DWI before and after 3 weeks (early treatment) of neoadjuvant taxane-based treatment. Tumor apparent diffusion coefficient (ADC) metrics (mean and histogram percentiles) from both DWI methods were calculated, and their relationship to tumor volume change after 12 weeks of treatment (posttreatment) measured by dynamic contrast enhanced magnetic resonance imaging was evaluated with a Spearman’s rank correlation.
Results
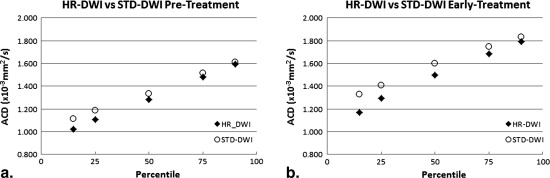
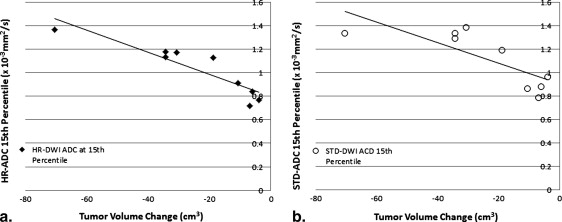
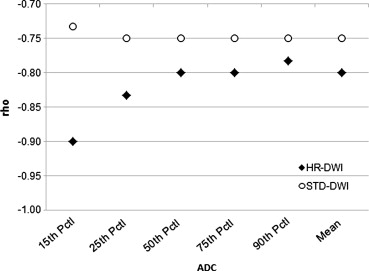
The HR-DWI pretreatment 15th percentile tumor ADC ( P = .03) and early treatment 15th, 25th, and 50th percentile tumor ADCs ( P = .008, .010, .04, respectively) were significantly lower than the corresponding STD-DWI percentile ADCs. The mean tumor HR-ADC was significantly lower than STD-ADC at the early treatment time point ( P = .02), but not at the pretreatment time point ( P = .07). A significant early treatment increase in tumor ADC was found with both methods ( P < .05). Correlations between HR-DWI tumor ADC and posttreatment tumor volume change were higher than the STD-DWI correlations at both time points and the lower percentile ADCs had the strongest correlations.
Conclusion
These initial results suggest that the HR-DWI technique has potential for improving characterization of low tumor ADC values over STD-DWI and that HR-DWI may be of value in evaluating tumor change with treatment.
Magnetic resonance imaging (MRI) techniques are increasingly used to evaluate tumors in patients with locally advanced breast cancer who are undergoing neoadjuvant (preoperative) chemotherapy. Although change in tumor size is recognized as a surrogate predictor of response to chemotherapy , tumor morphologic changes tend to occur later in therapy and typically become apparent after biologic effects . Thus, there is an increasing clinical need to identify early markers for monitoring therapeutic response and improving treatment strategy.
Diffusion-weighted imaging (DWI) has shown promise as a potential imaging biomarker of early treatment response. DWI sequences use diffusion sensitizing gradients to detect differences in water mobility that reflect tissue microenvironment and microstructure. Unlike dynamic contrast-enhanced (DCE) MRI, DWI has the advantage of not requiring the use of a contrast agent.
Get Radiology Tree app to read full this article<
Get Radiology Tree app to read full this article<
Get Radiology Tree app to read full this article<
Get Radiology Tree app to read full this article<
Materials and methods
Patient Population
Get Radiology Tree app to read full this article<
MRI Data Acquisition
Get Radiology Tree app to read full this article<
Standard DCE-MRI
Get Radiology Tree app to read full this article<
Diffusion-weighted MRI
Get Radiology Tree app to read full this article<
Get Radiology Tree app to read full this article<
MRI Data Analysis
Get Radiology Tree app to read full this article<
ADC=−ln(SD/S0)/Δb(mm2/s) A
D
C
=
−
ln
(
S
D
/
S
0
)
/
Δ
b
(
mm
2
/
s
)
where S 0 and S D are the b = 0 (s/mm 2 ) and b = 600 (s/mm 2 ) signals, respectively, and Δb = 600 (s/mm 2 ). ADC maps for HR-DWI data were constructed automatically from complex averaged images using previously published methods .
Get Radiology Tree app to read full this article<
DWI ROI Delineation
Get Radiology Tree app to read full this article<
Get Radiology Tree app to read full this article<
DWI Quantitative Analysis
Get Radiology Tree app to read full this article<
Tumor Volume
Get Radiology Tree app to read full this article<
Statistical Analysis
Get Radiology Tree app to read full this article<
Results
Get Radiology Tree app to read full this article<
Pretreatment
Get Radiology Tree app to read full this article<
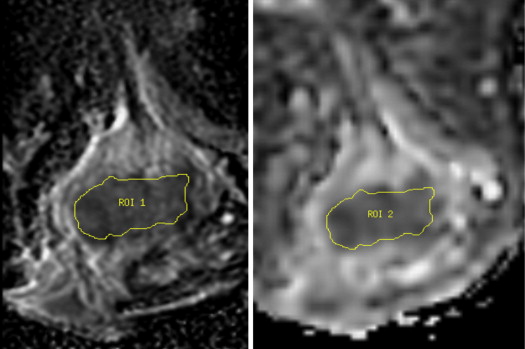
Table 1a
Pretreatment Tumor ADC Metrics Measured with Both HR-DWI and STD-DWI
Tumor ADC Variable (×10 −3 mm 2 /second) Mean HR-DWI (SD) Pretreatment Mean STD-DWI (SD) Median Difference (95% CI) Wilcoxon P Value Mean ADC 1.31 (0.30) 1.37 (0.30) 0.062 (−0.021, 0.152) .07 15th percentile 1.02 (0.22) 1.11 (0.24) 0.095 (0.006, 0.184) .03 25th percentile 1.11 (0.25) 1.18 (0.25) 0.082 (−0.005, 0.159) .07 50th percentile 1.28 (0.32) 1.34 (0.31) 0.047 (−0.033, 0.140) .20 75th percentile 1.48 (0.39) 1.52 (0.35) 0.037 (−0.058, 0.133) .36 90th percentile 1.59 (0.42) 1.61 (0.38) 0.022 (−0.068, 0.115) .50
Get Radiology Tree app to read full this article<
Early Treatment
Get Radiology Tree app to read full this article<
Table 1b
Early Treatment Tumor ADC Metrics for the Same Group of Tumors Measured with Both HR-DWI and STD-DWI
Tumor ADC Variable (×10 −3 mm 2 /second) Mean HR-DWI (SD) Early Treatment Mean STD-DWI (SD) Median Difference (95% CI) Wilcoxon P Value Mean ADC 1.50 (0.37) 1.57 (0.40) 0.117 (0.008, 0.224) .02 15th percentile 1.17 (0.31) 1.33 (0.38) 0.170 (0.077, 0.247) .01 25th percentile 1.29 (0.33) 1.41 (0.39) 0.117 (0.036, 0.192) .01 50th percentile 1.50 (0.39) 1.60 (0.40) 0.117 (0.001, 0.231) .04 75th percentile 1.69 (0.43) 1.75 (0.43) 0.053 (−0.059, 0.183) .50 90th percentile 1.79 (0.44) 1.83 (0.44) 0.050 (−0.099, 0.193) .55
ADC, apparent diffusion coefficient; HR-DWI, high-resolution diffusion-weighted imaging; SD, standard deviation; STD-DWI, standard diffusion-weighted imaging.
Mean tumor ADC as well as the mean ADC values for the 15th, 25th, 50th, 75th, and 90th percentiles for HR and STD-DWI were compared using a Wilcoxon signed-rank test.
Get Radiology Tree app to read full this article<
Difference between Pretreatment and Early Treatment
Within the same DWI technique
Get Radiology Tree app to read full this article<
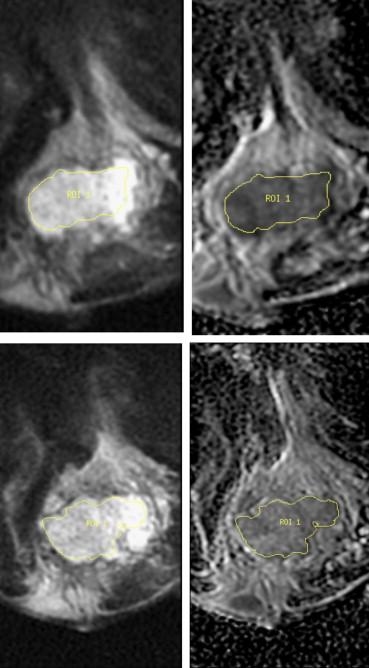
Table 2
Comparison of HR-DWI and STD-DWI Tumor ADC Change: Pretreatment to Early Treatment
Tumor ADC Variable (× 10 −3 mm 2 /second) HR-DWI Median (95% CI), P Value STD-DWI Median (95% CI), P Value STD/HR Difference Median (95% CI), P Value Mean ADC 0.16 (0.021, 0.36) 0.02 0.23 (0.059, 0.40) 0.02 0.045 (−0.045, 0.13) 0.4 15th percentile 0.13 (0.020, 0.29) 0.02 0.23 (0.058, 0.37) 0.03 0.087 (−0.044, 0.16) 0.2 25th percentile 0.17 (0.032, 0.33) 0.01 0.24 (0.078, 0.38) 0.02 0.040 (−0.065, 0.12) 0.3 50th percentile 0.20 (0.029, 0.42) 0.02 0.26 (0.084, 0.48) 0.02 0.045 (−0.047, 0.16) 0.3 75th percentile 0.14 (0.014, 0.40) 0.02 0.21 (0.025, 0.45) 0.02 0.022 (−0.062, 0.13) 0.6 90th percentile 0.11 (0.004, 0.40) 0.04 0.22 (0.025, 0.45) 0.03 0.041 (−0.058, 0.26) 0.5
ADC, apparent diffusion coefficient; HR-DWI, high-resolution diffusion-weighted imaging; STD-DWI, standard diffusion-weighted imaging.
Changes in tumor ADC metrics from pre- to early treatment measured with HR-DWI (column 2) and STD-DWI (column 3), and the difference between HR-DWI and STD-DWI (last column). Changes in mean ADC as well as changes in the 15th, 25th, 50th, 70th, and 90th percentiles for HR-DWI and STD-DWI were compared using a Wilcoxon signed-rank test.
Get Radiology Tree app to read full this article<
Between the two DWI techniques
Get Radiology Tree app to read full this article<
Get Radiology Tree app to read full this article<
Tumor Volume Change with Treatment
Get Radiology Tree app to read full this article<
Correlation between Tumor ADC and Tumor Volume Change
Get Radiology Tree app to read full this article<
Get Radiology Tree app to read full this article<
Get Radiology Tree app to read full this article<
Get Radiology Tree app to read full this article<
Table 3a
Pretreatment HR-DWI and STD-DWI Tumor ADC Metrics for the Group with >65% Tumor Volume Reduction and the Group with <65% Tumor Volume Reduction at the end of Treatment
Tumor ADC Variable (×10 −3 mm 2 /s) Pretreatment HR-DWI >65% volume change Mean HR-DWI <65% volume change mean STD-DWI Mean > 65% volume change STD-DWI mean < 65% volume change Mean ADC 1.30 1.34 1.38 1.32 15th percentile 1.02 1.02 1.14 1.03 25th percentile 1.11 1.11 1.21 1.11 50th percentile 1.28 1.40 1.35 1.27 75th percentile 1.46 1.55 1.52 1.49 90th percentile 1.56 1.70 1.60 1.63
Table 3b
Early Treatment HR-DWI and STD-DWI Tumor ADC Metrics for the Group with >65% Tumor Volume Reduction and the Group with <65% Tumor Volume Reduction at the End of Treatment
Tumor ADC Variable (× 10 −3 mm 2 /s) Early-Treatment HR-DWI >65% volume change Mean HR-DWI <65% volume change mean STD-DWI Mean > 65% volume change STD-DWI mean < 65% volume change Mean ADC 1.50 1.46 1.64 1.44 15th percentile 1.19 1.11 1.37 1.19 25th percentile 1.31 1.23 1.45 1.27 50th percentile 1.51 1.45 1.65 1.43 75th percentile 1.69 1.69 1.79 1.60 90th percentile 1.79 1.81 1.87 1.69
ADC, apparent diffusion coefficient; HR-DWI, high-resolution diffusion-weighted imaging; STD-DWI, standard diffusion-weighted imaging.
Get Radiology Tree app to read full this article<
Discussion
Get Radiology Tree app to read full this article<
Get Radiology Tree app to read full this article<
Get Radiology Tree app to read full this article<
Get Radiology Tree app to read full this article<
Get Radiology Tree app to read full this article<
Get Radiology Tree app to read full this article<
Conclusion
Get Radiology Tree app to read full this article<
Acknowledgment
Get Radiology Tree app to read full this article<
References
1. Bonadonna G., Valagussa P., Brambilla C., et. al.: Primary chemotherapy in operable breast cancer: eight-year experience at the Milan Cancer Institute. J Clin Oncol 1998; 16: pp. 93-100.
2. Partridge S.C., Gibbs J.E., Lu Y., et. al.: MRI measurements of breast tumor volume predict response to neoadjuvant chemotherapy and recurrence-free survival. AJR Am J Roentgenol 2005; 1184: pp. 1774-1781.
3. Ah-See M.L., Makris A., Taylor N.J., et. al.: Early changes in functional dynamic magnetic resonance imaging predict for pathologic response to neoadjuvant chemotherapy in primary breast cancer. Clin Cancer Res 2008; 14: pp. 6580-6589.
4. Pickles M.D., Gibbs P., Lowry M., et. al.: Diffusion changes precede size reduction in neoadjuvant treatment of breast cancer. Magn Reson Imaging 2006; 24: pp. 843-847.
5. Sinha S., Lucas-Quesada F.A., Sinha U., et. al.: In vivo diffusion-weighted MRI of the breast: potential for lesion characterization. J Magn Reson Imaging 2002; 15: pp. 693-704.
6. Sharma U., Danishad K.K., Seenu V., et. al.: Longitudinal study of the assessment by MRI and diffusion-weighted imaging of tumor response in patients with locally advanced breast cancer undergoing neoadjuvant chemotherapy. NMR Biomed 2009; 22: pp. 104-113.
7. Park M.J., Cha E.S., Kang B.J., et. al.: The role of diffusion-weighted imaging and the apparent diffusion coefficient (ADC) values for breast tumors. Korean J Radiol 2007; 8: pp. 390-396.
8. Partridge S.C., DeMartini W.B., Kurland B.F., et. al.: Quantitative diffusion-weighted imaging as an adjunct to conventional breast MRI for improved positive predictive value. AJR Am J Roentgenol 2009; 193: pp. 1716-1722.
9. Park S.H., Moon W.K., Cho N., et. al.: Diffusion-weighted MR imaging: pretreatment prediction of response to neoadjuvant chemotherapy in patients with breast cancer. Radiology 2010; 257: pp. 56-63.
10. Iacconi C., Giannelli M., Marini C., et. al.: The role of mean diffusivity (MD) as a predictive index of the response to chemotherapy in locally advanced breast cancer: a preliminary study. Eur Radiol 2010; 20: pp. 303-308.
11. Fangberget A., Nilsen L.B., Hole K.H., et. al.: Neoadjuvant chemotherapy in breast cancer-response evaluation and prediction of response to treatment using dynamic contrast-enhanced and diffusion-weighted MR imaging. Eur Radiol 2011; 21: pp. 1188-1199.
12. Manton D.J., Chaturvedi A., Hubbard A., et. al.: Neoadjuvant chemotherapy in breast cancer: early response prediction with quantitative MR imaging and spectroscopy. Br J Cancer 2006; 94: pp. 427-435.
13. Nilsen L., Fangberget A., Geier O., et. al.: Diffusion-weighted magnetic resonance imaging for pretreatment prediction and monitoring of treatment response of patients with locally advanced breast cancer undergoing neoadjuvant chemotherapy. Acta Oncol 2010; 49: pp. 354-360.
14. Tozaki M., Oyama Y., Fukuma E.: Preliminary study of early response to neoadjuvant chemotherapy after the first cycle in breast cancer: comparison of 1H magnetic resonance spectroscopy with diffusion magnetic resonance imaging. Jpn J Radiol 2010; 28: pp. 101-109.
15. Partridge S.C., Singer L., Sun R., et. al.: Diffusion-weighted MRI: influence of intravoxel fat signal and breast density on breast tumor conspicuity and apparent diffusion coefficient measurements. Magn Reson Imaging 2011; 29: pp. 1215-1221.
16. Jezzard P., Balaban R.S.: Correction for geometric distortion in echo planar images from B0 field variations. Magn Reson Med 1995; 34: pp. 65-73.
17. Saritas E.U., Cunningham C.H., Lee J.H., et. al.: DWI of the spinal cord with reduced FOV single-shot EPI. Magn Reson Med 2008; 60: pp. 468-473.
18. Wilm B.J., Svensson J., Henning A., et. al.: Reduced field-of-view MRI using outer volume suppression for spinal cord diffusion imaging. Magn Reson Med 2007; 57: pp. 625-630.
19. Wheeler-Kingshott C.A., Hickman S.J., Parker G.J., et. al.: Investigating cervical spinal cord structure using axial diffusion tensor imaging. Neuroimage 2002; 16: pp. 93-102.
20. Singer L., Wilmes L.J., Saritas E.U., et. al.: High-resolution diffusion-weighted magnetic resonance imaging in patients with locally advanced breast cancer. Acad Radiol 2012; 19: pp. 526-534.
21. Partridge S.C., Gibbs J.E., Lu Y., et. al.: Accuracy of MR imaging for revealing residual breast cancer in patients who have undergone neoadjuvant chemotherapy. AJR Am J Roentgenol 2002; 179: pp. 1193-1199.
22. Prasad S.R., Jhaveri K.S., Saini S., et. al.: CT tumor measurement for therapeutic response assessment: comparison of unidimensional, bidimensional, and volumetric techniques initial observations. Radiology 2002; 225: pp. 416-419.
23. Partridge S.C., Rahbar H., Murthy R., et. al.: Improved diagnostic accuracy of breast MRI through combined apparent diffusion coefficients and dynamic contrast-enhanced kinetics. Magn Reson Med 2011; 65: pp. 1759-1767.
24. Jensen L.R., Garzon B., Heldahl M.G., et. al.: Diffusion-weighted and dynamic contrast-enhanced MRI in evaluation of early treatment effects during neoadjuvant chemotherapy in breast cancer patients. J Magn Reson Imaging 2011; 34: pp. 1099-1109.
25. Yankeelov T.E., Lepage M., Chakravarthy A., et. al.: Integration of quantitative DCE-MRI and ADC mapping to monitor treatment response in human breast cancer: initial results. Magn Reson Imaging 2007; 25: pp. 1-13.
26. Iacconi C., Giannelli M.: Can diffusion-weighted MR imaging be used as a biomarker for predicting response to neoadjuvant chemotherapy in patients with locally advanced breast cancer?. Radiology 2011; 259: pp. 303-304.
27. Belli P., Costantini M., Ierardi C., et. al.: Diffusion-weighted imaging in evaluating the response to neoadjuvant breast cancer treatment. Breast J 2011; 17: pp. 610-619.