
Rationale and Objectives
The aim of the study was to analyze 1) whether the metabolite levels in the posterior cingulate cortex (PCC) are different in healthy individuals compared to a group of patients with cognitive impairment and/or pain and 2) whether there exists a correlation between brain metabolites and the age of a patient.
Materials and Methods
Two hundred seven patients with cognitive impairment and/or pain (66 mild cognitive impairment, 54 fibromyalgia, 36 Alzheimer disease, 33 interictal migraine, 10 somatization disorder, and 8 after trigeminal neuralgia, and 193 healthy participants adjusted for gender and age. Proton magnetic resonance spectroscopy (MRS) of the brain was performed with the voxel placed in the ventral PCC and postprocessed with LCModel (Stephen Provencher, Oakville, Ontario, Canada).
Results
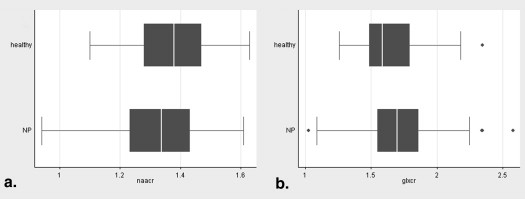
Using linear regression and adjusting for gender and age, mean brain metabolite values for the pathological group, when compared to healthy controls, were significantly lower in N -acetylaspartate ( P = .003) and N -acetylaspartate/creatine ( P = .015) and significantly greater in glutamate + glutamine ( P < .001) and glutamate + glutamine/creatine ( P < .000). All metabolites were significantly correlated with age: glutamate, glutamate + glutamine, N -acetylaspartate, and their creatine ratios exhibited a negative correlation, whereas myoinositol and choline exhibited a positive correlation.
Conclusions
Although the number of patients is relatively small with heterogeneous state of disease, MRS in PCC may serve as a useful noninvasive tool for diagnostic of patients with cognitive impairment and pain.
The default mode network (DMN) comprises a set of brain regions that are coactivated during passive task states, show an intrinsic functional relationship, and are connected via direct and indirect anatomic projections. The medial temporal lobe subsystem provides information from previous experiences in the form of memories and associations, which are the building blocks of mental simulation. The medial prefrontal subsystem facilitates the flexible use of this information during the construction of self-relevant mental simulations. These two subsystems converge on important nodes of integration, including the ventral posterior cingulate cortex (vPCC) . The default network is disrupted in Alzheimer disease (AD) , during painful stimuli , and in fibromyalgia (FM) , depression , autism , and schizophrenia , thereby further encouraging researchers to consider how the functions of the default network might be important in understanding diseases of the mind.
Proton magnetic resonance spectroscopy ( 1 H-MRS) is one of the techniques used to assess potential disruptions in neuronal integrity and associated neurochemical dysregulations.
Get Radiology Tree app to read full this article<
Get Radiology Tree app to read full this article<
 Open full size image
Figure 1
Sagittal T 2 -weighted magnetic resonance imaging with the voxel placed in the bilateral posteromedial parietal cortex (posterior cingulate gyrus and inferior precuneus) and spectrum with the following peaks: Cho, choline compounds; Cr, creatine; Glx, glutamate + glutamine; mI, myoinositol; NAA, N -acetylaspartate; ppm, parts per million.
Get Radiology Tree app to read full this article<
Patients and methods
Design
Get Radiology Tree app to read full this article<
Patients
Get Radiology Tree app to read full this article<
Get Radiology Tree app to read full this article<
Neuroimaging Techniques
Magnetic Resonance Spectroscopy
Get Radiology Tree app to read full this article<
Get Radiology Tree app to read full this article<
Get Radiology Tree app to read full this article<
Get Radiology Tree app to read full this article<
Statistical Analysis
Get Radiology Tree app to read full this article<
Results
Get Radiology Tree app to read full this article<
Get Radiology Tree app to read full this article<
Table 1
Brain Metabolite Values in Individuals with Neuropsychiatric Disorders ( n = 207) and Healthy Controls ( n = 193)
Metabolite Mean HC Mean NPD_P_ Value Glu 7.48 7.49 .943 Glu/Cr 1.32 1.31 .508 mI 4.67 4.64 .700 mI/Cr 0.82 0.83 .204 NAA8.027.84.003 NAA/Cr1.421.40.015 Cho 1.10 0.90 .137 Cho/Cr 0.19 0.20 .807 Glx9.489.90.001 Glx/Cr1.671.75.000
Cho, choline compounds; Cr, creatine; Glu, glutamate; Glx, glutamate + glutamine; HC, healthy controls; mI, myoinositol; NAA, N -acetylaspartate; NPD, neuropsychiatric disorders.
Mean values were obtained after adjusting for gender and age.
Bold values indicate significant differences.
Get Radiology Tree app to read full this article<
Get Radiology Tree app to read full this article<
Table 2
Brain Metabolites Levels in Different Neuropsychiatric Disorders and Healthy Controls
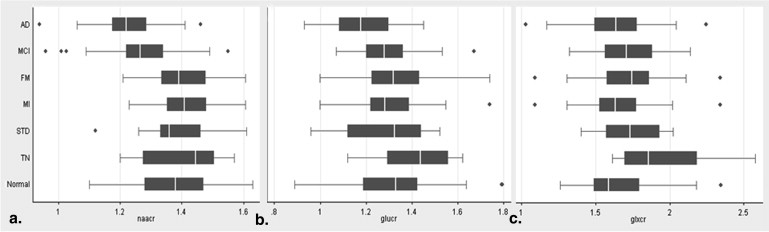
AD ( n = 36) MCI ( n = 66) FM ( n = 54) MI ( n = 33) STD ( n = 10) TN ( n = 8) Normal ( n = 193)P Valor ∗ Bonferroni Correction Glu 6.57 (0.84) 7.33 (0.81) 7.74 (0.89) 7.21 (0.96) 7.19 (0.93) 8.01 (0.47) 7.27 (0.94) <.001 AD < TN = FM = NORMAL = MCI Glu/Cr 1.17 (0.14) 1.28 (0.12) 1.32 (0.15) 1.28 (0.16) 1.28 (0.19) 1.41 (0.17) 1.30 (0.17) <.001 AD < MCI = FM = TN = NORMAL Glx 9.07 (1.24) 9.84 (1.16) 9.65 (1.19) 9.25 (1.21) 9.67 (1.10) 10.99 (1.38) 9.23 (1.19) <.001 TN > AD = MI = NORMAL Glx/Cr 1.64 (0.26) 1.72 (0.21) 1.72 (0.22) 1.65 (0.23) 1.72 (0.22) 1.95 (0.35) 1.63 (0.21) <.001 TN > AD = MI = NORMAL mI 5.05 (0.84) 5.05 (0.66) 4.58 (0.45) 4.70 (0.41) 4.61 (0.49) 4.44 (0.67) 4.80 (0.58) <.001 FM < AD = MCI mI/Cr 0.91 (0.13) 0.89 (0.13) 0.82 (0.09) 0.84 (0.08) 0.82 (0.07) 0.78 (0.08) 0.84 (0.09) <.001 FM = NORMAL < AD = MCI NAA 6.86 (0.87) 7.29 (0.67) 7.85 (0.39) 7.92 (0.39) 7.75 (0.75) 7.89 (0.43) 7.76 (0.62) <.001 AD < FMI = MI = TN = NORMAL < MCI = STD NAA/Cr 1.23 (0.10) 1.27 (0.11) 1.40 (0.10) 1.41 (0.10) 1.38 (0.14) 1.40 (0.14) 1.37 (0.12) <.001 AD < FM = MI = STD = TN = NORMAL; MCI < FM = MI = NORMAL Cho 1.16 (0.20) 1.11 (0.14) 1.06 (0.09) 1.06 (0.09) 1.01 (0.07) 1.09 (0.13) 1.11 (0.13) .006 AD > FM Cho/Cr 0.21 (0.33) 0.19 (0.02) 0.19 (0.01) 0.19 (0.01) 1.66 (4.68) 0.19 (0.03) 0.19 (0.02) .005 AD > FM = MI = NORMAL = STD
AD, Alzheimer disease; Cho, choline compounds; Cr, creatine; FM, fibromyalgia; Glu, glutamate; Glx, glutamate + glutamine; HC, healthy controls; MCI, mild cognitive impairment; MI, migraine; mI, myoinositol; NAA, N -acetylaspartate; STD, somatoform disorders; TN, idiopathic trigeminal neuralgia.
Get Radiology Tree app to read full this article<
Get Radiology Tree app to read full this article<
Get Radiology Tree app to read full this article<
Get Radiology Tree app to read full this article<
Get Radiology Tree app to read full this article<
Table 3
Brain Metabolite Values for the Whole Sample ( N = 400) after Controlling for Gender, Age, and Neuropsychiatric Disorder
Metabolite Coefficient_P_ Value Glu −0.3019 <.001 Glu/Cr −0.3185 <.001 mI 0.4267 <.001 mI/Cr 0.2662 <.001 NAA −0.4935 <.001 NAA/Cr −0.5841 <.001 Cho 0.3696 <.001 Cho/Cr 0.1892 <.001 Glx −0.283 <.001 Glx/Cr −0.3442 <.001
Cho, choline compounds; Cr, creatine; Glu, glutamate; Glx, glutamate + glutamine; HC, healthy controls; mI, myoinositol; NAA, N -acetylaspartate.
Get Radiology Tree app to read full this article<
Get Radiology Tree app to read full this article<
Table 4
Correlation of Brain Metabolite Values and Age in Healthy Controls and Individuals with Neuropsychiatric Disorders, after Controlling for Gender and Neuropsychiatric Disorder
Healthy Controls Neuropsychiatric Disorders Coefficient_P_ Value Coefficient_P_ Value Glu−0.36<.001−0.14.044 Glu/Cr−0.34<.001−0.2.004 mI0.56<.0010.17.018 mI/Cr0.31<.0010.14.047 NAA−0.58<.001−0.28<.001 NAA/Cr−0.65<.001−0.37<.001 Cho0.42<.0010.23.001 Cho/Cr 0.11 .1050.21.003 Glx−0.43<.001 0.01 .866 Glx/Cr−0.54<.001 −0.01 .817
Cho, choline compounds; Cr, creatine; Glu, glutamate; Glx, glutamate + glutamine; HC, healthy controls; mI, myoinositol; NAA, N -acetylaspartate. Italics indicates significant values.
Get Radiology Tree app to read full this article<
Discussion
Get Radiology Tree app to read full this article<
Early Markers of Brain Dysfunction
Get Radiology Tree app to read full this article<
Get Radiology Tree app to read full this article<
Get Radiology Tree app to read full this article<
Get Radiology Tree app to read full this article<
Get Radiology Tree app to read full this article<
Get Radiology Tree app to read full this article<
Clinical Significance of the Different Metabolites
Get Radiology Tree app to read full this article<
Get Radiology Tree app to read full this article<
Get Radiology Tree app to read full this article<
Get Radiology Tree app to read full this article<
Get Radiology Tree app to read full this article<
Get Radiology Tree app to read full this article<
Get Radiology Tree app to read full this article<
Get Radiology Tree app to read full this article<
Evolution of Brain Metabolites Over the Lifetime
Get Radiology Tree app to read full this article<
Get Radiology Tree app to read full this article<
Get Radiology Tree app to read full this article<
Get Radiology Tree app to read full this article<
References
1. Buckner R.L., Andrews-Hanna J.R., Schacter D.L.: The brain’s default network: anatomy, function, and relevance to disease. Ann N Y Acad Sci 2008; 1124: pp. 1-38.
2. Lustig C., Snyder A.Z., Bhakta M., et. al.: Functional deactivations: change with age and dementia of the Alzheimer type. Proc Natl Acad Sci U S A 2003; 100: pp. 14504-14509.
3. Greicius M.D., Srivastava G., Reiss A.L., et. al.: Default-mode network activity distinguishes Alzheimer’s disease from healthy aging: evidence from functional MRI. Proc Natl Acad Sci U S A 2004; 101: pp. 4637-4642.
4. Lui F., Duzzi D., Corradini M., et. al.: Touch or pain? Spatiotemporal patterns of cortical fMRI activity following brief mechanical stimuli. Pain 2008; 138: pp. 362-374.
5. Raichle M.E., MacLeod A.M., Snyder A.Z., et. al.: A default mode of brain function. Proc Natl Acad Sci U S A 2001; 98: pp. 676-682.
6. Jorge L.L., Amaro E.: Brain imaging in fibromyalgia. Curr Pain Headache Rep 2012; 16: pp. 388-398.
7. Sheline Y.I., Barch D.M., Price J.L., et. al.: The default mode network and self-referential processes in depression. Proc Natl Acad Sci U S A 2009; 106: pp. 1942-1947.
8. Kennedy D.P., Redcay E., Courchesne E.: Failing to deactivate: resting functional abnormalities in autism. Proc Natl Acad Sci U S A 2006; 103: pp. 8275-8280.
9. Bluhm R.L., Miller J., Lanius R.A., et. al.: Spontaneous low-frequency fluctuations in the BOLD signal in schizophrenic patients: anomalies in the default network. Schizophr Bull 2007; 33: pp. 1004-1012.
10. Antuono P.G., Jones J.L., Wang Y., et. al.: Decreased glutamate + glutamine in Alzheimer’s disease detected in vivo with (1) H-MRS at 0.5 T. Neurology 2002; 56: pp. 737-742.
11. Fayed N., Modrego P.J., Rojas-Salinas G., et. al.: Glutamate is decreased in Alzheimer’s disease. A magnetic resonance spectroscopy study. Am J Alzheimers Dis Other Demen 2011; 26: pp. 450-456.
12. Hattori N., Abe K., Sakoda S., et. al.: Proton MR spectroscopic study at 3 Tesla on glutamate/glutamine in Alzheimer’s disease. Neuroreport 2002; 13: pp. 183-186.
13. Rupsingh R., Borrie M., Smith M., et. al.: Reduced hippocampal glutamate in Alzheimer disease. Neurobiol Aging 2009; 32: pp. 802-810.
14. Harris R.E., Sundgren P.C., Craig A.D., et. al.: Elevated insular glutamate (Glu) in fibromyalgia (FM) is associated with experimental pain. Arthritis Rheum 2009; 60: pp. 3146-3152.
15. Fayed N., Garcia-Campayo J., Magallón R., et. al.: Localized 1H-NMR spectroscopy in patients with fibromyalgia: a controlled study of changes in cerebral glutamate/glutamine, inositol, choline, and N-acetylaspartate. Arthritis Res Ther 2010; 12: pp. R134.
16. Fayed N., Andres E., Rojas G., et. al.: Brain dysfunction in fibromyalgia and somatization disorder using proton magnetic resonance spectroscopy: a controlled study. Acta Psychiatr Scand 2012; 126: pp. 115-125.
17. Harris R.E.: Elevated excitatory neurotransmitter levels in the fibromyalgia brain. Arthritis Res Ther 2010; 12: pp. 141.
18. Provencher S.W.: Estimation of metabolite concentrations from localised in vivo proton NMR spectra. Magn Reson Med 1993; 30: pp. 672-679.
19. Vogt B.A.: Regions and subregions of the cingulate cortex.Vogt B.A.Cingulate neurobiology and disease.2009.Oxford University PressNew York, NY:pp. 3-30.
20. Fayed N., Modrego P.J., Medrano J.: Comparative test-retest reliability of metabolite values assessed with magnetic resonance spectroscopy of the brain. The LCModel versus the manufacturer software. Neurol Res 2009; 31: pp. 472-477.
21. Williamson L.C., Neale J.H.: Calcium-dependent release of N-acetyl aspartyl glutamate from retinal neurons upon depolarization. Brain Res 1988; 475: pp. 151-155.
22. Cassidy M., Neale J.H.: N-acetylaspartylglutamate catabolism is achieved by an enzyme on the cell surface of neurons and glia. Neuropeptides 1993; 24: pp. 271-278.
23. Ross B.D., Blüml S.: Magnetic resonance spectroscopy of the human brain. Anat Rec 2001; 265: pp. 54-84.
24. Petroff O.A.C., Mattson R.H., Rothman D.L.: Proton MRS: GABA and glutamate. Adv Neurol 2000; 83: pp. 261-271.
25. Bejjani A., O’Neill J., Kim J., et. al.: Elevated glutamatergic compounds in pregenual anterior cingulate in pediatric autism spectrum disorder demonstrated by 1H MRS and 1H MRSI. PLoS One 2012; 7: pp. e38786.
26. Escartin C., Valette J., Lebon V., et. al.: Neuron–astrocyte interactions in the regulation of brain energy metabolism: a focus on NMR spectroscopy. J Neurochem 2006; 99: pp. 393-401.
27. Cooper J.R., Bloom F.E., Roth R.H.: The biochemical basis of neuropharmacology.8th ed2000.Oxford University PressOxford, UK
28. Gracely R.H., Petzke F., Wolf J.M., et. al.: Functional magnetic resonance imaging evidence of augmented pain processing in fibromyalgia. Arthritis Rheum 2000; 46: pp. 1333-1343.
29. Buckley P.F., Moore C., Long H., et. al.: 1H-magnetic resonance spectroscopy of the left temporal and frontal lobes in schizophrenia: clinical, neurodevelopmental, and cognitive correlates. Biol Psychiatry 1994; 36: pp. 792-800.
30. Modrego P.J., Fayed N., Pina M.A.: Conversion from mild cognitive impairment to probable Alzheimer’s disease predicted by brain magnetic resonance spectroscopy. Am J Psychiatry 2005; 162: pp. 667-675.
31. Zahr N.M., Mayer D., Pfefferbaum A., et. al.: Low striatal glutamate levels underlie cognitive decline in the elderly: evidence from in vivo molecular spectroscopy. Cereb Cortex 2008; 18: pp. 2241-2250.
32. Javitt D.C., Schoepp D., Kalivas P.W., et. al.: Translating glutamate: from pathophysiology to treatment. Sci Transl Med 2011; 3: pp. 102mr2.
33. Fayed N., Dávila J., Oliveros A., et. al.: Utility of different MR modalities in mild cognitive impairment and its use as a predictor of conversion to probable dementia. Acad Radiol 2008; 15: pp. 1089-1098.
34. Baslow M.H.: The vertebrate brain, evidence of its modular organization and operating system: insights in to the brain’s basic units of structure, function, and operation and how they influence neuronal signaling and behavior. Front Behav Neurosci 2011; 5: pp. 5.
35. Alexander G.E., Chen K., Pietrini P., et. al.: Longitudinal PET evaluation of cerebral metabolic decline in dementia: a potential outcome measure in Alzheimer’s disease treatment studies. Am J Psychiatry 2002; 159: pp. 738e45.
36. Matsuda H.: Cerebral blood flow and metabolic abnormalities in Alzheimers disease. Ann Nucl Med 2001; 15: pp. 85-92.
37. Londono A.C., Castellanos F.X., Arbelaez A., et. al.: An 1H-MRS framework predicts the onset of Alzheimer’s disease symptoms in PSEN1 mutation carriers. Alzheimers Dement 2013; Nov 13
38. Targosz-Gajniak M.G., Siuda J.S., Wicher M.M., et. al.: Magnetic resonance spectroscopy as a predictor of conversion of mild cognitive impairment to dementia. J Neurol Sci 2013; 335: pp. 58-63.
39. Tumati S., Martens S., Aleman A.: Magnetic resonance spectroscopy in mild cognitive impairment: systematic review and meta-analysis. Neurosci Biobehav Rev 2013; 37: pp. 2571-2586.
40. Kantarci K.: Magnetic resonance spectroscopy in common dementias. Neuroimaging Clin N Am 2013; 23: pp. 393-406.
41. Salek R.M., Xia J., Innes A., et. al.: A metabolic study of the CRND8 transgenic mouse model of Alzheimer’s disease. Neurochem Int 2010; 56: pp. 937-947.
42. Parnetti L., Lowenthal D.T., Presciutti O., et. al.: 1 H-MRS, MRI-based hippocampal volumetry, and 99mTc-HMPAO-SPECT in normal aging, age-associated memory impairment, and probable Alzheimer’s disease. J Am Geriatr Soc 1996; 44: pp. 133-138.
43. Kantarci K., Xu Y.C., Shiung M.M., et. al.: Comparative diagnostic utility of different MR modalities in mild cognitive impairment and Alzheimer’s disease. Dement Geriatr Cogn Disord 2002; 14: pp. 198-207.
44. Aoki Y., Inokuchi R., Suwa H.: Reduced N-acetylaspartate in the hippocampus in patients with fibromyalgia: a meta-analysis. Psychiatry Res 2013; 213: pp. 242-248.
45. Fairhurst M., Wiech K., Dunckley P., et. al.: Anticipatory brainstem activity predicts neural processing of pain in humans. Pain 2007; 128: pp. 101-110.
46. Ziv M., Tomer R., Defrin R., et. al.: Individual sensitivity to pain expectancy is related to differential activation of the hippocampus and amygdala. Hum Brain Mapp 2010; 31: pp. 326-338.
47. González de la Aleja J., Ramos A., Mato-Abad V., et. al.: Higher glutamate to glutamine ratios in occipital regions in women with migraine during the interictal state. Headache 2013; 53: pp. 365-375.
48. Siniatchkin M., Sendacki M., Moeller F., et. al.: Abnormal changes of synaptic excitability in migraine with aura. Cereb Cortex 2012; 22: pp. 2207-2216.
49. Reyngoudt H., Achten E., Paemeleire K.: Magnetic resonance spectroscopy in migraine: what have we learned so far?. Cephalalgia 2012; 32: pp. 845-859.
50. Cacace AT, Silver SM. Applications of magnetic resonance spectroscopy to tinnitus research: initial data, current issues, and future perspectives. B. Langguth, G. Hajak, T. Kleinjung, et al (Eds.) Progress in Brain Research 2007; Vol. 166; CHAPTER 7; ISSN 0079-6123 Copyright Elsevier B.V.
51. Gutzeit A., Meier D., Froehlich J.M., et. al.: Differential NMR spectroscopy reactions of anterior/posterior and right/left insular subdivisions due to acute dental pain. Eur Radiol 2013; 23: pp. 450-460.
52. Miller A.K., Corsellis J.A.: Evidence for a secular increase in human brain weight during the past century. Ann Hum Biol 1977; 4: pp. 253-257.
53. Kaiser L.G., Schuff N., Cashdollar N., et. al.: Age-related glutamate and glutamine concentration changes in normal human brain: 1H MR spectroscopy study at 4 T. Neurobiol Aging 2005; 26: pp. 665-672.
54. Resnick S.M., Pham D.L., Kraut M.A., et. al.: Longitudinal magnetic resonance imaging studies of older adults: a shrinking brain. J Neurosci 2003; 23: pp. 3295-3301.
55. Angelie E., Bonmartin A., Boudraa A., et. al.: Regional differences and metabolic changes in normal aging of the human brain: proton MR spectroscopic imaging study. AJNR Am J Neuroradiol 2001; 22: pp. 119-127.
56. Chang L., Ernst T., Poland R.E., et. al.: In vivo proton magnetic resonance spectroscopy of the normal aging human brain. Life Sci 1996; 58: pp. 2049-2056.