
Rationale and Objectives
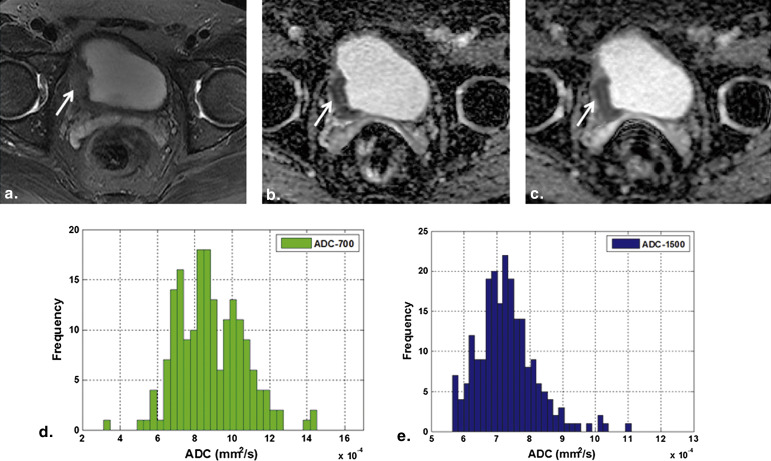
To investigate the potential value of histogram analysis of apparent diffusion coefficient (ADC) obtained at standard (700 s/mm 2 ) and high (1500 s/mm 2 ) b values on a 3.0-T scanner in the differentiation of bladder cancer from benign lesions and in assessing bladder tumors of different pathologic T stages and to evaluate the diagnostic performance of ADC-based histogram parameters.
Materials and Methods
In all, 52 patients with bladder lesions, including benign lesions ( n = 7) and malignant tumors ( n = 45; T1 stage or less, 23; T2 stage, 7; T3 stage, 8; and T4 stage, 7), were retrospectively evaluated. Magnetic resonance examination at 3.0 T and diffusion-weighted imaging were performed. ADC maps were obtained at two b values ( b = 700 and 1500 s/mm 2 ; ie, ADC-700 and ADC-1500). Parameters of histogram analysis included mean, kurtosis, skewness, and entropy. The correlations between these parameters and pathologic results were revealed. Receiver operating characteristic (ROC) curves were generated to determine the diagnostic value of histogram parameters.
Results
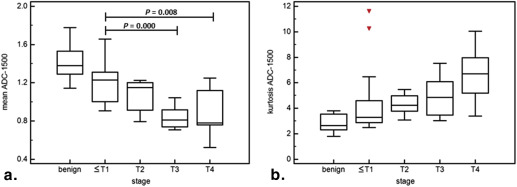
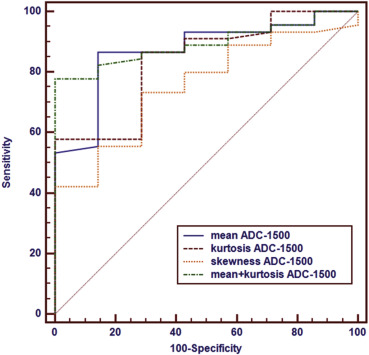
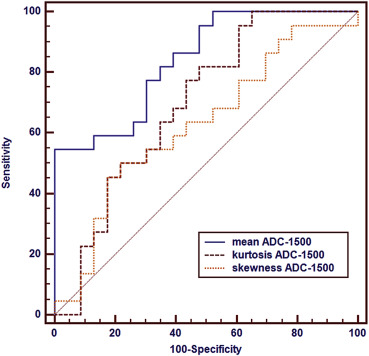
Significant differences were found in mean ADC-700, mean ADC-1500, skewness ADC-1500, and kurtosis ADC-1500 between bladder cancer and benign lesions ( P = .002–.032). There were also significant differences in mean ADC-700, mean ADC-1500, and kurtosis ADC-1500 among bladder tumors of different pathologic T stages ( P = .000–.046). No significant differences were observed in other parameters. Mean ADC-1500 and kurtosis ADC-1500 were significantly correlated with T stage, respectively (ρ = −0.614, P < .001; ρ = 0.374, P = .011). ROC analysis showed that the combination of mean ADC-1500 and kurtosis ADC-1500 has the maximal area under the ROC curve (AUC, 0.894; P < .001) in the differentiation of benign lesions and malignant tumors, with a sensitivity of 77.78% and specificity of 100%. AUCs for differentiating low- and high-stage tumors were 0.840 for mean ADC-1500 ( P < .001) and 0.696 for kurtosis ADC-1500 ( P = .015).
Conclusions
Histogram analysis of ADC-1500 at 3.0 T can be useful in evaluation of bladder lesions. A combination of mean ADC-1500 and kurtosis ADC-1500 may be more beneficial in the differentiation of benign and malignant lesions. Mean ADC-1500 was the most promising parameter for differentiating low- from high-stage bladder cancer.
Bladder cancer is the most common type of malignant tumor in urinary tract, which is hazardous heavily to human health among both men and women . Preoperative assessment of the bladder cancer pathologic T stage, which is a measure of clinical aggressiveness, is the most primary factor in choosing the most appropriate treatment method. As a result, disease prognosis can be different among patients depending on different tumor stages. Low-stage superficial tumors (T1 stage or lower) are associated with low risk of progression and can be effectively treated by local endoscopic resection with a favorable survival rate. On the other hand, high-stage invasive tumors (T2 stage or higher) often develop metastatic disease and are treated either by curative cystectomy or by radiation therapy or chemotherapy .
Diffusion-weighted imaging (DWI) as a functional magnetic resonance imaging (MRI) technique has shown its ability to diagnose bladder cancer and distinguish tumors of different stages . DWI is based on the microscopic diffusion movements in the protons of the tissues’ water molecules and can reveal information about microstructure complexity, such as, cellularity, integrity of the cellular membranes, and aggregation of macromolecules . Apparent diffusion coefficient (ADC), which is a quantitative parameter derived from DWI, can reflect water mobility within various tissues according to the pathophysiologic state. In recent years, DWI has been used as part of a routine MRI protocol for bladder examination. Although DWI has proven to be a useful imaging tool to distinguish among benign and malignant lesions and evaluate tumor stage , especially to reduce overstaging rate compared to gadolinium-enhanced imaging , the accuracy in differentiating superficial from invasive tumors is relatively low . In addition, ADC values showed a substantial overlap in low- and high-stage tumors, thus limiting the usefulness of DWI for the individual patient .
Get Radiology Tree app to read full this article<
Get Radiology Tree app to read full this article<
Materials and methods
Study Population
Get Radiology Tree app to read full this article<
Get Radiology Tree app to read full this article<
MRI Examination
Get Radiology Tree app to read full this article<
Image Analysis
Get Radiology Tree app to read full this article<
Get Radiology Tree app to read full this article<
Statistical Analysis
Get Radiology Tree app to read full this article<
Get Radiology Tree app to read full this article<
Results
Histopathologic Findings
Get Radiology Tree app to read full this article<
Quantitative Analysis
Get Radiology Tree app to read full this article<
Get Radiology Tree app to read full this article<
Get Radiology Tree app to read full this article<
Table 1
Histogram Parameters of ADC-700 and ADC-1500 for Bladder Benign and Malignant Lesions
b = 700 s/mm 2 b = 1500 s/mm 2 Mean Skewness Kurtosis Entropy Mean Skewness Kurtosis Entropy Benign 1.74 (1.50–2.02) 0.38 (0.11–0.61) 3.14 (2.17–4.11) 4.08 (3.73–4.52) 1.38 (1.30–1.55) 0.30 (−0.17–0.65) 2.65 (2.20–3.64) 3.97 (3.77–4.32) Malignant 1.30 (1.03–1.51) 0.62 (0.21–1.06) 3.02 (2.71–4.50) 4.06 (3.62–4.35) 1.07 (0.88–1.25) 0.76 (0.36–1.28) 4.23 (3.13–5.63) 3.78 (3.39–4.04)P value .002 .198 .520 .592 .002 .032 .004 .217
ADC, apparent diffusion coefficient.
Data are expressed as medians with interquartile ranges. ADC mean values are expressed as ×10 −3 mm 2 /s.
ADC skewness, kurtosis, and entropy are dimensionless.
Get Radiology Tree app to read full this article<
Get Radiology Tree app to read full this article<
Table 2
Histogram Parameters of ADC-700 and ADC-1500 for Bladder Cancer of Different T Stages
b = 700 s/mm 2 b = 1500 s/mm 2 Mean Skewness Kurtosis Entropy Mean Skewness Kurtosis Entropy ≤T1 1.38 (1.16–1.62) 0.64 (−0.09–1.21) 3.06 (2.64–4.51) 4.06 (3.62–4.22) 1.23 (0.99–1.32) 0.59 (0.17–1.09) 3.29 (2.90–4.56) 3.89 (3.39–4.05) T2 1.39 (1.07–1.49) 0.59 (0.52–0.63) 2.82 (2.65–4.13) 4.33 (3.88–4.42) 1.15 (0.87–1.21) 0.70 (0.18–1.26) 4.24 (3.92–4.78) 4.02 (3.72–4.16) T3 0.97 (0.85–1.11) 0.66 (0.31–1.82) 3.44 (2.88–7.74) 3.74 (3.42–4.27) 0.81 (0.73–0.93) 1.14 (0.43–1.33) 4.86 (3.48–6.09) 3.58 (3.26–3.74) T4 0.95 (0.88–1.30) 0.69 (0.16–1.05) 2.89 (2.72–4.07) 4.13 (3.36–4.50) 0.78 (0.76–1.13) 1.31 (0.68–1.89) 6.62 (4.06–7.84) 3.81 (3.38–4.04)P value .001 .892 .548 .277 <.001 .235 .046 .155
ADC, apparent diffusion coefficient.
Data are expressed as medians with interquartile ranges. ADC mean values are expressed as ×10 −3 mm 2 /s.
ADC skewness, kurtosis, and entropy are dimensionless.
≤T1 means T1 stage or lower, that is, Tis, Ta, and T1 stages.
Get Radiology Tree app to read full this article<
Get Radiology Tree app to read full this article<
Diagnostic Implications
Get Radiology Tree app to read full this article<
Table 3
Receiver Operating Characteristic Analyses of Mean ADC-1500, Kurtosis ADC-1500, and Skewness ADC-1500 in Distinguishing Bladder Benign Lesions From Malignant Tumors
Parameters AUC Cutoff Value Sensitivity Specificity_P_ Value Mean ADC-1500 0.871 1.29 86.67 85.71 <.001 Kurtosis ADC-1500 0.837 2.87 86.67 71.43 <.001 Skewness ADC-1500 0.754 0.40 73.33 71.43 .004 [Mean, Kurtosis] 0.894 [1.38, 3.78] 77.78 100 <.001
ADC, apparent diffusion coefficient; AUC, area under the curve.
Mean ADC-1500 is expressed as ×10 −3 mm 2 /s.
Table 4
Receiver Operating Characteristic Analyses of Mean ADC-1500, Kurtosis ADC-1500, and Skewness ADC-1500 in Distinguishing Bladder Cancer of High Stage (T2 or Higher) From Low Stage (T1 or Lower)
Parameters AUC Cutoff Value Sensitivity Specificity_P_ Value Mean ADC-1500 0.840 0.90 54.55 100 <.001 Kurtosis ADC-1500 0.696 2.99 100 34.78 .015 Skewness ADC-1500 0.626 1.09 50 78.26 .139
ADC, apparent diffusion coefficient; AUC, area under the curve.
Mean ADC-1500 is expressed as ×10 −3 mm 2 /s.
Get Radiology Tree app to read full this article<
Get Radiology Tree app to read full this article<
Discussion
Get Radiology Tree app to read full this article<
Get Radiology Tree app to read full this article<
Get Radiology Tree app to read full this article<
Get Radiology Tree app to read full this article<
Get Radiology Tree app to read full this article<
Get Radiology Tree app to read full this article<
Get Radiology Tree app to read full this article<
Get Radiology Tree app to read full this article<
Get Radiology Tree app to read full this article<
Conclusions
Get Radiology Tree app to read full this article<
Get Radiology Tree app to read full this article<
Get Radiology Tree app to read full this article<
References
1. Lu Y.-Y., Chen J.-H., Liang J.-A., et. al.: Clinical value of FDG PET or PET/CT in urinary bladder cancer: a systemic review and meta-analysis. Eur J Radiol 2012; 81: pp. 2411-2416.
2. Wu L.-M., Chen X.-X., Xu J.-R., et. al.: Clinical value of T2-weighted imaging combined with diffusion-weighted imaging in preoperative T staging of urinary bladder cancer: a large-scale, multiobserver prospective study on 3.0-T MRI. Acad Radiol 2013; 20: pp. 939-946.
3. Matsuki M., Inada Y., Tatsugami F., et. al.: Diffusion-weighted MR imaging for urinary bladder carcinoma: initial results. Eur Radiol 2007; 17: pp. 201-204.
4. Watanabe H., Kanematsu M., Kondo H., et. al.: Preoperative T staging of urinary bladder cancer: does diffusion-weighted MRI have supplementary value?. Am J Roentgenol 2009; 192: pp. 1361-1366.
5. Takeuchi M., Sasaki S., Ito M., et. al.: Urinary bladder cancer: diffusion-weighted MR imaging—accuracy for diagnosing T stage and estimating histologic grade. Radiology 2009; 251: pp. 112-121.
6. Avcu S., Koseoglu M., Ceylan K., et. al.: The value of diffusion-weighted MRI in the diagnosis of malignant and benign urinary bladder lesions. Brit J Radiol 2011; 84: pp. 875-882.
7. Padhani A.R., Liu G., Mu-Koh D., et. al.: Diffusion-weighted magnetic resonance imaging as a cancer biomarker: consensus and recommendations. Neoplasia (New York, NY) 2009; 11: pp. 102.
8. Dağgülli M., Onur M.R., Fırdolaş F., et. al.: Role of diffusion MRI and apparent diffusion coefficient measurement in the diagnosis, staging and pathological classification of bladder tumors. Urol Int 2011; 87: pp. 346-352.
9. El-Assmy A., Abou-El-Ghar M.E., Mosbah A., et. al.: Bladder tumour staging: comparison of diffusion-and T2-weighted MR imaging. Eur Radiol 2009; 19: pp. 1575-1581.
10. Giannarini G., Petralia G., Thoeny H.C.: Potential and limitations of diffusion-weighted magnetic resonance imaging in kidney, prostate, and bladder cancer including pelvic lymph node staging: a critical analysis of the literature. Eur Urol 2012; 61: pp. 326-340.
11. Ahn S.J., Choi S.H., Kim Y.-J., et. al.: Histogram analysis of apparent diffusion coefficient map of standard and high B-value diffusion MR imaging in head and neck squamous cell carcinoma: a correlation study with histological grade. Acad Radiol 2012; 19: pp. 1233-1240.
12. Pope W.B., Kim H.J., Huo J., et. al.: Recurrent glioblastoma multiforme: ADC histogram analysis predicts response to bevacizumab treatment. Radiology 2009; 252: pp. 182-189.
13. Bull J.G., Saunders D.E., Clark C.A.: Discrimination of paediatric brain tumours using apparent diffusion coefficient histograms. Eur Radiol 2012; 22: pp. 447-457.
14. Kobayashi S., Koga F., Yoshida S., et. al.: Diagnostic performance of diffusion-weighted magnetic resonance imaging in bladder cancer: potential utility of apparent diffusion coefficient values as a biomarker to predict clinical aggressiveness. Eur Radiol 2011; 21: pp. 2178-2186.
15. Funatsu H., Imamura A., Takano H., et. al.: Can pretreatment ADC values predict recurrence of bladder cancer after transurethral resection?. Eur J Radiol 2012; 81: pp. 3115-3119.
16. Rosenkrantz A.B., Mussi T.C., Spieler B., et. al.: High-grade bladder cancer: association of the apparent diffusion coefficient with metastatic disease: preliminary results. J Magn Reson Imaging 2012; 35: pp. 1478-1483.
17. Sobin L.H., Gospodarowicz M.K., Wittekind C.: TNM classification of malignant tumours.2011.Wiley-BlackwellNew York
18. Tozer D.J., Jäger H.R., Danchaivijitr N., et. al.: Apparent diffusion coefficient histograms may predict low-grade glioma subtype. NMR Biomed 2007; 20: pp. 49-57.
19. Kang Y., Choi S.H., Kim Y.-J., et. al.: Gliomas: histogram analysis of apparent diffusion coefficient maps with standard-or high-b-value diffusion-weighted MR imaging—correlation with tumor grade. Radiology 2011; 261: pp. 882-890.
20. Pope W., Lai A., Mehta R., et. al.: Apparent diffusion coefficient histogram analysis stratifies progression-free survival in newly diagnosed bevacizumab-treated glioblastoma. Am J Neuroradiol 2011; 32: pp. 882-889.
21. Downey K., Riches S.F., Morgan V.A., et. al.: Relationship between imaging biomarkers of stage I cervical cancer and poor-prognosis histologic features: quantitative histogram analysis of diffusion-weighted MR images. Am J Roentgenol 2013; 200: pp. 314-320.
22. Heo S.H., Shin S.S., Kim J.W., et. al.: Pre-treatment diffusion-weighted MR imaging for predicting tumor recurrence in uterine cervical cancer treated with concurrent chemoradiation: value of histogram analysis of apparent diffusion coefficients. Korean J Radiol 2013; 14: pp. 616-625.
23. Fujimoto K., Tonan T., Azuma S., et. al.: Evaluation of the mean and entropy of apparent diffusion coefficient values in chronic hepatitis C: correlation with pathologic fibrosis stage and inflammatory activity grade. Radiology 2011; 258: pp. 739-748.
24. Kobayashi S., Koga F., Kajino K., et. al.: Apparent diffusion coefficient value reflects invasive and proliferative potential of bladder cancer. J Magn Reson Imaging 2014; 39: pp. 172-178.
25. Koh D.-M., Collins D.J.: Diffusion-weighted MRI in the body: applications and challenges in oncology. Am J Roentgenol 2007; 188: pp. 1622-1635.
26. O’Brien T., Cranston D., Fuggle S., et. al.: Different angiogenic pathways characterize superficial and invasive bladder cancer. Cancer Res 1995; 55: pp. 510-513.
27. Kim C.K., Park B.K., Kim B.: High-b-value diffusion-weighted imaging at 3 T to detect prostate cancer: comparisons between b values of 1,000 and 2,000 s/mm2. Am J Roentgenol 2010; 194: pp. W33-W37.
28. Shi Z., Yang Z., Zhang G., et. al.: Characterization of texture features of bladder carcinoma and the bladder wall on MRI: initial experience. Acad Radiol 2013; 20: pp. 930-938.
29. Thörmer G., Otto J., Reiss-Zimmermann M., et. al.: Diagnostic value of ADC in patients with prostate cancer: influence of the choice of b values. Eur Radiol 2012; 22: pp. 1820-1828.