
Rationale and Objectives
Dose reduction may compromise patients because of a decrease of image quality. Therefore, the amount of dose savings in new dose-reduction techniques needs to be thoroughly assessed. To avoid repeated studies in one patient, chest computed tomography (CT) scans with different dose levels were performed in corpses comparing model-based iterative reconstruction (MBIR) as a tool to enhance image quality with current standard full-dose imaging.
Materials and Methods
Twenty-five human cadavers were scanned (CT HD750) after contrast medium injection at different, decreasing dose levels D0–D5 and respectively reconstructed with MBIR. The data at full-dose level, D0, have been additionally reconstructed with standard adaptive statistical iterative reconstruction (ASIR), which represented the full-dose baseline reference (FDBR). Two radiologists independently compared image quality (IQ) in 3-mm multiplanar reformations for soft-tissue evaluation of D0–D5 to FDBR (−2, diagnostically inferior; −1, inferior; 0, equal; +1, superior; and +2, diagnostically superior). For statistical analysis, the intraclass correlation coefficient (ICC) and the Wilcoxon test were used.
Results
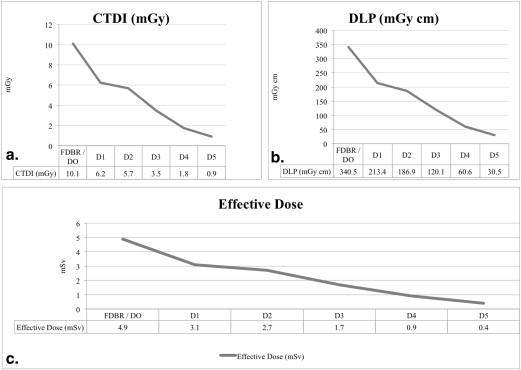
Mean CT dose index values (mGy) were as follows: D0/FDBR = 10.1 ± 1.7, D1 = 6.2 ± 2.8, D2 = 5.7 ± 2.7, D3 = 3.5 ± 1.9, D4 = 1.8 ± 1.0, and D5 = 0.9 ± 0.5. Mean IQ ratings were as follows: D0 = +1.8 ± 0.2, D1 = +1.5 ± 0.3, D2 = +1.1 ± 0.3, D3 = +0.7 ± 0.5, D4 = +0.1 ± 0.5, and D5 = −1.2 ± 0.5. All values demonstrated a significant difference to baseline ( P < .05), except mean IQ for D4 ( P = .61). ICC was 0.91.
Conclusions
Compared to ASIR, MBIR allowed for a significant dose reduction of 82% without impairment of IQ. This resulted in a calculated mean effective dose below 1 mSv.
Computed tomography (CT) is widely available, fast, and offers high-resolution imaging. Consequently, the number of CT examinations is rising , and thus, radiation exposure is increasing as well. As the latter is causing concerns , strategies for effective reduction of radiation dose become necessary .
Various methods are available to reduce dose rate, such as accurate patient positioning, automatic exposure control, and tube-voltage adoption to patient size, as well as iterative image reconstruction methods such as hybrid (adaptive statistical iterative reconstruction [ASIR], sinogram affirmed iterative reconstruction [SAFIRE], and iDose) or fully iterative reconstruction algorithms (model-based iterative reconstruction [MBIR] and iterative image reconstruction [IMR]) . ASIR, a hybrid iterative reconstruction method, allows for dose reductions of >30% in brain CT, 57% in chest CT, and 38% in abdominal CT compared to filtered back projection (FBP) . For the diagnostic evaluation of high-contrast structures such as lung parenchyma, low dose and even ultra-low dose protocols are well established . In contrast, strategies to reduce dose in contrast-enhanced chest CT are limited by challenges concerning the evaluation of soft tissues. Therefore MBIR, a fully iterative reconstruction method with a dedicated data reconstruction optimized for soft tissues, seems promising for further dose rate reduction while keeping image quality (IQ) stable .
Get Radiology Tree app to read full this article<
Get Radiology Tree app to read full this article<
Material and methods
Get Radiology Tree app to read full this article<
Cadavers and Study Design
Get Radiology Tree app to read full this article<
Get Radiology Tree app to read full this article<
Get Radiology Tree app to read full this article<
Get Radiology Tree app to read full this article<
Get Radiology Tree app to read full this article<
Recorded Data
Get Radiology Tree app to read full this article<
CT Protocol and Image Reconstruction
Get Radiology Tree app to read full this article<
Get Radiology Tree app to read full this article<
Table 1
Computed Tomography Examination and Reconstruction Parameters
Scan Protocol HD scan mode No Scan type Helical full Collimation (mm) 40 Rotation time (s) 0.4 Pitch 0.984 Table feed (mm/rotation) 39.37 Tube voltage (kV) 120 Tube current, range (mA), auto mA, smart mA 10–400 Scan field of view (cm) Large body, 50.0
Dose Level Noise Index ∗ Variable Thickness (mm) Reconstruction Method Image Reconstruction (mm) Image Reformation (mm) FDBR † 39 0.625 ASIR soft tissue 50% 0.625 slice 3.0 all planes D0 39 0.625 MBIR D1 35 2.5 MBIR D2 70 0.625 MBIR D3 35 5.0 MBIR D4 70 2.5 MBIR D5 70 5.0 MBIR
ASIR, adaptive statistical iterative reconstruction; FDBR, full-dose baseline reference; HD, high definition; MBIR, model-based iterative reconstruction.
Get Radiology Tree app to read full this article<
Get Radiology Tree app to read full this article<
Get Radiology Tree app to read full this article<
Get Radiology Tree app to read full this article<
Readers and Environment
Get Radiology Tree app to read full this article<
Objective Assessment of IQ
Get Radiology Tree app to read full this article<
Get Radiology Tree app to read full this article<
Get Radiology Tree app to read full this article<
Subjective Assessment of IQ
Get Radiology Tree app to read full this article<
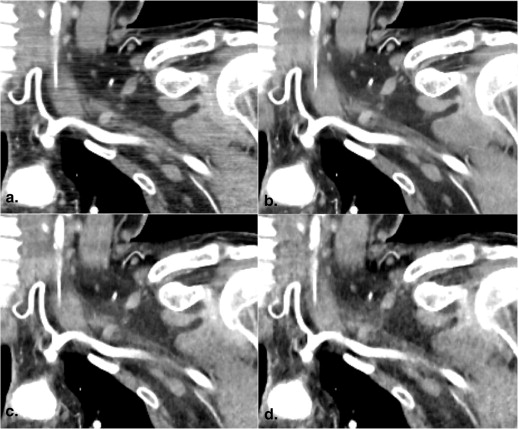
![Figure 3, Examples of subjective image quality (IQ) ratings in different planes. Both readers compared overall subjective IQ for soft-tissue evaluation of dose levels D0–D5 to the full-dose baseline reference. Ratings were done with the help of a semiquantitative score (IQ, −2 = diagnostically inferior; −1 = inferior; 0 = equal; +1 = superior; +2 = diagnostically superior). Comparison of a full-dose scan reconstructed with adaptive statistical iterative reconstruction [ (a) , (c) , (e) ] to the data set acquired with dose level D4 [ (b) , (d) , (f) ] which was about 20% of the full dose. In axial plane (a , b) , ratings were (reader 1 = 0/reader 2 = −1]; in sagittal plane (c , d) (+1/+1); and in coronal plane (e , f) (+1/+2).](https://storage.googleapis.com/dl.dentistrykey.com/clinical/HowLowCanWeGoinContrastEnhancedCTImagingoftheChest/2_1s20S1076633214003985.jpg)
Get Radiology Tree app to read full this article<
Radiation Dose
Get Radiology Tree app to read full this article<
Statistical Analysis
Get Radiology Tree app to read full this article<
Get Radiology Tree app to read full this article<
Table 2
Computed Tomography Dose Index, Dose–Length Product, and Effective Dose for the Different Dose Levels and Corresponding Intended and Observed Mean Dose Levels
CTDI (mGy) DLP (mGy*cm) ED (mSv) Mean Dose Level (%) Mean SD Mean SD Mean SD Intended Observed Dose levels D0 10.1 1.7 340.5 67 4.9 1 100 100 D1 6.2 2.8 213.4 102 3.1 1.4 65 63 D2 5.7 2.7 186.9 96 2.7 1.4 50 55 D3 3.5 1.9 120.1 69.3 1.7 1 35 35 D4 1.8 1 60.6 35.5 0.9 0.5 20 18 D5 0.9 0.5 30.5 17.5 0.4 0.2 10 08
CTDI, computed tomography dose index; DLP, dose–length product; ED, effective dose.
Differences between dose levels were significant for CTDI, DLP, and ED, respectively ( P < .001).
Table 3
Objective Image Quality Measurements in the Different Regions of Interest Air, Muscle, Fat, and Aorta Using Dose Levels (D0–D5) and the Full-Dose Baseline Reference
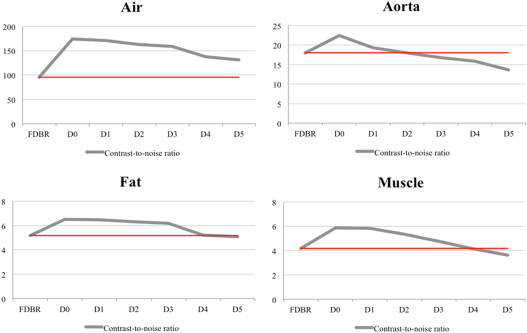
Axial Sagittal Coronal All Planes Mean HU SD CNR Mean HU SD CNR Mean HU SD CNR Mean HU SD CNR_P_ (CNR) Air Dose levels FDBR −988.7 13.3 −95.5 −987.1 13.0 −113.7 −975.2 16.1 −76.8 −983.7 14.1 −95.3 — D0 −989.9 11.3 −185.9 −987.3 10.5 −207.9 −972.7 11.9 −129.6 −983.3 11.2 −174.5 .00 D1 −989.4 10.5 −178.5 −986.4 11.0 −198.2 −973.4 11.6 −126.6 −983.1 11.0 −167.8 .00 D2 −989.3 11.6 −169.5 −986.9 10.7 −195.7 −971.8 12.1 −122.0 −982.7 11.5 −162.4 .00 D3 −989.1 11.7 −165.5 −987.0 10.4 −190.3 −971.4 11.8 −121.2 −982.5 11.3 −159.0 .00 D4 −985.2 12.8 −136.4 −985.8 11.4 −157.8 −976.3 12.1 −117.5 −982.4 12.1 −137.2 .01 D5 −987.8 12.5 −135.2 −983.1 12.0 −141.4 −977.0 12.4 −117.3 −982.6 12.3 −131.3 .02 Muscle Dose levels FDBR 56.3 15.4 3.9 55.2 15.3 4.2 66.4 13.8 5.2 59.3 14.8 4.4 — D0 54.6 11.6 5.2 53.8 9.4 6.3 67.9 10.3 7.0 58.8 10.4 6.2 .00 D1 55.6 12.7 4.6 53.1 9.9 5.8 67.5 10.3 7.1 58.7 11.0 5.8 .01 D2 53.9 13.3 4.3 52.6 10.3 5.5 64.6 11.3 6.1 57.0 11.6 5.3 .04 D3 54.0 13.9 4.2 54.6 11.8 5.2 63.9 11.5 5.8 57.5 12.4 5.1 .19 D4 51.5 16.2 3.4 55.6 13.0 4.8 62.7 13.3 5.0 56.6 14.2 4.4 .26 D5 49.6 18.2 2.9 59.6 16.0 4.3 55.2 16.1 3.7 54.8 16.8 3.6 .20 Fat Dose levels FDBR −88.1 16.0 −6.3 −68.6 17.7 −4.4 −70.8 13.7 −5.5 −75.8 15.8 −5.4 — D0 −89.5 13.3 −8.1 −73.2 16.0 −5.8 −66.9 10.4 −7.0 −76.5 13.2 −7.0 .00 D1 −88.3 14.0 −7.6 −72.9 16.2 −5.6 −69.0 11.6 −6.4 −76.7 13.9 −6.5 .01 D2 −89.4 14.2 −7.2 −73.7 16.7 −5.4 −69.5 12.4 −6.1 −77.5 14.4 −6.2 .05 D3 −88.5 14.4 −7.1 −74.5 17.1 −5.4 −69.7 12.5 −6.1 −77.6 14.7 −6.2 .13 D4 −90.4 16.5 −6.2 −73.5 18.1 −4.9 −71.3 14.7 −5.3 −78.4 16.4 −5.5 .44 D5 −89.1 18.2 −5.4 −71.8 18.8 −4.5 −81.0 16.6 −5.4 −80.6 17.9 −5.1 .55 Aorta Dose levels FDBR 482.5 34.2 18.3 499.8 39.4 17.4 498.6 20.3 28.5 493.6 31.3 21.4 — D0 484.4 31.8 21.3 503.9 33.7 24.5 503.1 15.1 41.7 497.1 26.9 29.2 .00 D1 477.6 36.3 18.7 496.1 34.8 22.4 487.2 17.7 31.3 487.0 29.6 24.1 .27 D2 472.3 45.5 18.8 495.6 35.9 20.4 481.6 23.4 30.3 483.2 34.9 23.2 .37 D3 469.5 43.4 17.5 485.2 38.3 18.2 468.9 28.7 26.4 474.5 36.8 20.7 .44 D4 456.9 40.8 15.3 475.0 34.2 17.8 462.8 23.9 23.3 464.9 33.0 18.8 .23 D5 435.9 42.1 13.4 454.5 38.8 14.3 441.8 26.1 20.0 444.1 35.7 15.9 .02
CNR, contrast-to-noise ratio; FDBR, full-dose baseline reference; HU, Hounsfield units; SD, standard deviation.
Results represented as mean Hounsfield units and standard deviation, and respective contrast-to-noise ratio for all planes (axial, sagittal, and coronal).
Table 4
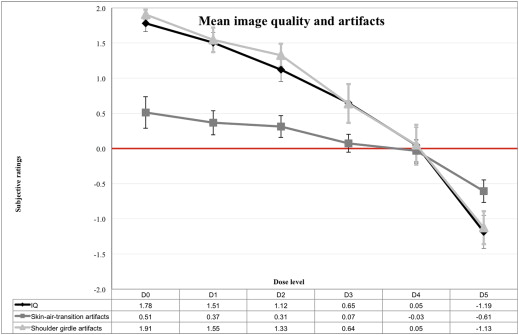
Subjective Image Quality Ratings for Soft-Tissue Evaluation of Dose Levels D0–D5 Compared to Full-Dose Baseline Reference for Mean Image Quality Ratings, Influence of Skin–Air–Transition Artifacts, and Shoulder Girdle Artifacts on Image Quality
Axial Sagittal Coronal All Planes Mean SD Mean SD Mean SD Mean SD_P_ (Mean) IQ Dose levels D0 1.56 0.51 1.80 0.35 1.98 0.10 1.78 0.23 .00 D1 1.28 0.46 1.50 0.41 1.74 0.33 1.51 0.29 .00 D2 0.86 0.42 1.00 0.41 1.50 0.48 1.12 0.33 .00 D3 0.38 0.68 0.54 0.59 1.02 0.64 0.65 0.55 .00 D4 −0.36 0.57 0.06 0.55 0.44 0.77 0.05 0.51 .61 D5 −1.42 0.57 −1.22 0.52 −0.92 0.66 −1.19 0.47 .00 Skin–air–transition artifacts Dose levels D0 −0.18 0.64 0.74 0.65 0.98 0.60 0.51 0.45 .00 D1 −0.26 0.50 0.52 0.51 0.84 0.61 0.37 0.34 .00 D2 −0.22 0.50 0.36 0.42 0.80 0.56 0.31 0.31 .00 D3 −0.30 0.56 0.10 0.32 0.42 0.45 0.07 0.25 .13 D4 −0.48 0.62 0.00 0.25 0.38 0.55 −0.03 0.32 1.00 D5 −0.80 0.54 0.00 0.54 −0.28 0.58 −0.61 0.32 .00 Shoulder girdle artifacts Dose levels D0 1.96 0.14 1.80 0.32 1.96 0.14 1.91 0.14 .00 D1 1.46 0.54 1.38 0.51 1.80 0.35 1.55 0.35 .00 D2 1.16 0.51 1.10 0.38 1.72 0.43 1.33 0.33 .00 D3 0.38 0.87 0.58 0.51 0.96 0.68 0.64 0.55 .00 D4 −0.42 0.77 0.04 0.59 0.54 0.68 0.05 0.57 .50 D5 −1.56 0.46 −1.00 0.63 −0.82 0.58 −1.13 0.47 .00
IQ, image quality; SD, standard deviation.
Get Radiology Tree app to read full this article<
Institutional Review Board Approval
Get Radiology Tree app to read full this article<
Results
Cadaver Examinations
Get Radiology Tree app to read full this article<
Radiation Dose
Get Radiology Tree app to read full this article<
Get Radiology Tree app to read full this article<
Get Radiology Tree app to read full this article<
Objective IQ
Get Radiology Tree app to read full this article<
Get Radiology Tree app to read full this article<
Get Radiology Tree app to read full this article<
Get Radiology Tree app to read full this article<
Get Radiology Tree app to read full this article<
Get Radiology Tree app to read full this article<
Get Radiology Tree app to read full this article<
Subjective IQ
Get Radiology Tree app to read full this article<
Get Radiology Tree app to read full this article<
Get Radiology Tree app to read full this article<
Get Radiology Tree app to read full this article<
Get Radiology Tree app to read full this article<
Inter-reader Correlation
Get Radiology Tree app to read full this article<
Discussion
Get Radiology Tree app to read full this article<
Get Radiology Tree app to read full this article<
Get Radiology Tree app to read full this article<
Get Radiology Tree app to read full this article<
Get Radiology Tree app to read full this article<
Get Radiology Tree app to read full this article<
Get Radiology Tree app to read full this article<
Get Radiology Tree app to read full this article<
Get Radiology Tree app to read full this article<
Appendix A
Get Radiology Tree app to read full this article<
Get Radiology Tree app to read full this article<
Get Radiology Tree app to read full this article<
References
1. Fleischmann D., Boas F.E.: Computed tomography–old ideas and new technology. Eur Radiol 2011; 21: pp. 510-517.
2. Larson D.B., Johnson L.W., Schnell B.M., et. al.: National trends in CT use in the emergency department: 1995-2007. Radiology 2011; 258: pp. 164-173.
3. UNSCEAR United Nations Scientific Committee on the Effects of Atomic Radiation: Sources and effects of ionizing radiation. Report to the general assembly, with scientific annexes2010.UNSCEARNew York
4. Kubo T., Lin P.J., Stiller W., et. al.: Radiation dose reduction in chest CT: a review. AJR Am J Roentgenol 2008; 190: pp. 335-343.
5. Dougeni E., Faulkner K., Panayiotakis G.: A review of patient dose and optimisation methods in adult and paediatric CT scanning. Eur J Radiol 2012; 81: pp. e665-e683.
6. Loewenhardt B., Buhl M., Gries A., et. al.: Radiation exposure in whole-body computed tomography of multiple trauma patients: bearing devices and patient positioning. Injury 2012; 43: pp. 67-72.
7. Wilting J.E., Zwartkruis A., van Leeuwen M.S., et. al.: A rational approach to dose reduction in CT: individualized scan protocols. Eur Radiol 2001; 11: pp. 2627-2632.
8. Zoli S., Trabattoni P., Dainese L., et. al.: Cumulative radiation exposure during thoracic endovascular aneurysm repair and subsequent follow-up. Eur J Cardiothorac Surg 2012; 42: pp. 254-259. discussion 9–60
9. Bayer J., Pache G., Strohm P.C., et. al.: Influence of arm positioning on radiation dose for whole body computed tomography in trauma patients. J Trauma 2011; 70: pp. 900-905.
10. Karlo C., Gnannt R., Frauenfelder T., et. al.: Whole-body CT in polytrauma patients: effect of arm positioning on thoracic and abdominal image quality. Emerg Radiol 2011; 18: pp. 285-293.
11. Maxfield M.W., Schuster K.M., McGillicuddy E.A., et. al.: Impact of adaptive statistical iterative reconstruction on radiation dose in evaluation of trauma patients. J Trauma Acute Care Surg 2012; 73: pp. 1406-1411.
12. McCollough C.H., Bruesewitz M.R., Kofler J.M.: CT dose reduction and dose management tools: overview of available options. Radiographics 2006; 26: pp. 503-512.
13. Mieville F.A., Berteloot L., Grandjean A., et. al.: Model-based iterative reconstruction in pediatric chest CT: assessment of image quality in a prospective study of children with cystic fibrosis. Pediatr Radiol 2013; 43: pp. 558-567.
14. Winklehner A., Karlo C., Puippe G., et. al.: Raw data-based iterative reconstruction in body CTA: evaluation of radiation dose saving potential. Eur Radiol 2011; 21: pp. 2521-2526.
15. Mueck F.G., Korner M., Scherr M.K., et. al.: Upgrade to iterative image reconstruction (IR) in abdominal MDCT imaging: a clinical study for detailed parameter optimization beyond vendor recommendations using the adaptive statistical iterative reconstruction environment (ASIR). Rofo 2012; 184: pp. 229-238.
16. Qi L.P., Li Y., Tang L., et. al.: Evaluation of dose reduction and image quality in chest CT using adaptive statistical iterative reconstruction with the same group of patients. Br J Radiol 2012; 85: pp. e906-e911.
17. Ren Q., Dewan S.K., Li M., et. al.: Comparison of adaptive statistical iterative and filtered back projection reconstruction techniques in brain CT. Eur J Radiol 2012; 81: pp. 2597-2601.
18. Botelho M.P., Agrawal R., Gonzalez-Guindalini F.D., et. al.: Effect of radiation dose and iterative reconstruction on lung lesion conspicuity at MDCT: does one size fit all?. Eur J Radiol 2013; 82: pp. e726-e733.
19. Deak Z., Grimm J.M., Treitl M., et. al.: Filtered back projection, adaptive statistical iterative reconstruction, and a model-based iterative reconstruction in abdominal CT: an experimental clinical study. Radiology 2013; 266: pp. 197-206.
20. Ichikawa Y., Kitagawa K., Nagasawa N., et. al.: CT of the chest with model-based, fully iterative reconstruction: comparison with adaptive statistical iterative reconstruction. BMC Med Imaging 2013; 13: pp. 27.
21. Katsura M., Matsuda I., Akahane M., et. al.: Model-based iterative reconstruction technique for radiation dose reduction in chest CT: comparison with the adaptive statistical iterative reconstruction technique. Eur Radiol 2012; 22: pp. 1613-1623.
22. Vardhanabhuti V., Loader R.J., Mitchell G.R., et. al.: Image quality assessment of standard- and low-dose chest CT using filtered back projection, adaptive statistical iterative reconstruction, and novel model-based iterative reconstruction algorithms. AJR Am J Roentgenol 2013; 200: pp. 545-552.
23. Hong S.S., Lee J.W., Seo J.B., et. al.: Evaluation of image quality and radiation dose by adaptive statistical iterative reconstruction technique level for chest CT examination. Radiat Prot Dosimetry 2013; 157: pp. 163-171.
24. Xu Y., He W., Chen H., et. al.: Impact of the adaptive statistical iterative reconstruction technique on image quality in ultra-low-dose CT. Clin Radiol 2013; 68: pp. 902-908.
25. Grabherr S., Doenz F., Steger B., et. al.: Multi-phase post-mortem CT angiography: development of a standardized protocol. Int J Legal Med 2011; 125: pp. 791-802.
26. Christine C., Francesco D., Paul V., et. al.: Postmortem computed tomography angiography vs. conventional autopsy: advantages and inconveniences of each method. Int J Legal Med 2013; 127: pp. 981-989.
27. Mueck F.G., Michael L., Deak Z., et. al.: Upgrade to iterative image reconstruction (lR) in MDCT imaging: a clinical study for detailed parameter optimization beyond vendor recommendations using the adaptive statistical iterative reconstruction environment (ASIR) part2: the chest. Rofo 2013; 185: pp. 644-654.
28. Yamada Y., Jinzaki M., Tanami Y., et. al.: Model-based iterative reconstruction technique for ultralow-dose computed tomography of the lung: a pilot study. Invest Radiol 2012; 47: pp. 482-489.
29. Samei E., Badano A., Chakraborty D., et. al.: Assessment of display performance for medical imaging systems: executive summary of AAPM TG18 report. Med Phys 2005; 32: pp. 1205-1225.
30. Vardhanabhuti V., Ilyas S., Gutteridge C., et. al.: Comparison of image quality between filtered back-projection and the adaptive statistical and novel model-based iterative reconstruction techniques in abdominal CT for renal calculi. Insights Imaging 2013; 4: pp. 661-669.
31. EUR 16262. Quality criteria for computed tomography. Available at: http://www.drs.dk/guidelines/ct/quality/download/eur16262.w51 . Accessed June 21, 2012.
32. Deak P.D., Smal Y., Kalender W.A.: Multisection CT protocols: sex- and age-specific conversion factors used to determine effective dose from dose-length product. Radiology 2010; 257: pp. 158-166.
33. Hwang H.J., Seo J.B., Lee H.J., et. al.: Low-dose chest computed tomography with sinogram-affirmed iterative reconstruction, iterative reconstruction in image space, and filtered back projection: studies on image quality. J Comput Assist Tomogr 2013; 37: pp. 610-617.
34. Grabherr S., Hess A., Karolczak M., et. al.: Angiofil-mediated visualization of the vascular system by microcomputed tomography: a feasibility study. Microsc Res Tech 2008; 71: pp. 551-556.
35. Langenberger H., Friedrich K., Plank C., et. al.: MDCT angiography for detection of pulmonary emboli: comparison between equi-iodine doses of iomeprol 400 mgI/mL and iodixanol 320 mgI/mL. Eur J Radiol 2009; 70: pp. 579-588.