
Rationale and Objectives
To determine the impact of mammographic breast density on the visual search process of radiologists when reading digital mammograms.
Materials and Methods
Institutional review board approval was obtained. A set of 149 craniocaudal digital mammograms were read by seven radiologists, and observer search patterns were recorded. Total time examining each case, time to first hit the lesion, dwell time, and number of hits per area were calculated. The nonparametric Mann–Whitney U test was used for statistical evaluation.
Results
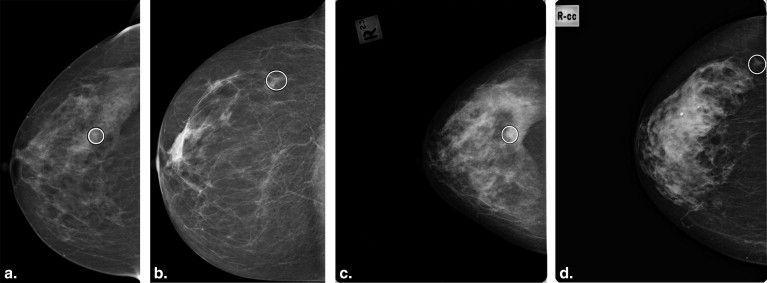
In both low- and high-mammographic density cases, significant increases were observed in the time to first hit lesions when they were located outside, compared to overlying fibroglandular dense tissue ( P = .001). Significantly longer dwell time ( P = .003) and greater number of fixations ( P = .0003) were observed when the lesions were situated within—rather than outside—the dense fibroglandular tissue.
Conclusions
Increased mammographic breast density changes radiologists’ visual search patterns. Dense areas of the parenchyma attracted greater visual attention in both high- and low-mammographic density cases, resulting in faster detection of lesions overlying the fibroglandular dense tissue, along with longer dwell times and greater number of fixations, as compared to lesions located outside the dense fibroglandular regions.
Mammography is the only proven screening tool for early detection of breast cancer, and it has been shown to significantly decrease breast cancer mortality . Mammograms display the main components of the breast, namely adipose and fibroglandular connective tissues, with the latter appearing whiter than the former because of increased attenuation properties . Mammographic density refers to the proportion of fibroglandular tissue that is displayed relative to the remaining parts of the breast.
It is well reported that, with film technology, high mammographic density reduces the radiologists’ ability to detect cancer, as sensitivity decreased from 80%–98% in fatty breasts to 29.2%–75% in dense breasts . This led to greater numbers of missed cancers , interval cancers , recall rates , and screen-detected tumors of >15 mm in size . Moreover, mammographic specificity was lower in dense breasts , decreasing from 96.9% in women with almost entirely fatty breasts to 89.1% in extremely dense breasts .
Get Radiology Tree app to read full this article<
Get Radiology Tree app to read full this article<
Get Radiology Tree app to read full this article<
Materials and methods
Get Radiology Tree app to read full this article<
Table 1
Demographic Details on Participating Radiologists
Radiologist Number Age Years Reading Mammograms Average Mammograms Read Per Year 1 43 13 20,000 2 61 25 5500 3 47 13 5000 4 48 5 2000 5 31 2 1000 6 31 1 500 7 40 11 500 Mean 43.0 10 4928.6
Get Radiology Tree app to read full this article<
Cases
Get Radiology Tree app to read full this article<
Get Radiology Tree app to read full this article<
Get Radiology Tree app to read full this article<
Get Radiology Tree app to read full this article<
Get Radiology Tree app to read full this article<
Get Radiology Tree app to read full this article<
Get Radiology Tree app to read full this article<
Table 2
Median Lesion Diameter in Low- and High-Mammographic Density Cases When the Lesions Outside—and When They Overlie—the Dense Fibroglandular Tissue
Case Type Number of Cases Median Lesion Diameter, mm (IQR) Low-density cases 37 12.8 (6.3) High-density cases 37 12 (4.1) Low-density cases with lesion overlying fibroglandular region 18 11.7 (5.7) Low-density cases with lesion outside fibroglandular region 19 12.8 (6.6) High-density cases with lesion overlying fibroglandular region 21 12.0 (5.2) High-density cases with lesion outside fibroglandular region 16 11.6 (2.3)
IQR, interquartile range.
Get Radiology Tree app to read full this article<
Experimental Protocol
Get Radiology Tree app to read full this article<
Get Radiology Tree app to read full this article<
Get Radiology Tree app to read full this article<
Data Analysis
Normalized Breast Size
Get Radiology Tree app to read full this article<
Lesion Type and Diameter
Get Radiology Tree app to read full this article<
Eye Position Analysis
Get Radiology Tree app to read full this article<
Get Radiology Tree app to read full this article<
Get Radiology Tree app to read full this article<
Get Radiology Tree app to read full this article<
Get Radiology Tree app to read full this article<
Get Radiology Tree app to read full this article<
Get Radiology Tree app to read full this article<
Get Radiology Tree app to read full this article<
Get Radiology Tree app to read full this article<
Get Radiology Tree app to read full this article<
Get Radiology Tree app to read full this article<
Get Radiology Tree app to read full this article<
Results
Normalized Breast Size
Get Radiology Tree app to read full this article<
Lesion Type and Diameter
Get Radiology Tree app to read full this article<
Eye Position Analysis
Lesion Detectability
Get Radiology Tree app to read full this article<
Effect of Mammographic Density on the Radiologists’ Visual Search in Malignancy-Containing Mammograms
Effect of lesion location
In low-density cases
Get Radiology Tree app to read full this article<
Table 3
Lesion Location: Effect in Low-Density Mammograms
Category Lesion Overlying Fibroglandular Tissue ( n = 18) Lesion Outside Fibroglandular Tissue ( n = 19)z__P Total time examining a case 7.81 (9.61) 7.17 (8.66) −0.97 .33 Time to first hit the lesion 2.28 (12.01) 8.44 (27.71) −3.43 .001 Dwell time Background 4.91 (5.77) 4.38 (5.16) −0.64 .52 Dense 0.72 (1.60) 0.97 (1.70) −2.67 .01 Lesion 1.76 (4.01) 1.13 (2.26) −2.98 .003 Number of hits per area Background 18 (14.0) 18 (17.25) −0.01 .10 Dense 3 (7.0) 5 (8.25) −3.39 .001 Lesion 7 (8.0) 4 (6.0) −3.58 .0003
IQR, interquartile range.
Median values (IQR) are shown. Times are shown in seconds.
Get Radiology Tree app to read full this article<
In high-density cases
Get Radiology Tree app to read full this article<
Table 4
Lesion Location: Effect in High-Density Mammograms
Category Lesion Overlying Fibroglandular Tissue ( n = 21) Lesion Outside Fibroglandular Tissue ( n = 16)z__P Total time examining a case 8.45 (10.75) 7.60 (8.96) −1.37 .17 Time to first hit the lesion 7.96 (16.64) 12.63 (14.25) −3.48 .001 Dwell time Background 5.17 (6.05) 4.64 (4.63) −1.19 .24 Dense 1.26 (2.50) 1.65 (2.77) −1.04 .30 Lesion 1.67 (2.97) 1.04 (1.38) −3.56 .0004 Number of hits per area Background 20 (17.0) 17 (15.0) −0.85 .39 Dense 6 (9.75) 7 (12.50) −1.18 .24 Lesion 6 (8.0) 4 (5.0) −4.10 <.0001
IQR, interquartile range.
Median values (IQR) are shown. Times are shown in seconds.
Get Radiology Tree app to read full this article<
Effect of case density
Lesions overlying the fibroglandular dense tissue
Get Radiology Tree app to read full this article<
Lesions outside the fibroglandular dense tissue
Get Radiology Tree app to read full this article<
Effect of Mammographic Density in Malignancy-Free Mammograms
Get Radiology Tree app to read full this article<
Table 5
Malignancy-Free Cases: Effect of Mammographic Density on Radiologists’ Visual Search
Category Low Density ( n = 37) High Density ( n = 38)z__P Total time examining a case 6.48 (7.32) 9.85 (8.99) −1.42 .17 Dwell time Background 4.08 (4.46) 5.61 (5.0) −0.91 .38 Dense 2.21 (2.94) 4.14 (4.11) −2.28 .02 Number of hits per area Background 17 (14.75) 21 (17.0) −1.60 .13 Dense 9 (9.0) 17 (14.0) −2.63 .01
IQR, interquartile range.
Median values (IQR) are shown. Times are shown in seconds.
Get Radiology Tree app to read full this article<
Discussion
Get Radiology Tree app to read full this article<
Get Radiology Tree app to read full this article<
Get Radiology Tree app to read full this article<
Get Radiology Tree app to read full this article<
Get Radiology Tree app to read full this article<
Get Radiology Tree app to read full this article<
Get Radiology Tree app to read full this article<
Acknowledgments
Get Radiology Tree app to read full this article<
References
1. Andersson I., Janzon L.: Reduced breast cancer mortality in women under age 50: updated results from the malmö mammographic screening program. J Natl Cancer Inst Monogr 1997; pp. 63-67.
2. Tabár L., Vitak B., Chen H.-H.T., et. al.: Beyond randomized controlled trials. Cancer 2001; 91: pp. 1724-1731.
3. Duffy S.W., Tabár L., Chen H.-H., et. al.: The impact of organized mammography service screening on breast carcinoma mortality in seven Swedish counties. Cancer 2002; 95: pp. 458-469.
4. Otto S.J., Fracheboud J., Looman C.W.N., et. al.: Initiation of population-based mammography screening in Dutch municipalities and effect on breast-cancer mortality: a systematic review. Lancet 2003; 361: pp. 1411-1417.
5. Duffy S.W., Tabar L., Olsen A.H., et. al.: Absolute numbers of lives saved and overdiagnosis in breast cancer screening, from a randomized trial and from the Breast Screening Programme in England. J Med Screen 2010; 17: pp. 25-30.
6. Kalager M., Zelen M., Langmark F., et. al.: Effect of screening mammography on breast-cancer mortality in Norway. N Engl J Med 2010; 363: pp. 1203-1210.
7. Tabár L., Vitak B., Chen T.H.-H., et. al.: Swedish two-county trial: impact of mammographic screening on breast cancer mortality during 3 decades. Radiology 2011; 260: pp. 658-663.
8. Paci E.: Summary of the evidence of breast cancer service screening outcomes in Europe and first estimate of the benefit and harm balance sheet. J Med Screen 2012; 19: pp. 5-13.
9. Smith R.A., Duffy S.W., Tabar L.: Breast cancer screening: the evolving evidence. Oncology (Williston Park) 2012; 26: pp. 471-486. Available at: http://www.ncbi.nlm.nih.gov/pubmed/22730603 Accessed December 29, 2013
10. Boyd N.F., Guo H., Martin L.J., et. al.: Mammographic density and the risk and detection of breast cancer. N Engl J Med 2007; 356: pp. 227-236.
11. Boyd N.F., Martin L.J., Bronskill M., et. al.: Breast tissue composition and susceptibility to breast cancer. J Natl Cancer Inst 2010; 102: pp. 1224-1237.
12. Kerlikowske K., Grady D., Barclay J., et. al.: Effect of age, breast density, and family history on the sensitivity of first screening mammography. JAMA 1996; 276: pp. 33-38.
13. Rosenberg R.D., Hunt W.C., Williamson M.R., et. al.: Effects of age, breast density, ethnicity, and estrogen replacement therapy on screening mammographic sensitivity and cancer stage at diagnosis: review of 183,134 screening mammograms in Albuquerque, New Mexico. Radiology 1998; 209: pp. 511-518.
14. Kolb T.M., Lichy J., Newhouse J.H.: Comparison of the performance of screening mammography, physical examination, and breast US and evaluation of factors that influence them: an analysis of 27,825 patient evaluations. Radiology 2002; 225: pp. 165-175.
15. Buist D.S.M., Porter P.L., Lehman C., et. al.: Factors contributing to mammography failure in women aged 40-49 years. J Natl Cancer Inst 2004; 96: pp. 1432-1440.
16. Mandelson M.T., Oestreicher N., Porter P.L., et. al.: Breast density as a predictor of mammographic detection: comparison of interval- and screen-detected cancers. J Natl Cancer Inst 2000; 92: pp. 1081-1087.
17. Carney P.A., Miglioretti D.L., Yankaskas B.C., et. al.: Individual and combined effects of age, breast density, and hormone replacement therapy use on the accuracy of screening mammography. Ann Intern Med 2003; 138: pp. 168-175.
18. Cawson J.N., Nickson C., Amos A., et. al.: Invasive breast cancers detected by screening mammography: a detailed comparison of computer-aided detection-assisted single reading and double reading. J Med Imaging Radiat Oncol 2009; 53: pp. 442-449.
19. Bird R.E., Wallace T.W., Yankaskas B.C.: Analysis of cancers missed at screening mammography. Radiology 1992; 184: pp. 613-617.
20. Chiarelli A.M., Kirsh V.A., Klar N.S., et. al.: Influence of patterns of hormone replacement therapy use and mammographic density on breast cancer detection. Cancer Epidemiol Biomarkers Prev 2006; 15: pp. 1856-1862.
21. Ciatto S., Visioli C., Paci E., et. al.: Breast density as a determinant of interval cancer at mammographic screening. Br J Cancer 2004; 90: pp. 393-396.
22. Litherland J.C., Evans A.J., Wilson A.R.: The effect of hormone replacement therapy on recall rate in the National Health Service Breast Screening Programme. Clin Radiol 1997; 52: pp. 276-279.
23. Persson I., Thurfjell E., Holmberg L.: Effect of estrogen and estrogen-progestin replacement regimens on mammographic breast parenchymal density. J Clin Oncol 1997; 15: pp. 3201-3207.
24. Roubidoux M.A., Bailey J.E., Wray L.A., et. al.: Invasive cancers detected after breast cancer screening yielded a negative result: relationship of mammographic density to tumor prognostic factors. Radiology 2004; 230: pp. 42-48.
25. Porter G.J.R., Evans A.J., Cornford E.J., et. al.: Influence of mammographic parenchymal pattern in screening-detected and interval invasive breast cancers on pathologic features, mammographic features, and patient survival. AJR Am J Roentgenol 2007; 188: pp. 676-683.
26. Kavanagh A.M., Byrnes G.B., Nickson C., et. al.: Using mammographic density to improve breast cancer screening outcomes. Cancer Epidemiol Biomarkers Prev 2008; 17: pp. 2818-2824.
27. Nickson C., Kavanagh A.M.: Tumour size at detection according to different measures of mammographic breast density. J Med Screen 2009; 16: pp. 140-146.
28. Kriege M., Brekelmans C., Obdeijn I., et. al.: Factors affecting sensitivity and specificity of screening mammography and MRI in women with an inherited risk for breast cancer. Breast Cancer Res Treat 2006; 100: pp. 109-119.
29. Pisano E.D., Hendrick R.E., Yaffe M.J., et. al.: Diagnostic accuracy of digital versus film mammography: exploratory analysis of selected population subgroups in DMIST. Radiology 2008; 246: pp. 376-383.
30. Kerlikowske K., Hubbard R.A., Miglioretti D.L., et. al.: Comparative effectiveness of digital versus film-screen mammography in community practice in the United States: a cohort study. Ann Intern Med 2011; 155: pp. 493-502.
31. Séradour B., Heid P., Estève J.: Comparison of direct digital mammography, computed radiography, and film-screen in the French National Breast Cancer Screening Program. AJR Am J Roentgenol 2014; 202: pp. 229-236.
32. Al Mousa D.S., Mello-Thoms C., Ryan E.A., et. al.: Mammographic density and cancer detection: does digital imaging challenge our current understanding?. Acad Radiol 2014; 21: pp. 1377-1385.
33. Krupinski E.A.: Visual scanning patterns of radiologists searching mammograms. Acad Radiol 1996; 3: pp. 137-144.
34. Nodine C.F., Kundel H.L., Lauver S.C., et. al.: Nature of expertise in searching mammograms for breast masses. Acad Radiol 1996; 3: pp. 1000-1006.
35. Nodine C.F., Mello-Thoms C., Kundel H.L., et. al.: Time course of perception and decision making during mammographic interpretation. AJR Am J Roentgenol 2002; 179: pp. 917-923.
36. Kundel H.L., Nodine C.F., Krupinski E.A., et. al.: Using gaze-tracking data and mixture distribution analysis to support a holistic model for the detection of cancers on mammograms. Acad Radiol 2008; 15: pp. 881-886.
37. Krupinski E., Roehrig H., Dallas W., et. al.: Differential use of image enhancement techniques by experienced and inexperienced observers. J Digit Imaging 2005; 18: pp. 311-315.
38. National Breast Cancer Center: Synoptic breast imaging report.2007.National Breast Cancer CenterCamperdown, NSW Available at: http://canceraustralia.nbocc.org.au/view-document-details/rsig-1-synoptic-breast-imaging-report-update Accessed July 1, 2013
39. Byng J.W., Boyd N.F., Fishell E., et. al.: The quantitative analysis of mammographic densities. Phys Med Biol 1994; 39: pp. 1629-1638.
40. EIZO NANAO corporation. RadiCS—quality control software. Available at: http://www.eizo.com/global/products/radiforce/radics/index.html . Accessed July 1, 2013.
41. National Electrical Manufacturer’s Association. Digital Imaging and Communication in Medicine (DICOM) Part 14: Grayscale Standard Display Function. Available at: http://medical.nema.org/Dicom/2011/11_14pu.pdf . Accessed July 10, 2013.
42. Ciatto S., Houssami N., Bernardi D., et. al.: Integration of 3D digital mammography with tomosynthesis for population breast-cancer screening (STORM): a prospective comparison study. Lancet Oncol 2013; 14: pp. 583-589.
43. Boyd N.F., Byng J.W., Jong R.A., et. al.: Quantitative classification of mammographic densities and breast cancer risk: results from the Canadian National Breast Screening Study. J Natl Cancer Inst 1995; 87: pp. 670-675.
44. Byrne C., Schairer C., Wolfe J., et. al.: Mammographic features and breast cancer risk: effects with time, age, and menopause status. J Natl Cancer Inst 1995; 87: pp. 1622-1629.
45. Boyd N.F., Lockwood G.A., Byng J.W., et. al.: Mammographic densities and breast cancer risk. Cancer Epidemiol Biomarkers Prev 1998; 7: pp. 1133-1144.
46. McCormack V.A., dos Santos Silva I.: Breast density and parenchymal patterns as markers of breast cancer risk: a meta-analysis. Cancer Epidemiol Biomarkers Prev 2006; 15: pp. 1159-1169.
47. Al Mousa D.Ryan E.Lee W. et. al.The impact of mammographic density and lesion location on detection.2013.In Proc SPIE 86730U-86730U-86739U
48. Kundel H.L., Nodine C.F.: A visual concept shapes image perception. Radiology 1983; 146: pp. 363-368.
49. Mello-Thoms C., Dunn S., Nodine C.F., et. al.: The perception of breast cancer: what differentiates missed from reported cancers in mammography?. Acad Radiol 2002; 9: pp. 1004-1012.
50. Mello-Thoms C.: The perception of breast cancer: eye-position analysis of mammogram interpretation. Acad Radiol 2003; 10: pp. 4-12.
51. Mello-Thoms C., Dunn S.M., Nodine C.F., et. al.: The perception of breast cancers—a spatial frequency analysis of what differentiates missed from reported cancers. IEEE Trans Med Imaging 2003; 22: pp. 1297-1306.
52. Mello-Thoms C.: How does the perception of a lesion influence visual search strategy in mammogram reading?. Acad Radiol 2006; 13: pp. 275-288.
53. Duncan J., Humphreys G.W.: Visual search and stimulus similarity. Psychol Rev 1989; 96: pp. 433-458.
54. Olds E., Degani M.: Does partial difficult search help difficult search?. Percept Psychophys 2003; 65: pp. 238-253.
55. D’Zmura M.: Color in visual search. Vision Res 1991; 31: pp. 951-966.
56. Bauer B., Jolicoeur P., Cowan W.B.: Visual search for colour targets that are or are not linearly separable from distractors. Vision Res 1996; 36: pp. 1439-1466.