
Rationale and Objectives
Using a novel 129 Xe polarizer with high throughput (1–2 L/hour) and high polarization (∼55%), our objective was to demonstrate and characterize human pulmonary applications at 0.2T. Specifically, we investigated the ability of 129 Xe to measure the alveolar surface area per unit volume of gas, S A / V gas .
Materials and Methods
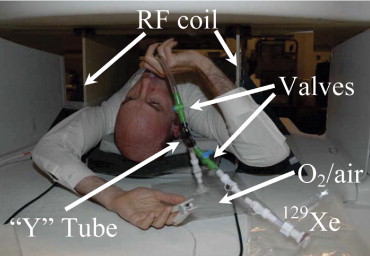
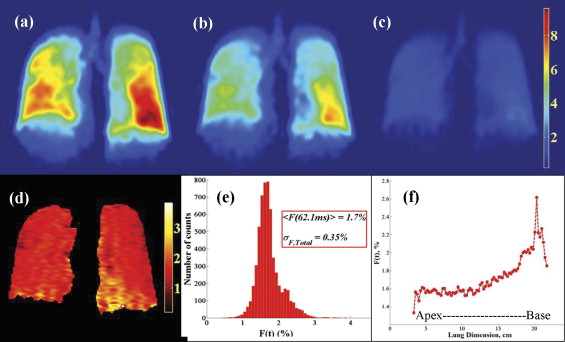
Variable spin echo time (TE) gradient and radiofrequency (RF) echoes were used to obtain estimates of the lung’s contribution to both T 2 \* and T 2 . Standard multislice ventilation images were obtained and signal-to-noise ratio (SNR) determined. Whole-lung, time-dependent measurements of 129 Xe diffusion from gas to septal tissue were obtained with a chemical shift saturation recovery (CSSR) method. Four healthy subjects were studied, and the Butler et al CSSR formalism ( J Phys Condensed Matter 2002; 14:L297–L304) was used to calculate S A / V gas . A single-breath version of the xenon transfer contrast (SB-XTC) method was implemented and used to image 129 Xe diffusion between alveolar gas and septal tissue. A direct comparison of CSSR and SB-XTC was performed.
Results
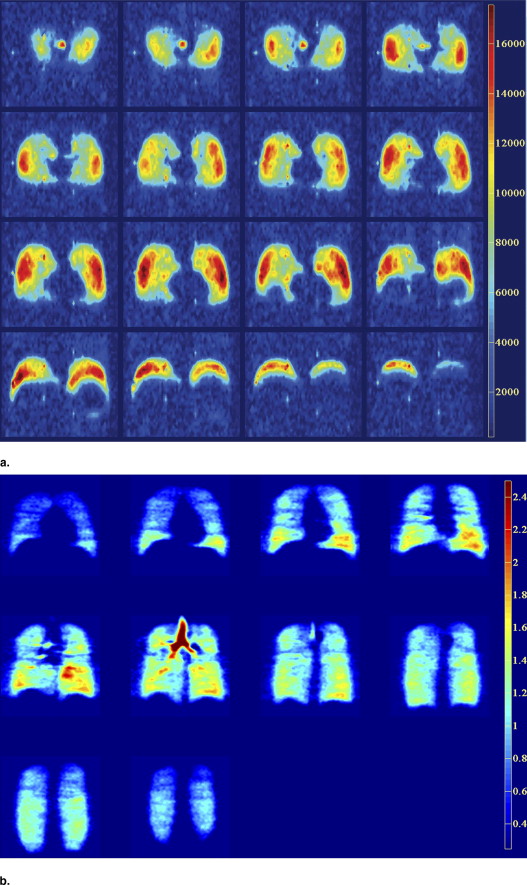
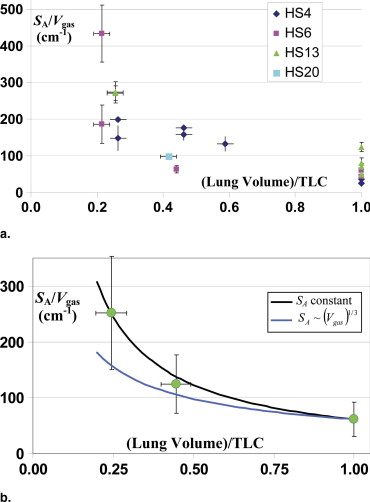
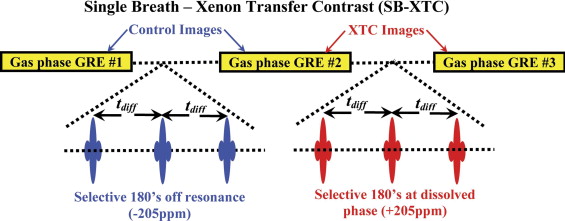
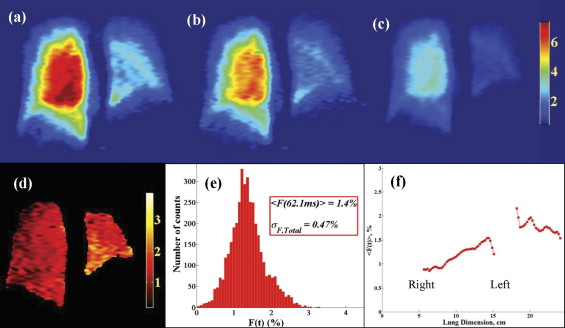
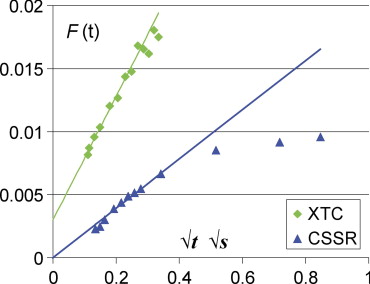
T 2 \* = 135 ± 29 ms amd T 2 = 326.2 ± 9.5 ms. Maximum SNR = 36 for ventilation images from inhalation of 1L 86% 129 Xe and voxel volume = 0.225 mL. CSSR analysis showed S A / V gas decreased with increasing lung volume in a manner very similar to that observed from histology measurements; however, the absolute value of S A / V gas was ∼40% smaller than histology values. SB-XTC images in different postures demonstrate gravitationally dependent values. Initial comparison of CSSR with XTC showed fairly good agreement with expected ratios.
Conclusions
Hyperpolarized 129 Xe human imaging and spectroscopy are very promising methods to provide functional information about the lung.
To date, the vast majority of work in human hyperpolarized noble gas imaging has been with 3 He and not 129 Xe. Mugler et al ( ) demonstrated the very first human ventilation images and spectra with 129 Xe in 1998 and later obtained the first human apparent diffusion coefficient images of the gas phase ( ). Kilian et al ( ) demonstrated human time-resolved 129 Xe spectra from both gray and white matter in 2004. A significant problem for 129 Xe in human studies has been the lack of a polarizer with sufficiently high polarization and throughput. High polarization is absolutely necessary because, compared to 3 He, 129 Xe suffers two significant disadvantages. First, the gyromagnetic ratio is less by a factor of ∼3 and, second, the isotopic abundance of 129 Xe is only 26% compared to 100% for 3 He. These two factors mean that 129 Xe suffers an inherent loss in signal of a factor of ∼12 compared to 3 He. Despite these problems, there has been vigorous work studying both phantoms and animals using 129 Xe. This is because of the inherent advantage 129 Xe offers because of its solubility in tissue. This, together with the fact that there is a large (∼200 parts per million [ppm]) chemical shift between the gas and dissolved spectral peaks of 129 Xe means that one can easily discern 129 Xe in the different chemical phases. Ruppert et al ( ), Driehuys et al ( ), and Mansson et al ( ) have made very significant contributions toward demonstrating the ability to measure functional pulmonary physiology by observing the diffusion of 129 Xe from alveolar gas to dissolved phases (ie, septal tissue). Our own work using a chemical shift saturation recovery (CSSR) method in porous phantoms ( ) has demonstrated that the early time slope of the CSSR data is related to the alveolar surface area per unit of gas volume S A / V gas . Using this formalism, Cai et al ( ) demonstrated a high degree of correlation between the slope of the xenon transfer contrast (XTC) depolarization curve and morphometric measurements of surface area per unit volume in a rabbit emphysema model. Here we report initial CSSR results in humans using a novel 129 Xe polarizer at 0.2T ( ). We also report human imaging with the XTC method and report an initial comparison with CSSR. Finally, we also report a measurement of the contribution to both T 2 and T 2 * from the lung at 0.2T as well as the signal-to-noise ratio (SNR) obtained with standard gradient echo imaging.
Materials and methods
129 Xe Polarizer
A University of New Hampshire 129 Xe polarizer was installed at Brigham and Women’s Hospital and became operational in the second quarter of 2005. This polarizer is capable of delivering 1–2 L/hour at ∼55% polarization. This polarizer is the first University of New Hampshire unit located outside of University of New Hampshire and represents an early design from the University of New Hampshire group. Nevertheless, this polarizer has proved exceptionally robust with only small periods of downtime required for occasional maintenance. Polarized xenon is frozen to separate the buffer gases, then thawed into a Tedlar bag (Welch Fluorocarbon, Dover, NH) with ∼99% polarization recovery. The volume of 129 Xe delivered to a subject varied from 0.5–2 L depending on both the subject’s total lung capacity (TLC) as well as the fraction of TLC at which the experiment was being performed. There was some inefficiency in the polarizer in that it was necessary to prepare 0.3 L more than the quantity delivered to the subject. This is because 0.3 L is the volume of the spiral cell and connecting tubing to the Tedlar bag. Although we were unable to use this gas for human inhalation, we did measure the signal from the remaining gas in the spiral cell. By comparing this with that from a standard thermal cell, we were able to monitor the absolute polarization. The thermal cell consisted of a 2.91-L spherical glass cell filled with 4.01 atm of 86% enriched 129 Xe (thermal polarization) and 2.02 atm O 2 . The oxygen was added to reduce T 1 , which was measured to be 0.89 sec. To account for any differences in field homogeneity because of different sizes of the thermal and hyperpolarized samples, the signal was measured by integration over the linewidth.
Magnetic Resonance Imaging Hardware
Get Radiology Tree app to read full this article<
Get Radiology Tree app to read full this article<
Human Protocols
Get Radiology Tree app to read full this article<
Get Radiology Tree app to read full this article<
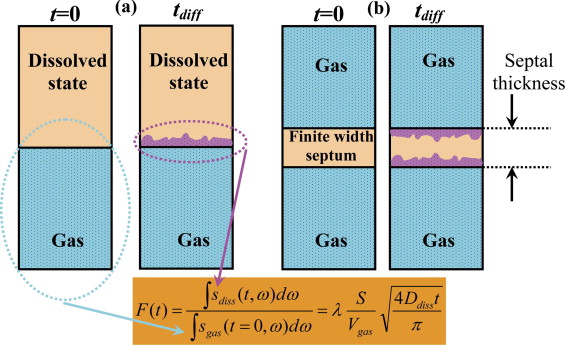
Diffusion of 129 Xe from Alveolar Gas Spaces to Septal Tissue
Get Radiology Tree app to read full this article<
F(t)=∫sdiss(t,ω)dω∫sgas(t=0,ω)dω=λSVgas4Ddisstπ−−−−−√. F
(
t
)
=
∫
s
d
i
s
s
(
t
,
ω
)
d
ω
∫
s
g
a
s
(
t
=
0
,
ω
)
d
ω
=
λ
S
V
g
a
s
4
D
d
i
s
s
t
π
.
Get Radiology Tree app to read full this article<
Get Radiology Tree app to read full this article<
Results
Human Multislice Ventilation Maps
Get Radiology Tree app to read full this article<
Get Radiology Tree app to read full this article<
T 2 \* and T 2 of Gaseous 129 Xe in a Healthy Lung at 0.2T
Get Radiology Tree app to read full this article<
Get Radiology Tree app to read full this article<
1T∗2,meas=1T2+1T∗2,shim+1T∗2,lung. 1
T
2
,
m
e
a
s
*
=
1
T
2
+
1
T
2
,
s
h
i
m
*
+
1
T
2
,
l
u
n
g
*
.
Get Radiology Tree app to read full this article<
Get Radiology Tree app to read full this article<
1T∗2,meas=1T2+πΔυprotonfxenonfproton+1T∗2,lung. 1
T
2
,
m
e
a
s
*
=
1
T
2
+
π
Δ
υ
p
r
o
t
o
n
f
x
e
n
o
n
f
p
r
o
t
o
n
+
1
T
2
,
l
u
n
g
*
.
Get Radiology Tree app to read full this article<
Get Radiology Tree app to read full this article<
1T∗2=1T2+1T∗2,lung≡1T∗2,meas−1T∗2,shim 1
T
2
*
=
1
T
2
+
1
T
2
,
l
u
n
g
*
≡
1
T
2
,
m
e
a
s
*
−
1
T
2
,
s
h
i
m
*
and represents the T 2 * associated with a relaxation rate that would be measured in the absence of B o inhomogeneities with a gradient echo sequence. Thus, using Equation 4 , we find that T 2 * = 135 ± 29 ms.
Get Radiology Tree app to read full this article<
Get Radiology Tree app to read full this article<
CSSR Results
Get Radiology Tree app to read full this article<
F(t)=F0+λSAVgas4Ddisstπ−−−−−√=F0+Kt√ F
(
t
)
=
F
0
+
λ
S
A
V
g
a
s
4
D
d
i
s
s
t
π
=
F
0
+
K
t
where the slope K=λSAVgas4Ddiss/π−−−−−−−√ K
=
λ
S
A
V
g
a
s
4
D
d
i
s
s
/
π . Table 1 lists the age, gender, RV, and TLC for each of the four subjects studied here. ( Table 2 ) lists the values for the least-squares fit values for K and F 0 to Equation 5 . Using the fitted values of K , S A / V gas was also computed using a literature value for λ = 0.1 ( ) and a literature estimate of D diss ∼3 × 10 −6 cm 2 /sec ( ). The data are fairly well fit by Equation 5 because the values for the coefficient of determination, R 2 , are all greater than 0.8 and the majority, 14 of 18, have R 2 ≥ 0.9. The average error bar for K is 13.8%. If λ and D diss were known exactly, then the relative error for K and S A / V gas are identical. We must assume, however, that there may be some uncertainty in the literature values for λ and D diss . Because there are no data near a diffusion time t = 0, the percentage uncertainty in F 0 is significantly larger than that found for K . For two experiments, negative values were found for F 0 . Because this is physically impossible, for these two cases, the fit was redone with F 0 forced to 0.
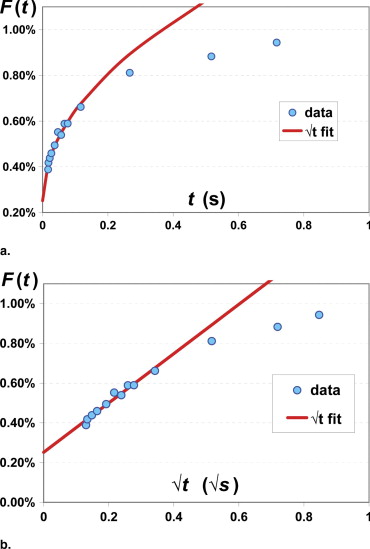
Table 1
Subject Data
Subject Age Gender RV (L) Total Lung Capacity (L) 4 55 M 1.85 7.02 6 32 M 1.33 6.2 13 32 M 2.10 8.24 20 28 F 1.25 4.44
RV, residual volume.
Table 2
CSSR Results
Subject_V lung_ / TLC__N__R 2 K (s –1/2 )K (% error)S A / V gas (cm –1 )F 0 F 0 ±error 4 0.26 8 0.999 0.03902 1.42 199.7 0.00251 0.000131 4 0.26 8 0.866 0.02889 22.74 147.8 0.00614 0.001544 4 0.46 8 0.993 0.03255 4.27 176.4 0 \* N/A 4 0.46 8 0.970 0.02654 10.17 158.7 0.00136 0.000634 4 0.59 8 0.939 0.02099 14.75 132.4 0.00132 0.000727 4 1.00 8 0.998 0.00719 2.76 36.8 0.00066 0.000047 4 1.00 8 0.900 0.00493 19.20 25.2 0.00133 0.000222 6 0.21 8 0.940 0.08469 17.86 433.3 0.00084 0.002996 6 0.21 8 0.806 0.03640 28.33 186.2 0.00772 0.002423 6 0.44 8 0.925 0.01242 16.42 63.5 0.00189 0.000479 6 1.00 8 0.922 0.00857 16.75 43.8 0.00024 0.000337 6 1.00 8 0.847 0.01187 24.57 60.7 0.00033 0.000685 13 0.25 8 0.968 0.05339 10.48 273.2 0.00902 0.001314 13 0.25 8 0.984 0.05298 7.43 271.1 0.00766 0.000925 13 1.00 8 0.888 0.00959 20.51 49.1 0.00158 0.000462 13 1.00 8 0.956 0.01383 12.32 70.8 0.00078 0.000400 13 1.00 13 0.935 0.02427 10.76 124.2 0.00173 0.000499 13 1.00 13 0.806 0.01569 18.51 80.3 0.00194 0.000602 20 0.42 13 0.990 0.01918 3.63 98.1 0 \* N/A
Fitting details for CSSR data for each breathhold experiment.
Reported are lung volume normalized to TLC; n : number of diffusion times points measured; R 2 : coefficient of determination; K : slope in Eq 5 , S A / V gas , F 0 , and the errors in their determination.
Note that the error for K is given in percent, whereas for F 0 , it is specified as an absolute number. Note that for two cases (denoted with an asterisk), F 0 has been forced to be zero. This was done because when a least-squares fit was performed with F 0 as an adjustable parameter, negative values were found.
Get Radiology Tree app to read full this article<
Get Radiology Tree app to read full this article<
Get Radiology Tree app to read full this article<
Imaging Xenon Diffusion from Alveolar Gas Spaces to Septal Tissue: Methods and Results
Get Radiology Tree app to read full this article<
Get Radiology Tree app to read full this article<
Get Radiology Tree app to read full this article<
Get Radiology Tree app to read full this article<
Get Radiology Tree app to read full this article<
Initial Comparison of CSSR with SB-XTC
Get Radiology Tree app to read full this article<
Get Radiology Tree app to read full this article<
Discussion
Get Radiology Tree app to read full this article<
Get Radiology Tree app to read full this article<
Get Radiology Tree app to read full this article<
Get Radiology Tree app to read full this article<
Get Radiology Tree app to read full this article<
Get Radiology Tree app to read full this article<
Get Radiology Tree app to read full this article<
Get Radiology Tree app to read full this article<
Acknowledgments
Get Radiology Tree app to read full this article<
Get Radiology Tree app to read full this article<
References
1. Mugler J.P., Driehuys B., Brookeman J.R., et. al.: MR imaging and spectroscopy using hyperpolarized 129 Xe gas: preliminary human results. Magn Reson Med 1997; 37: pp. 809-815.
2. Mugler J.P., Mata J.F., Wang H.T.J., et. al.: Hagspiel. (abstr) Proc 11th Intl Soc Magn Reson Med 2004; 769:
3. Kilian W., Seifert F., Rinneberg H.: Dynamic NMR spectroscopy of hyperpolarized 129 Xe in human brain analyzed by an uptake model. Magn Reson Med 2004; 51: pp. 843-884.
4. Ruppert K., Brookeman J.R., Hagspiel K.D., et. al.: Probing lung physiology with xenon polarization transfer contrast (XTC). Magn Reson Med 2000; 44: pp. 349-357.
5. Ruppert K., Mata J.F., Brookeman J.R., et. al.: Exploring lung function with hyperpolarized 129 Xe nuclear magnetic resonance. Magn Reson Med 2004; 51: pp. 676-687.
6. Driehuys B., Cofer G.P., Pollaro J., et. al.: Imaging alveolar-capillary gas transfer using hyperpolarized 129 Xe MRI. Proc Natl Acad Sci U S A 2006; 103: pp. 18278-18283.
7. Mansson S., Wolber J., Driehuys B., et. al.: Characterization of diffusing capacity and perfusion of the rat lung in a lipopolysaccharide disease model using hyperpolarized 129 Xe. Magn Reson Med 2003; 50: pp. 1170-1179.
8. Butler J.P., Mair R.W., Hoffmann D., et. al.: Measuring surface-area-to-volume ratios in soft porous materials using laser-polarized xenon interphase exchange NMR. J Phys Condens Matter 2002; 14: pp. L297-L304.
9. Cai J., Mata J.F., Ruppert K., et. al.: Characterizing surface-to-volume ratio using hyperpolarized xenon-129 exchange dynamics in a rabbit model. (abstr) Proc 14th Intl Soc Magn Reson Med 2006; 863:
10. Ruset I.C., Ketel S., Hersman F.W.: Optical pumping system design for large production of hyperpolarized. Phys Rev Lett 2006; 96: pp. 1-4.
11. Patz S., Hersman F.W., Muradian I., et. al.: Hyperpolarized 129 Xe MRI: a viable functional lung imaging modality?. Eur J Rad 2007; 64: pp. 334-344.
12. Chen X.J., Moller H.E., Chawla M.S., et. al.: Spatially resolved measurements of hyperpolarized gas properties in the lung in vivo. Magn Reson Med 1999; 42: pp. 729-737.
13. Cutilo A.G.Application of magnetic resonance to the study of the lung.1996.Futura PublishingArmonk, NY:pp. 12.
14. Eger E.L., Larson C.P.: Anaesthetic solubility in blood and tissues. Br J Anaesth 1964; 36: pp. 140-149.
15. Sta M.N., Eckmann D.M.: Model predictions of gas embolism growth and reabsorption during xenon anesthesia. Anesthesiology 2003; 99: pp. 638-645.
16. Patz S., Muradian I., Hrovat M.I., et. al.: Hyperpolarized 129 Xe human gas exchange at 0.2T with XTC. Proc 14th Intl Soc Magn Reson Med 2006; 860:
17. Muradian I., Butler J., Hrovat , et. al.: Human regional pulmonary gas exchange with xenon polarization transfer (XTC). Proc 15th Int Soc Magn Reson Med 2007; 454:
18. West J.B.: Pulmonary physiology and pathophysiology.2001.Lippincott Williams & WilkinsBaltimore
19. Croxton T.L., Weinmann G.G., Senior R.M., et. al.: Clinical research in chronic obstructive pulmonary disease. Am J Resp Crit Care Med 2003; 167: pp. 1142-1149.
20. Brenner D.J., Hall E.J.: Computed tomography—an increasing source of radiation exposure. N Engl J Med 2007; 357: pp. 2277-2284.
21. Albert M.S., Cates G.D., Driehuys B., et. al.: Biological magnetic resonance imaging using laser polarized 129Xe. Nature 1994; 370: pp. 199-201.
22. Parra-Robles J., Cross A.R., Santyr G.E.: Theoretical signal-to-noise ratio and spatial resolution dependence on the magnetic field strength for hyperpolarized noble gas magnetic resonance imaging of human lungs. Med Phys 2005; 32: pp. 221-229.
23. Wolber J., Cherubini A., Dzik-Jurasz A.S.K., et. al.: Spin-lattice relaxation of laser-polarized xenon in human blood. Proc Natl Acad Sci 1999; 96: pp. 3664-3669.
24. Coxon H.O., Rogers R.M., Whittall K.P., et. al.: A quantification of the lung surface area in emphysema using computed tomography. Am J Respir Crit Care Med 1999; 159: pp. 851-856.
25. Gil J., Bachofen H., Gehr P., et. al.: Alveolar volume-surface area relation in air- and saline-filled lungs fixed by vascular perfusion. J Appl Physiol Respir Environ Exercise Physiol 1979; 47: pp. 990-1001.