
Rationale and Objectives
To improve intra- and interobserver variability and enable the use of functional magnetic resonance imaging (MRI) for multicenter, multiobserver studies, we generated a semiautomated segmentation method for hyperpolarized helium-3 ( 3 He) MRI. Therefore the objective of this study was to compare the reproducibility and spatial agreement of manual and semiautomated segmentation of 3 He MRI ventilation defect volume (VDV) and ventilation volume (VV) in subjects with asthma, chronic obstructive pulmonary disease (COPD), and cystic fibrosis (CF).
Materials and Methods
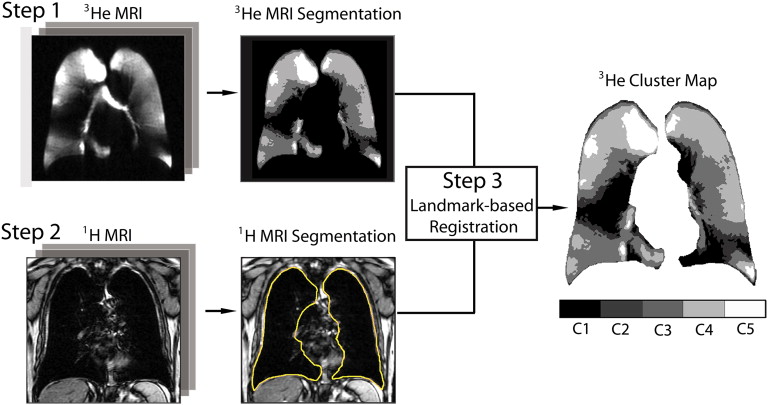
The multistep semiautomated segmentation method we developed employed hierarchical K-means clustering to classify 3 He MRI pixel intensity values into five user-determined clusters ranging from signal void to hyperintense. A seeded region-growing algorithm was also used to segment the 1 H MRI thoracic cavity for coregistration to the 3 He cluster-map, generating VDV and VV.
Results
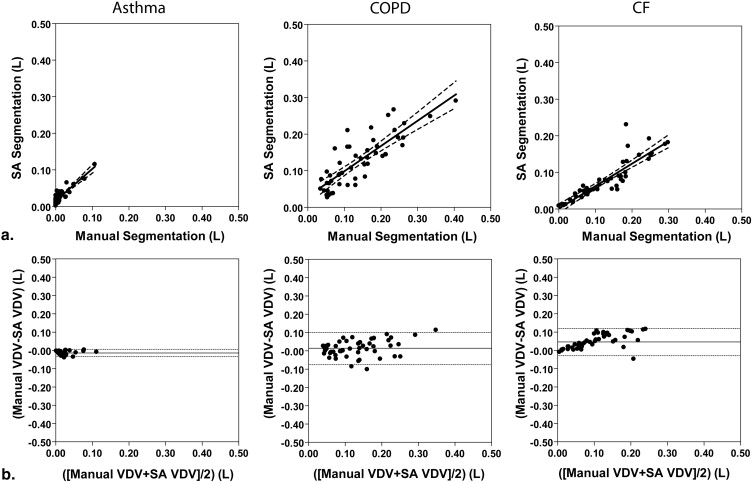
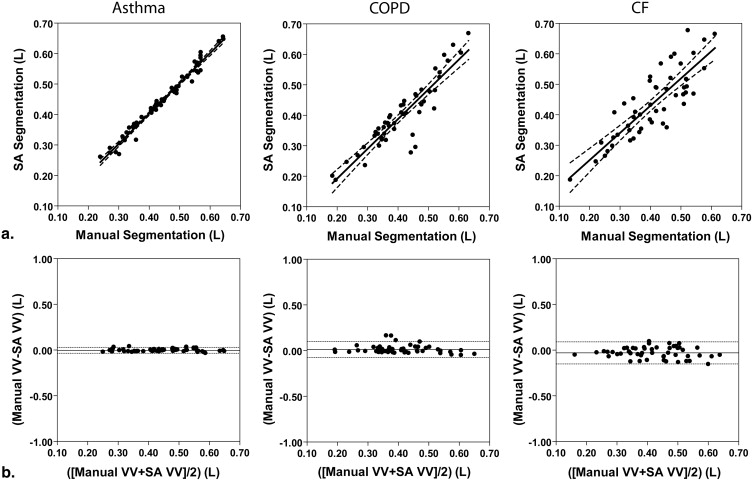
We compared manual segmentation performed by an expert observer and semiautomated measurements of 3 He MRI VDV and observed strong significant correlations between the volumes generated using each method (asthma, n = 5, r = 0.89, P < .0001; COPD, n = 5, r = 0.84, P < .0001; CF, n = 5, r = 0.89, P < .0001). Semiautomated VDV had high interobserver reproducibility (coefficient of variation [CV] = 7%, intraclass correlation coefficient [ICC] = 0.96); intraobserver reproducibility was significantly higher for semiautomated (CV = 5%, ICC = 1.00) compared to manual VDV (CV = 12%, ICC = 0.98). Spatial agreement for VV determined using the Dice coefficient (D) was also high for all disease states (asthma, D = 0.95; COPD, D = 0.88; CF, D = 0.90).
Conclusions
Semiautomated segmentation 3 He MRI provides excellent inter- and intraobserver precision with high spatial and quantitative agreement with manual measurements enabling its use in longitudinal studies.
Pulmonary hyperpolarized helium-3 ( 3 He) magnetic resonance imaging (MRI) is a functional imaging method that detects ventilation abnormalities in elderly never smokers and patients with chronic obstructive pulmonary disease (COPD) , asthma , cystic fibrosis (CF) , radiation-induced lung injury , and lung transplant recipients . Over the past few years, this approach has been enhanced by improvements in laser optical pumping techniques , parallel imaging , single-scan acquisition of ventilation and diffusion-weighted images , single-scan acquisition of ventilation and 1 H MRI anatomical images , and dynamic imaging . Although this large body of work has advanced the scope and type of functional images that can be acquired, there have been fewer improvements related to image analysis methods . As we move forward with functional noble gas imaging and transition to hyperpolarized xenon-129 ( 129 Xe) MRI, a less expensive and more readily available approach, image analysis methods are urgently required for quantitative evaluation across a wide variety of respiratory diseases.
Previous 3 He functional/ventilation analyses were based on a radiologist’s interpretation of the ventilated lung regions , and quantification of ventilation defects was performed using scoring and volumetric analysis approaches . While in these studies, imaging measurements were correlated with well-established measures of disease, a limitation of manual methods is the inherent reliance on highly trained observers that increases segmentation time and introduces the potential for inter- and intraobserver variability. Although straightforward automated threshold methods have been used for segmentation of ventilation , automated segmentation of the 3 He ventilation defects themselves, previously demonstrated by Tustison et al as a feature that differentiated asthma and healthy subject images, has proven to be much more difficult. Subjects with severe obstructive disease, such as COPD or asthma, have numerous ventilation defects that appear in 3 He images as signal voids. Hyperinflation is also commonly observed in obstructive lung disease in part from gas trapping and therefore changes in the thoracic cavity shape vary from patient to patient and within individual patients over time. Thus, segmentation of ventilation defects likely requires an understanding of the relationship between 3 He functional information with the anatomy of the thoracic cavity derived from proton ( 1 H) MRI. Furthermore, because there appear to be regions with 3 He signal voids, as well as regions of hypo- and hyperintensity, segmentation methods are required for the visually different classes of 3 He MRI signal.
Get Radiology Tree app to read full this article<
Materials and methods
Subjects
Get Radiology Tree app to read full this article<
Image Acquisition
Get Radiology Tree app to read full this article<
Get Radiology Tree app to read full this article<
Get Radiology Tree app to read full this article<
Manual Segmentation
Get Radiology Tree app to read full this article<
Semiautomated Segmentation: Overview of Method
Get Radiology Tree app to read full this article<
Get Radiology Tree app to read full this article<
3 He MRI Automated Segmentation: K-means Clustering Algorithm
Get Radiology Tree app to read full this article<
1 H MRI Automated Segmentation: Seeded Region-growing
Get Radiology Tree app to read full this article<
Landmark-based Image Registration
Get Radiology Tree app to read full this article<
Statistical Analysis
Get Radiology Tree app to read full this article<
SDD≥zα2–√SEMintra S
D
D
≥
z
α
2
S
E
M
int
r
a
where zα z
α is 1.96 corresponding to a significance level of α α = .05 and SEMintra S
E
M
int
r
a is the standard error of measurement from intraobserver variability and was calculated as shown in equation 2 :
SEMintra=σˆ2e−−√ S
E
M
int
r
a
=
σ
e
2
where σˆ2e σ
e
2 is the intraobserver repeated measures variance. The Dice coefficient , calculated as the area of the intersection of two datasets divided by the average area of the two sets, was determined to measure the agreement or similarity between each of the five repeated measurements for both manual and semiautomated segmentation (5 repetitions = 10 comparisons) as well as between each of the repeated manual and semiautomated segmentation measurements (5 repetitions for manual and semiautomated = 25 comparisons) as shown in equation 3 :
Dice(A,B)=2|A∩B||A|+|B| D
i
c
e
(
A
,
B
)
=
2
|
A
∩
B
|
|
A
|
+
|
B
|
where A and B are the two data sets. For semiautomated segmentation, two observers performed all measurements and therefore the mean Dice coefficient for the two observers was used. In all statistical analyses, results were considered significant when the probability of making a type I error was less than 5% ( P < .05).
Get Radiology Tree app to read full this article<
Results
Subject Demographics
Get Radiology Tree app to read full this article<
Table 1
Subject Demographics
Parameter All ( n = 15)
(±SD) (range) Asthma ( n = 5)
(±SD) (range) COPD ( n = 5)
(±SD) (range) CF ( n = 5)
(±SD) (range) Age, y 43 (20) (20–77) 36 (13) (20–53) 67 (6) (61–77) 25 (9) (20–41) Male sex 7 3 2 2 BMI kg/m −2 26 (4) (18–30) 27 (3) (21–30) 26 (5) (18–30) 25 (3) (21–29) FEV 1 % pred 69 (23) (31–108) 91 (16) (72–108) 42 (11) (31–61) 74 (4) (69–79) FVC % pred 87 (12) (65–110) 96 (13) (77–110) 78 (11) (65–90) 87 (1) (85–89) FEV 1 /FVC 64 (18) (27–86) 77 (8) (65–86) 41 (9) (27–51) 73 (6) (65–80) TLC % pred 114 (21) (94–175) † 100 (5) (97–108) 129 (27) (106–175) 111 (12) (94–120) ∗ IC % pred 101 (18) (71–138) † 113 (15) (98–138) 86 (11) (71–96) 104 (18) (90–128) ∗ FRC % pred 121 (44) (65–243) † 88 (15) (65–107) 164 (45) (132–243) 109 (23) (88–139) ∗ RV % pred 157 (55) (82–285) † 108 (29) (82–144) 195 (53) (143–285) 172 (42) (109–197) ∗
% pred , percent predicted; BMI, body mass index; FEV 1 , forced expiratory volume in 1 second; FRC, functional residual capacity; FVC, forced vital capacity; IC, inspiratory capacity; SD, standard deviation; TLC, total lung capacity; RV, reserve volume.
Get Radiology Tree app to read full this article<
Get Radiology Tree app to read full this article<
Get Radiology Tree app to read full this article<
Manual and Semiautomated Measurements
Get Radiology Tree app to read full this article<
Get Radiology Tree app to read full this article<
Get Radiology Tree app to read full this article<
Table 2
Manual and Semiautomated 3 He Volume Measurements
Parameter All ( n = 15) Asthma ( n = 5) COPD ( n = 5) CF ( n = 5) Manual VDV L (±SD) 0.92 (0.80) 0.13 (0.15) 1.40 (0.68) 1.23 (0.74) VV L (±SD) 4.19 (0.53) 4.37 (0.34) 4.12 (0.73) 4.08 (0.52) Semiautomated VDV L ∗ (±SD) 0.76 (0.55) 0.26 (0.19) 1.26 (0.45) 0.76 (0.45) VV L ∗ (±SD) 4.26 (0.61) 4.43 (0.83) 3.99 (0.90) 4.37 (1.05) C2 L (±SD) 0.66 (0.17) 0.51 (0.06) 0.80 (0.07) 0.68 (0.20) C3 L (±SD) 1.77 (0.41) 1.64 (0.43) 1.81 (0.35) 1.86 (0.50) C4 L (±SD) 1.27 (0.33) 1.55 (0.17) 0.98 (0.32) 1.28 (0.22) C5 L (±SD) 0.56 (0.20) 0.73 (0.17) 0.41 (0.16) 0.54 (0.13)
C2, cluster 2; C3, cluster 3; C4, cluster 4; C5, cluster 5; SD, standard deviation; VDV, ventilation defect volume; VV, ventilation volume.
Get Radiology Tree app to read full this article<
Get Radiology Tree app to read full this article<
Correlations and Bland-Altman Analysis
Get Radiology Tree app to read full this article<
Get Radiology Tree app to read full this article<
Get Radiology Tree app to read full this article<
Get Radiology Tree app to read full this article<
Reproducibility
Get Radiology Tree app to read full this article<
Table 3
Intraobserver Reproducibility of Manual and Semiautomated 3 He Volume Measurements
Parameter All ( n = 15) Asthma ( n = 5) COPD ( n = 5) CF ( n = 5) Manual VDV CV % (95% CI) 12 (9–19) 9 (5–26) 9 (5–25) 12 (7–36) ICC (95% CI) 0.98 (0.96–0.99) 0.99 (0.98–1.00) 0.97 (0.90–1.00) 0.96 (0.87–1.00) VV CV % (95% CI) 4 (3–7) 2 (1–5) 5 (3–13) 6 (3–16) ICC (95% CI) 0.90 (0.81–0.96) 0.96 (0.85–1.00) 0.94 (0.68–0.99) 0.83 (0.56–0.98) Semiautomated VDV ∗ CV % (95% CI) 5 (4–8) 6 (4–18) 4 (3–13) 4 (2–11) ICC (95% CI) 1.00 (0.99–1.00) 0.99 (0.97–1.00) 0.98 (0.95–1.00) 1.00 (0.98–1.00) VV ∗ CV % (95% CI) 0.2 (0.2–0.4) 0.2 (0.1–0.5) 0.2 (0.0–0.1) 0.4 (0.2–1.1) ICC (95% CI) 1.00 (1.00–1.00) 1.00 (1.00–1.00) 1.00 (1.00–1.00) 1.00 (1.00–1.00) C2 CV % (95% CI) 0.6 (0.5–1) 1 (0.5–2) 0.3 (0.2–1) 1 (0.5–2) ICC (95% CI) 1.00 (1.00–1.00) 0.99 (0.97–1.00) 1.00 (1.00–1.00) 1.00 (1.00–1.00) C3 CV % (95% CI) 0.3 (0.2–0.5) 0.2 (0.1–0.6) 0.2 (0.1–0.3) 0.5 (0.3–1) ICC (95% CI) 1.00 (1.00–1.00) 1.00 (1.00–1.00) 1.00 (0.99–1.00) 1.00 (0.99–1.00) C4 CV % (95% CI) 0.1 (0.1–0.2) 0.1 (0.0–0.2) 0.1 (0.1–0.4) 0.2 (0.1–0.6) ICC (95% CI) 1.00 (1.00–1.00) 1.00 (0.99–1.00) 1.00 (1.00–1.00) 1.00 (0.99–1.00) C5 CV % (95% CI) 0.1 (0.0–0.1) 0.1 (0.0–0.2) 0.0 (0.0–0.1) 0.1 (0.1–0.2) ICC (95% CI) 1.00 (1.00–1.00) 1.00 (1.00–1.00) 1.00 (1.00–1.00) 1.00 (1.00–1.00)
C2, cluster 2; C3, cluster 3; C4, cluster 4; C5, cluster 5; CI, confidence interval; CV, coefficient of variation; ICC, intraclass correlation coefficient; VDV, ventilation defect volume; VV, ventilation volume.
Get Radiology Tree app to read full this article<
Get Radiology Tree app to read full this article<
Get Radiology Tree app to read full this article<
Table 4
Interobserver Reproducibility of Semiautomated 3 He Volume Measurements
Parameter All ( n = 15) Asthma ( n = 5) COPD ( n = 5) CF ( n = 5) VDV ∗ CV % (95% CI) 7 (5–11) 12 (7–37) 6 (4–17) 5 (3–15) ICC (95% CI) 0.96 (0.76–0.99) 0.95 (0.02–1.00) 0.94 (0.43–0.99) 0.97 (0.41–1.00) VV ∗ CV % (95% CI) 0.4 (0.3–0.6) 0.2 (0.1–0.6) 0.2 (0.1–0.7) 0.5 (0.3–1.5) ICC (95% CI) 1.00 (0.83–1.00) 0.99 (0.60–1.00) 1.00 (0.79–1.00) 1.00 (0.85–1.00) C2 CV % (95% CI) 1 (0.6–1) 1 (1–3) 0.5 (0.3–1) 1 (1–3) ICC (95% CI) 0.99 (0.54–1.00) 0.92 (0.03–0.99) 0.98 (0.08–1.00) 0.99 (0.25–1.00) C3 CV % (95% CI) 0.5 (0.3–0.7) 0.3 (0.2–0.9) 0.3 (0.2–0.8) 0.6 (0.4–1.9) ICC (95% CI) 1.00 (0.92–1.00) 1.00 (0.96–1.00) 1.00 (0.78–1.00) 1.00 (0.98–1.00) C4 CV % (95% CI) 0.2 (0.2–0.3) 0.1 (0.1–0.2) 0.2 (0.1–0.6) 0.3 (0.9–0.2) ICC (95% CI) 1.00 (1.00–1.00) 1.00 (1.00–1.00) 1.00 (1.00–1.00) 1.00 (1.00–1.00) C5 CV % (95% CI) 0.1 (0.1–0.2) 0.1 (0.1–0.2) 0.0 (0.0–0.1) 0.1 (0.1–0.4) ICC (95% CI) 1.00 (1.00–1.00) 1.00 (1.00–1.00) 1.00 (1.00–1.00) 1.00 (1.00–1.00)
C2, cluster 2; C3, cluster 3; C4, cluster 4; C5, cluster 5; CI, confidence interval; CV, coefficient of variation; ICC, intraclass correlation coefficient; VDV, ventilation defect volume; VV, ventilation volume.
Get Radiology Tree app to read full this article<
Get Radiology Tree app to read full this article<
Smallest Detectable Difference
Get Radiology Tree app to read full this article<
Table 5
Smallest Detectable Difference for Manual and Semiautomated Segmentation
Parameter All ( n = 15) Asthma ( n = 5) COPD ( n = 5) CF ( n = 5) Manual VDV L (±SD) 0.31 0.03 0.34 0.42 VV L (±SD) 0.48 0.20 0.52 0.63 Semiautomated VDV ∗ L (±SD) 0.11 0.05 0.16 0.08 VV ∗ L (±SD) 0.03 0.02 0.02 0.05 C2 L (±SD) 0.01 0.01 0.01 0.02 C3 L (±SD) 0.02 0.01 0.01 0.02 C4 L (±SD) 0.01 0.00 0.00 0.01 C5 L (±SD) 0.00 0.00 0.00 0.00
C2, cluster 2; C3, cluster 3; C4, cluster 4; C5, cluster 5; VDV, ventilation defect volume; VV, ventilation volume.
Get Radiology Tree app to read full this article<
Get Radiology Tree app to read full this article<
Dice Coefficients
Get Radiology Tree app to read full this article<
Table 6
Dice Coefficients for Manual and Semiautomated Segmentation
Parameter All ( n = 15) Asthma ( n = 5) COPD ( n = 5) CF ( n = 5) Manual–manual VDV 0.71 (0.09) † 0.69 (0.12) – 0.74 (0.05) VV 0.95 (0.03) † 0.97 (0.00) – 0.92 (0.02) Semiautomated–semiautomated VDV ∗ 0.88 (0.06) 0.82 (0.03) 0.92 (0.04) 0.89 (0.06) VV ∗ 1.00 (0.00) 1.00 (0.00) 1.00 (0.00) 1.00 (0.00) Manual–semiautomated VDV 0.44 (0.28) 0.15 (0.15) 0.52 (0.10) † 0.65 (0.25) VV 0.91 (0.05) 0.95 (0.01) 0.88 (0.08) 0.90 (0.03)
C2, cluster 2; C3, cluster 3; C4, cluster 4; C5, cluster 5; CI, confidence interval; CV, coefficient of variation; ICC, intraclass correlation coefficient; VDV, ventilation defect volume; VV, ventilation volume.
Get Radiology Tree app to read full this article<
Get Radiology Tree app to read full this article<
Get Radiology Tree app to read full this article<
Discussion
Get Radiology Tree app to read full this article<
Get Radiology Tree app to read full this article<
Get Radiology Tree app to read full this article<
Get Radiology Tree app to read full this article<
Get Radiology Tree app to read full this article<
Get Radiology Tree app to read full this article<
Appendix
Get Radiology Tree app to read full this article<
Table
Comparison of 3 He VDV and VV Generated by Manual Segmentation with K-Means Clustering with 4 to 10 Clusters and Hierarchical K-Means Using Pearson Correlation Coefficients and Bland-Altman Analysis
Parameter Pearson Correlation Coefficients Bland-Altman Analysis_r__P_ Value Bias Lower CI Upper CI VDV L 4 clusters 0.67 .0001 −0.08 −0.06 0.21 5 clusters 0.79 .0001 −0.04 −0.06 0.14 6 clusters 0.73 .0001 −0.02 −0.09 0.14 7 clusters 0.75 .0001 −0.01 −0.10 0.12 8 clusters 0.80 .0001 −0.004 −0.10 0.09 9 clusters 0.76 .0001 −0.01 −0.12 0.10 10 clusters 0.76 .0001 −0.02 −0.12 0.09 Hierarchical K-means 0.84 .0001 −0.006 −0.10 0.08 VV L 4 clusters 0.80 .0001 −0.09 −0.22 0.03 5 clusters 0.89 .0001 −0.06 −0.15 0.04 6 clusters 0.88 .0001 −0.04 −0.14 0.06 7 clusters 0.89 .0001 −0.03 −0.12 0.07 8 clusters 0.91 .0001 −0.01 −0.11 0.08 9 clusters 0.88 .0001 −0.007 −0.11 0.09 10 clusters 0.88 .0001 −0.001 −0.10 0.10 Hierarchical K-means 0.91 .0001 −0.01 −0.10 0.08
CI, 95% confidence interval; r , Pearson correlation coefficient; VDV, ventilation defect volume; VV, ventilation volume.
Significance ( P < .05).
Get Radiology Tree app to read full this article<
Get Radiology Tree app to read full this article<
References
1. Parraga G., Ouriadov A., Evans A., et. al.: Hyperpolarized 3He ventilation defects and apparent diffusion coefficients in chronic obstructive pulmonary disease: preliminary results at 3.0 Tesla. Invest Radiol 2007; 42: pp. 384-391.
2. de Lange E.E., Mugler J.P., Brookeman J.R., et. al.: Lung air spaces: MR imaging evaluation with hyperpolarized 3He gas. Radiology 1999; 210: pp. 851-857.
3. Kauczor H.U., Ebert M., Kreitner K.F., et. al.: Imaging of the lungs using 3He MRI: preliminary clinical experience in 18 patients with and without lung disease. J Magn Reson Imaging 1997; 7: pp. 538-543.
4. Moller H.E., Chen X.J., Saam B., et. al.: MRI of the lungs using hyperpolarized noble gases. Magn Reson Med 2002; 47: pp. 1029-1051.
5. Kirby M., Mathew L., Wheatley A., et. al.: Chronic obstructive pulmonary disease: longitudinal hyperpolarized (3)He MR imaging. Radiology 2010; 256: pp. 280-289.
6. Choy S., Wheatley A., McCormack D.G., et. al.: Hyperpolarized 3He magnetic resonance imaging derived pulmonary pressure-volume curves. J Appl Physiol 2010; 109: pp. 574-585.
7. Mathew L., Kirby M., Etemad-Rezai R., et. al.: Hyperpolarized (3)He magnetic resonance imaging: preliminary evaluation of phenotyping potential in chronic obstructive pulmonary disease. Eur J Radiol 2011; 79: pp. 140-146.
8. Mathew L., Evans A., Ouriadov A., et. al.: Hyperpolarized 3He magnetic resonance imaging of chronic obstructive pulmonary disease: reproducibility at 3.0 tesla. Acad Radiol 2008; 15: pp. 1298-1311.
9. Evans A., McCormack D.G., Santyr G., et. al.: Mapping and quantifying hyperpolarized 3He magnetic resonance imaging apparent diffusion coefficient gradients. J Appl Physiol 2008; 105: pp. 693-699.
10. de Lange E.E., Altes T.A., Patrie J.T., et. al.: Evaluation of asthma with hyperpolarized helium-3 MRI: correlation with clinical severity and spirometry. Chest 2006; 130: pp. 1055-1062.
11. Altes T.A., Powers P.L., Knight-Scott J., et. al.: Hyperpolarized 3He MR lung ventilation imaging in asthmatics: preliminary findings. J Magn Reson Imaging 2001; 13: pp. 378-384.
12. Fain S.B., Gonzalez-Fernandez G., Peterson E.T., et. al.: Evaluation of structure-function relationships in asthma using multidetector CT and hyperpolarized He-3 MRI. Acad Radiol 2008; 15: pp. 753-762.
13. Tzeng Y.S., Lutchen K., Albert M.: The difference in ventilation heterogeneity between asthmatic and healthy subjects quantified using hyperpolarized 3He MRI. J Appl Physiol 2009; 106: pp. 813-822.
14. Mentore K., Froh D.K., de Lange E.E., et. al.: Hyperpolarized HHe 3 MRI of the lung in cystic fibrosis: assessment at baseline and after bronchodilator and airway clearance treatment. Acad Radiol 2005; 12: pp. 1423-1429.
15. Koumellis P., Van Beek E.J., Woodhouse N., et. al.: Quantitative analysis of regional airways obstruction using dynamic hyperpolarized 3He MRI-preliminary results in children with cystic fibrosis. J Magn Reson Imaging 2005; 22: pp. 420-426.
16. Donnelly L.F., MacFall J.R., McAdams H.P., et. al.: Cystic fibrosis: combined hyperpolarized 3He-enhanced and conventional proton MR imaging in the lung–preliminary observations. Radiology 1999; 212: pp. 885-889.
17. Mathew L., Gaede S., Wheatley A., et. al.: Detection of longitudinal lung structural and functional changes after diagnosis of radiation-induced lung injury using hyperpolarized 3He magnetic resonance imaging. Med Phys 2010; 37: pp. 22-31.
18. Ireland R.H., Bragg C.M., McJury M., et. al.: Feasibility of image registration and intensity-modulated radiotherapy planning with hyperpolarized helium-3 magnetic resonance imaging for non-small-cell lung cancer. Int J Radiat Oncol Biol Phys 2007; 68: pp. 273-281.
19. Zaporozhan J., Ley S., Gast K.K., et. al.: Functional analysis in single-lung transplant recipients: a comparative study of high-resolution CT, 3He-MRI, and pulmonary function tests. Chest 2004; 125: pp. 173-181.
20. McAdams H.P., Palmer S.M., Donnelly L.F., et. al.: Hyperpolarized 3He-enhanced MR imaging of lung transplant recipients: preliminary results. AJR Am J Roentgenol 1999; 173: pp. 955-959.
21. Wild J.M., Schmiedeskamp J., Paley M.N.J., et. al.: MR imaging of the lungs with hyperpolarized helium-3 gas transported by air. Phys Med Biol 2002; 47: pp. N185-N190.
22. Teh K., Lee K.J., Paley M.N.J., et. al.: Parallel imaging of hyperpolarized helium-3 with simultaneous slice excitation. Magn Reson Med 2006; 55: pp. 258-262.
23. Wild J.M., Woodhouse N., Teh K.: Single-scan acquisition of registered hyperpolarized He-3 ventilation and ADC images using a hybrid 2D gradient-echo sequence. Magn Reson Med 2007; 57: pp. 1185-1189.
24. Wild J.M., Ajraoui S., Deppe M.H., et. al.: Synchronous acquisition of hyperpolarised (3) He and (1) H MR images of the lungs—maximising mutual anatomical and functional information 1. NMR Biomed 2011; 24: pp. 130-134.
25. Salerno M., Altes T.A., Brookeman J.R., et. al.: Dynamic spiral MRI of pulmonary gas flow using hyperpolarized (3)He: preliminary studies in healthy and diseased lungs. Magn Reson Med 2001; 46: pp. 667-677.
26. Saam B., Yablonskiy D.A., Gierada D.S., et. al.: Rapid imaging of hyperpolarized gas using EPI. Magn Reson Med 1999; 42: pp. 507-514.
27. Woodhouse N., Wild J.M., Paley M.N., et. al.: Combined helium-3/proton magnetic resonance imaging measurement of ventilated lung volumes in smokers compared to never-smokers. J Magn Reson Imaging 2005; 21: pp. 365-369.
28. Tustison N.J., Altes T.A., Song G., et. al.: Feature analysis of hyperpolarized helium-3 pulmonary MRI: a study of asthmatics versus nonasthmatics. Magn Reson Med 2010; 63: pp. 1448-1455.
29. Ray N., Acton S.T., Altes T., et. al.: Merging parametric active contours within homogeneous image regions for MRI-based lung segmentation. IEEE Trans Med Imaging 2003; 22: pp. 189-199.
30. Kauczor H.U., Markstaller K., Puderbach M., et. al.: Volumetry of ventilated airspaces by 3He MRI: preliminary results. Invest Radiol 2001; 36: pp. 110-114.
31. Adams R., Bischof L.: Seeded region growing. IEEE Trans Pattern Anal Machine Intell 1994; 16: pp. 641-647.
32. MacQueen J. Some Methods for Classification and Analysis of Multivariate Observations. Proceedings of 5th Berkeley Symposium on Mathematical Statistics and Probability, University of California Press; 1967. p. 281–297.
33. Cooley B., Acton S., Salerno M., et. al.: Automated scoring of hyperpolarized helium-3 MR lung ventilation images: initial development and validation. Proc Intl Soc Mag Reson Med Honolulu, Hawaii, May 18-25 2002;
34. Guyer R.A., Hellman M.D., Emami K., et. al.: A robust method for estimating regional pulmonary parameters in presence of noise. Acad Radiol 2008; 15: pp. 740-752.
35. Rabe K.F., Hurd S., Anzueto A., et. al.: Global strategy for the diagnosis, management, and prevention of chronic obstructive pulmonary disease: GOLD executive summary. Am J Respir Crit Care Med 2007; 176: pp. 532-555.
36. Walter S.D., Eliasziw M., Donner A.: Sample size and optimal designs for reliability studies. Stat Med 1998; 17: pp. 101-110.
37. Landry A., Spence J.D., Fenster A.: Quantification of carotid plaque volume measurements using 3D ultrasound imaging. Ultrasound Med Biol 2005; 31: pp. 751-762.
38. de Lange E.E., Altes T.A., Patrie J.T., et. al.: The variability of regional airflow obstruction within the lungs of patients with asthma: assessment with hyperpolarized helium-3 magnetic resonance imaging. J Allergy Clin Immunol 2007; 119: pp. 1072-1078.
39. Kirby M, Wheatley A, McCormack DG, et al. Development and application of methods to quantify spatial and temporal hyperpolarized 3He MRI ventilation dynamics: preliminary results in chronic obstructive pulmonary disease. Proc SPIE 2010; 7626:762605.
40. Adams L.B.: Seeded region growing. IEEE Trans Pattern Anal Machine Intell 1994; 16: pp. 641-647.
41. Vangel M.G.: Confidence intervals for a normal coefficient of variation. Am Statistician 1996; 50: pp. 21-26.
42. Eliasziw M., Young S.L., Woodbury M.G., et. al.: Statistical methodology for the concurrent assessment of interrater and intrarater reliability: using goniometric measurements as an example. Phys Ther 1994; 74: pp. 777-788.
43. Dice L.R.: Measures of the amount of ecologic association between species. Ecology 1945; 26: pp. 297-302.
44. Parraga G., Mathew L., Etemad-Rezai R., et. al.: Hyperpolarized 3He magnetic resonance imaging of ventilation defects in healthy elderly volunteers: initial findings at 3.0 Tesla. Acad Radiol 2008; 15: pp. 776-785.