
Rationale and Objectives
We assessed subjects with stage II and stage III chronic obstructive pulmonary disease (COPD) and age-matched healthy volunteers at a single center using 3 He magnetic resonance imaging (MRI) at 3.0 T. Measurements of the 3 He apparent diffusion coefficient (ADC) and center coronal slice 3 He ventilation defect volume (VDV) were examined for same-day and 7-day reproducibility as well as subgroup comparisons.
Materials and Methods
Twenty-four subjects who provided written informed consent (15 males; mean age 67 ±7 years) with stage II ( n = 9), stage III COPD ( n = 7), and age-matched healthy volunteers ( n = 8) were enrolled based on their age and pulmonary function test results. All subjects underwent plethysmography, spirometry, and MRI at 3.0 T. The time frame between scans was 7 ± 2 minutes (same-day rescan) and again 7 ± 2 days later (7-day rescan). 3 He ADC and VDV reproducibility was evaluated using linear regression, intraclass correlation coefficients (ICC) and Lin’s concordance correlation coefficients (CCC).
Results
ADC reproducibility was high for same-day rescan ( r 2 = 0.934) and 7-day rescan ( r 2 = 0.960, ICC and CCC of 0.96 and 0.98, respectively). Same-day rescan VDV reproducibility evaluated using the ICC and CCC (0.97 and 0.98, respectively) as well as linear regression ( r 2 = 0.941) was also high, but VDV 7-day rescan reproducibility was lower and significantly different ( r 2 = 0.576, P < .001, ICC 0.74, CCC 0.75, P < .01).
Conclusions
Hyperpolarized 3 He MRI was well-tolerated in subjects with stage II and stage III COPD. Seven-day repeated scanning was highly reproducible for ADC and moderately reproducible for VDV.
Chronic obstructive pulmonary disease (COPD) is the fourth leading cause of death worldwide and continues to increase in incidence, morbidity and mortality rates, and direct and indirect costs ( ). The increasing prevalence and economic burden related to COPD is motivating the assessment of new ways to provide earlier diagnosis, better patient risk assessment, and improved patient monitoring of disease progression and treatment. Although both pulmonary function tests and high-resolution computed tomography have been well-established as noninvasive diagnostic tools and biomarkers in clinical studies of COPD, some of the limitations of these approaches are driving the development of new imaging tools that are sensitive to disease changes, provide regional information, and have the appropriate specificity and precision for use in clinical research.
Hyperpolarized 3 He magnetic resonance imaging (MRI) has emerged as a radiologic research method for the evaluation of the regional distribution of anatomic and functional lung changes associated with COPD ( ). In particular, the measurement of the 3 He apparent diffusion coefficient (ADC) ( ) has been exploited to probe the lung microstructure in patients with COPD ( ) and in ex vivo explanted lungs ( ). Same-day scanning reproducibility has also been assessed ( ). Increases in ADC are consistent with expected increases in acinar size because of destruction of alveoli accompanying emphysema ( ) have been shown to correlate with histologic measurements of disease ( ) and also have been shown to correlate positively with age ( ). Parenchymal focal ventilation defects in 3 He images also appear to be sensitive to lung ventilation changes that accompany COPD ( ). The 3 He ventilation defect score correlates with both age ( ) and disease status, providing radiologists and respirologists with a new measurement tool for clinical studies of the spatial and temporal changes in the lung that accompany COPD. The percent ventilation volume ( ) as well as ADC measurements ( ) derived from 3 He images have been shown to be altered in otherwise asymptomatic smokers with normal pulmonary function values, suggesting that these measures are sensitive to early lung changes in smokers. Finally, safety and tolerability have been shown to be excellent across a variety of healthy and respiratory compromised patients ( ).
Get Radiology Tree app to read full this article<
Materials and methods
Study Subjects
Get Radiology Tree app to read full this article<
Study Assessments
Get Radiology Tree app to read full this article<
Safety Monitoring and Hyperpolarized 3 He Administration
Get Radiology Tree app to read full this article<
Imaging
Get Radiology Tree app to read full this article<
Get Radiology Tree app to read full this article<
Get Radiology Tree app to read full this article<
Get Radiology Tree app to read full this article<
Image Analysis
Get Radiology Tree app to read full this article<
Get Radiology Tree app to read full this article<
Statistical Analysis
Get Radiology Tree app to read full this article<
N=2(Zα+Zβ)2SD2δ2. N
=
2
(
Z
α
+
Z
β
)
2
S
D
2
δ
2
.
Get Radiology Tree app to read full this article<
Results
Study Subjects
Get Radiology Tree app to read full this article<
Table 1
Subject Demographics
Healthy Volunteers ( n = 8) Stage II COPD ( n = 9) Stage III COPD( n = 7) Age (y) (range) 67 (6) (58–74) 68 (6) (59–74) 67 (8) (52–75) Males 5 4 6 Body mass index (range) 27 (4) (24–35) 28 (5) (21–38) 27 (4) (22–34) FEV 1 % ⁎ 106 (19) 63 (8) 42 (7) FEV 1 /FVC% 77 (5) 54 (11) 38 (10) IC% ⁎ 111 (16) 99 (18) 78 (17) RV% ⁎ 97 (10) 142 (20) 188 (55) FRC% ⁎ 95 (14) 116 (14) 152 (37) TLC% ⁎ 104 (19) 108 (9) 115 (23)
FEV 1 : forced expiratory volume in 1 second; FVC: forced vital capacity; FRC: functional residual capacity; IC: inspiratory capacity; LC: total lung capacity.
Data are presented as mean (± standard deviation).
Get Radiology Tree app to read full this article<
Get Radiology Tree app to read full this article<
Get Radiology Tree app to read full this article<
3 He MRI Measurements
Get Radiology Tree app to read full this article<
![Figure 1, 3 He apparent diffusion coefficient (ADC) maps and center slice ADC results. (i) ADC maps. (ii) Corresponding ADC histograms. (a) Healthy volunteer (male, age 63 years, forced expiratory volume in 1 second [FEV 1 ] = 92% predicted). (b) Stage II chronic obstructive pulmonary disease (COPD) (male, age 72 years, FEV 1 = 62% predicted). (c) Stage III COPD (male, age 52 years, FEV 1 = 49% predicted). (d) Stage III COPD (male, age 72 years, FEV 1 = 49% predicted). (e) Box-and-whisker plots for subject subgroups at scan, same-day rescan, and 7-day rescan.](https://storage.googleapis.com/dl.dentistrykey.com/clinical/Hyperpolarized3HeMagneticResonanceImagingofChronicObstructivePulmonaryDisease/0_1s20S107663320800281X.jpg)
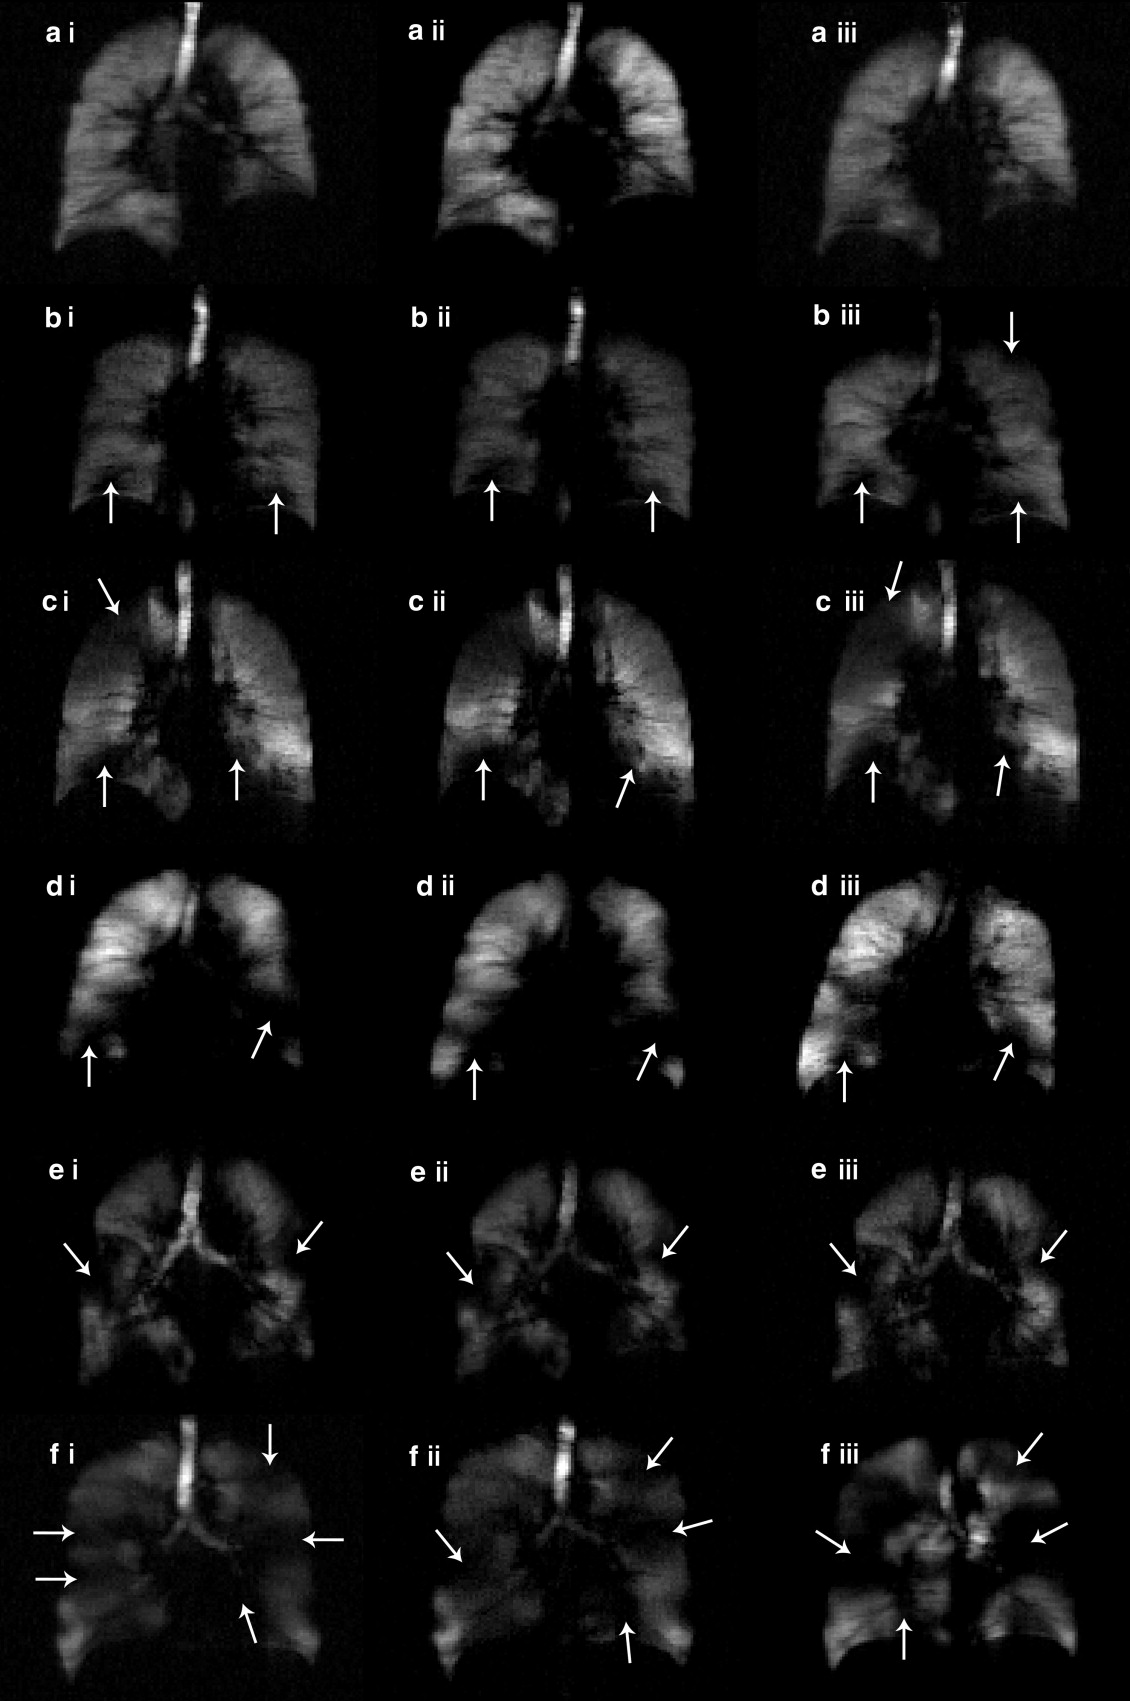
![Figure 2, 3 He magnetic resonance ventilation images and ventilation defect volume (VDV) results. (a) Healthy volunteer (male, age 63 years, forced expiratory volume in 1 second [FEV 1 ] = 92% predicted). (b) Stage II chronic obstructive pulmonary disease (COPD) (male, age 72 years, FEV 1 = 62% predicted. (c) Stage III COPD (male, age 52 years, FEV 1 = 49% predicted). (d) Stage III COPD (male, age 72 years, FEV 1 = 49% predicted). (e) Box-and-whisker plot for mean VDV for subject subgroups at scan, same day rescan, and 7-day rescan.](https://storage.googleapis.com/dl.dentistrykey.com/clinical/Hyperpolarized3HeMagneticResonanceImagingofChronicObstructivePulmonaryDisease/1_1s20S107663320800281X.jpg)
Get Radiology Tree app to read full this article<
Get Radiology Tree app to read full this article<
Table 2
Same Day and 7-day Rescan ADC and VDV Measurements
Healthy Volunteers ( n = 8) Stage II COPD ( n = 9) Stage III COPD ( n = 7) Whole lung mean ADC (±SD) cm 2 /s Scan 0.27 (0.02) 0.38 (0.09) 0.44 (0.09) Same-day rescan 0.26 (0.02) 0.36 (0.09) 0.42 (0.09) ⁎ 7-day rescan 0.26 (0.02) † 0.39 (0.08) ‡ 0.43 (0.09) Whole-lung ADC SD (±SD) cm 2 /s Scan 0.18 (0.03) 0.24 (0.07) 0.24 (0.04) Same-day rescan 0.19 (0.05) 0.22 (0.08) 0.24 (0.04) ⁎ 7-day rescan 0.16 (0.02) † 0.25 (0.08) ‡ 0.24 (0.04) Center slice mean ADC (±SD) cm 2 /s Scan 0.26 (0.02) 0.38 (0.10) 0.47 (0.10) Same-day rescan 0.25 (0.03) 0.36 (0.09) 0.46 (0.11) ⁎ 7-day rescan 0.24 (0.02) † 0.39 (0.10) ‡ 0.46 (0.10) Center slice ADC SD (±SD) cm 2 /s Scan 0.15 (0.03) 0.19 (0.06) 0.26 (0.07) Same-day rescan 0.14 (0.04) 0.15 (0.03) 0.24 (0.06) ⁎ 7-day rescan 0.12 (0.03) † 0.19 (0.04) ‡ 0.29 (0.15) Center slice ventilation defect volume (±SD) cm 3 Scan 80 (30) 70 (40) 220 (160) Same-day rescan 70 (30) 80 (50) 220 (150) ⁎ 7-day rescan 70 (30) † 110 (70) ‡ 220 (110)
ADC: apparent diffusion coefficient; COPD: chronic obstructive pulmonary disease; SD: standard deviation; VDV: ventilation defect volume.
Get Radiology Tree app to read full this article<
Get Radiology Tree app to read full this article<
Get Radiology Tree app to read full this article<
Get Radiology Tree app to read full this article<
3 He Measurement Reproducibility
Get Radiology Tree app to read full this article<
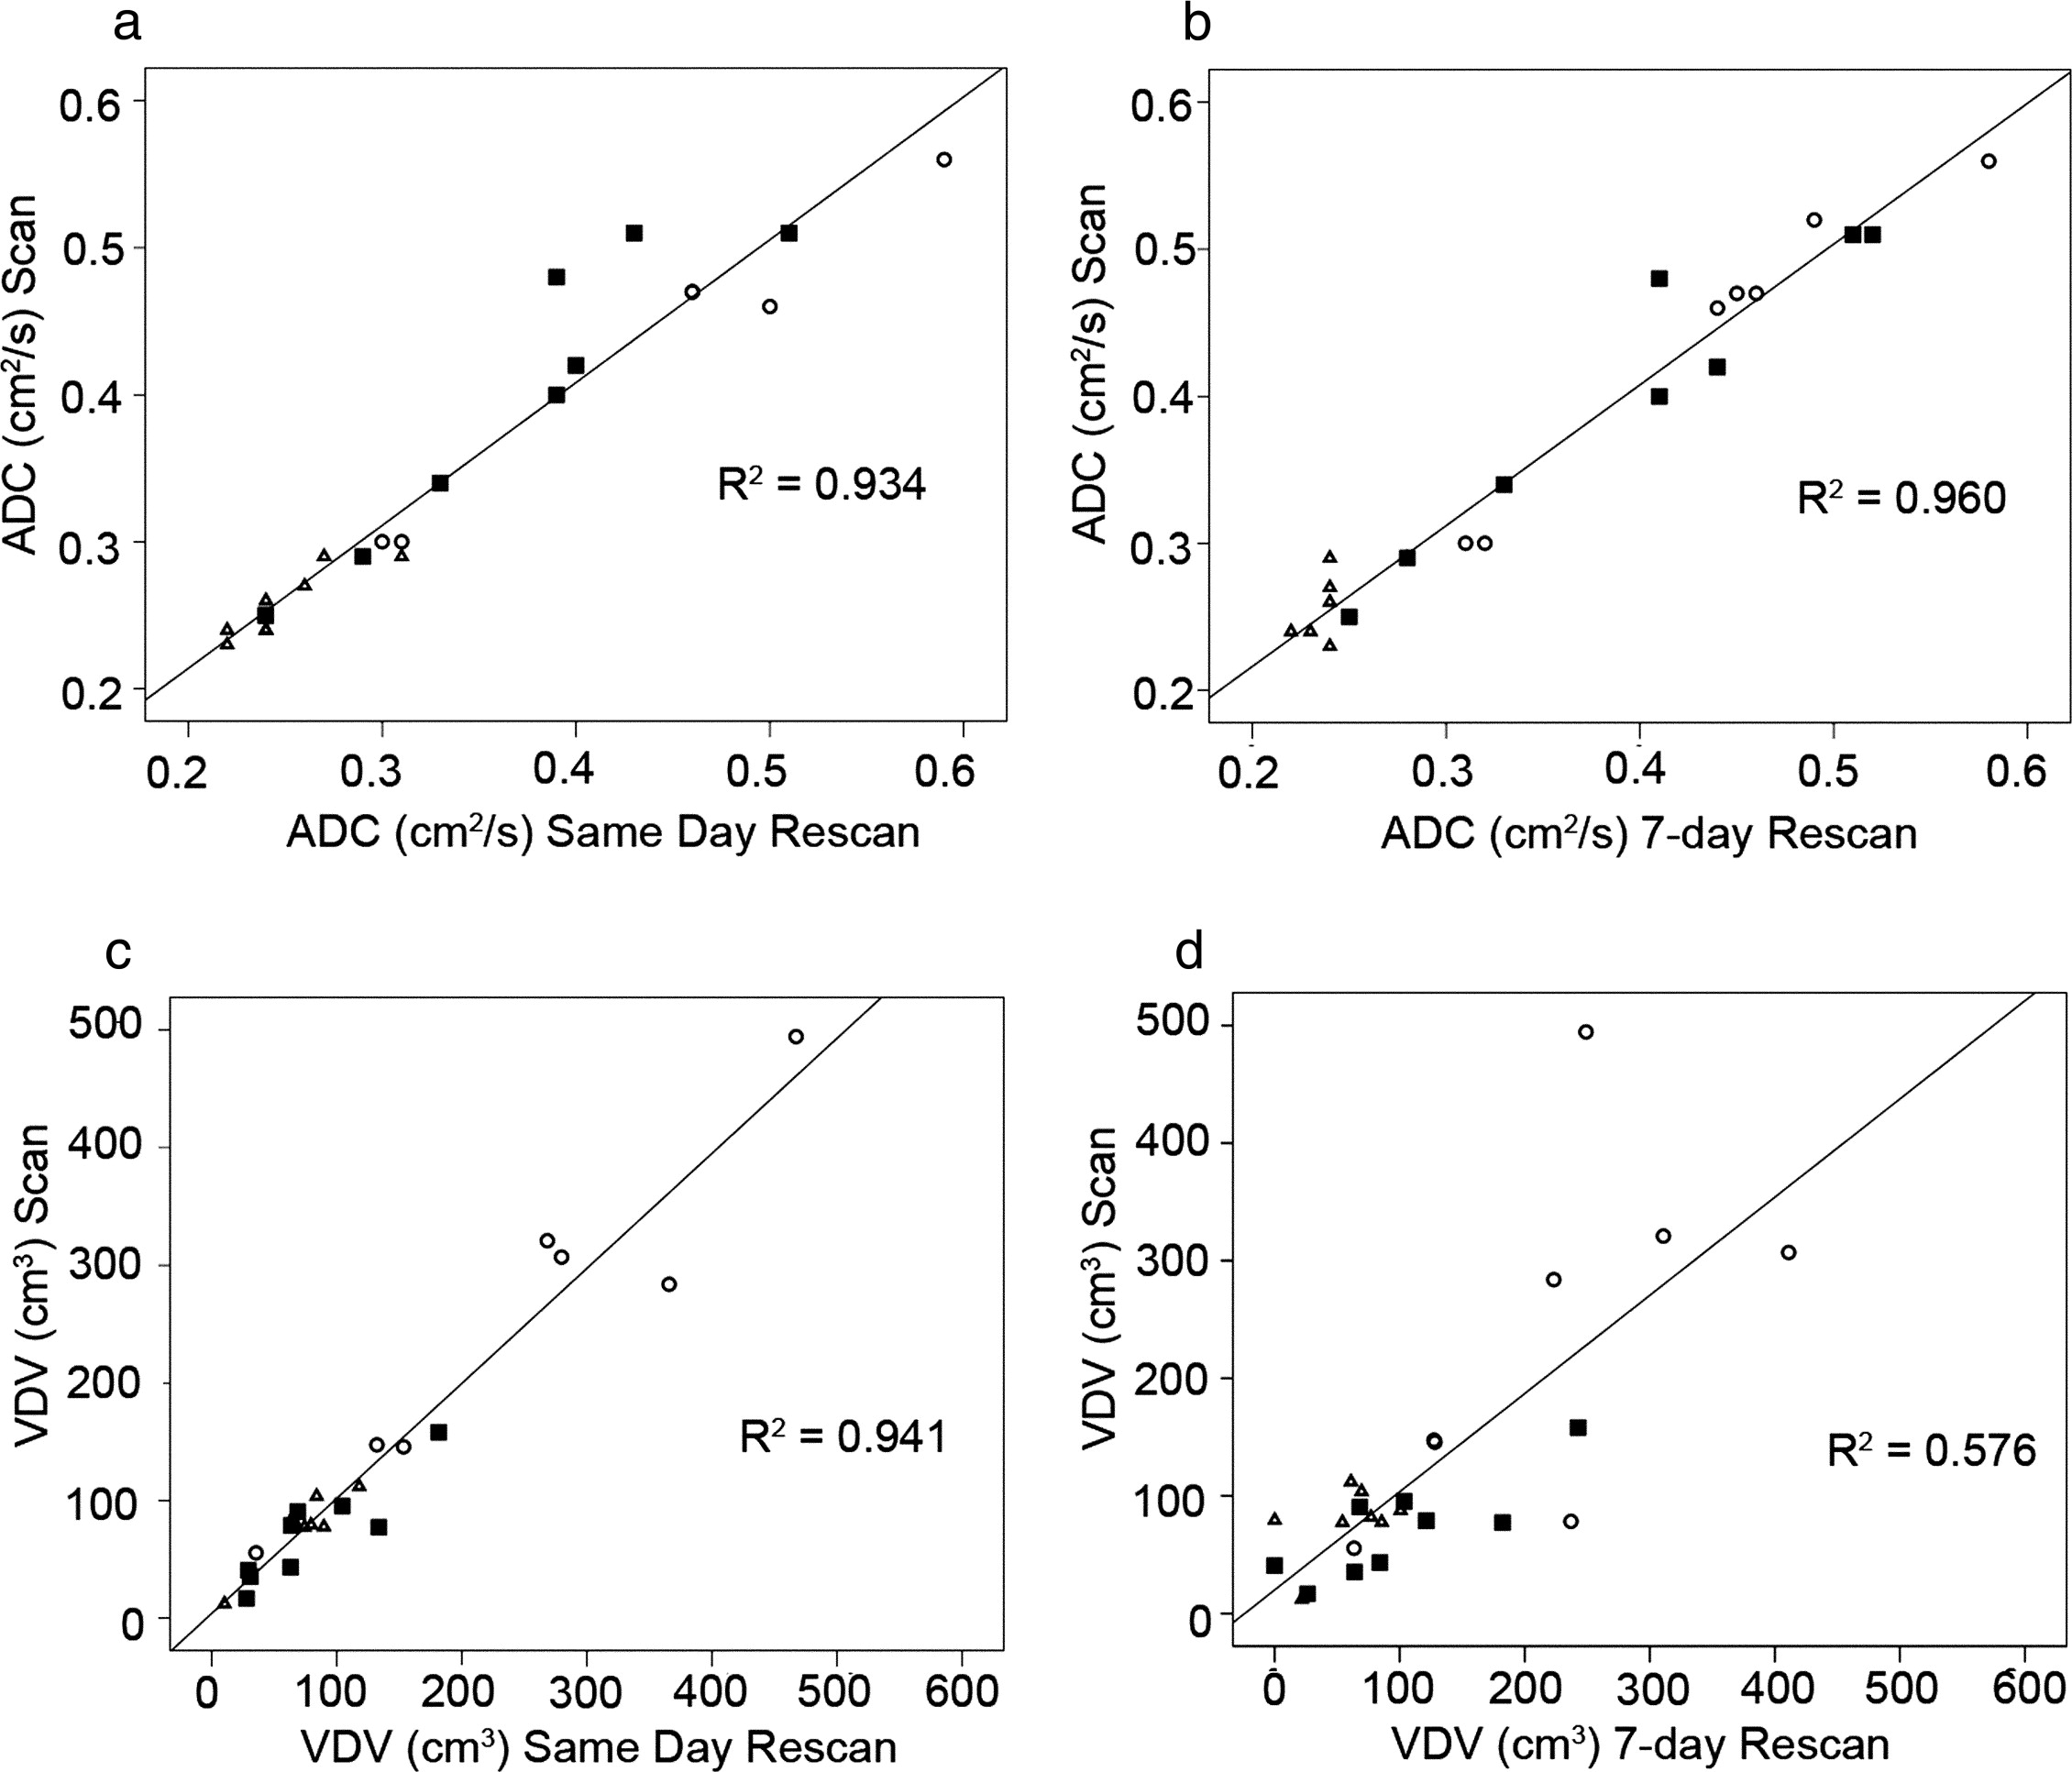
Table 3
Scan–Rescan Reproducibility
Healthy Volunteers ( n = 8) Stage II COPD ( n = 9) Stage III COPD ( n = 7) All Subjects ( n = 24) ICC CCC ICC CCC ICC CCC ICC CCC Center slice mean ADC (cm 2 /s) Same-day rescan 0.83 0.85 0.91 0.91 0.98 0.93 0.96 0.96 7-day rescan 0.17 0.24 0.97 0.96 0.99 0.98 0.98 0.98 Center slice VDV (cm 3 ) Same-day rescan 0.91 0.90 0.94 0.94 0.96 0.96 0.97 0.98 7-day rescan 0.56 0.57 0.59 0.62 0.63 0.58 0.74 0.75 FEV 1 (% predicted) Same-day spirometry 0.98 0.98 0.97 0.97 0.94 0.94 0.99 0.99 7-day spirometry 0.99 0.99 0.94 0.94 0.97 0.96 0.99 0.99
ADC: apparent diffusion coefficient; CCC: Lin’s concordance correlation coefficient; COPD: chronic obstructive pulmonary disease; FEV 1 : forced expiratory volume in 1 second; ICC: intraclass correlation coefficient; VDV: ventilation defect volume.
Get Radiology Tree app to read full this article<
Get Radiology Tree app to read full this article<
Get Radiology Tree app to read full this article<
Get Radiology Tree app to read full this article<
Get Radiology Tree app to read full this article<
Table 4
3 He ADC and VDV Sample Size Calculations
Healthy Volunteers ( n = 8) Stage II COPD ( n = 9) Stage III COPD ( n = 7) ADC (center slice) 7-day ( n ) 7 8 7 Mean (BL and 7-day cm 2 /s) 0.25 0.39 0.47 Difference (SD diff ) cm 2 /s 0.02 0.01 0.01 Sample size 1%/5%/10% change (n) 975/39/10 100/4/1 69/3/1 VDV (center slice) 7-day ( n ) 7 8 7 Mean (BL and 7-day) cm 3 73 92 220 SD diff cm 3 17 35 93 Sample size 5%/10% change ( n ) 331/83 882/220 1,089/272
ADC: apparent diffusion coefficient; BL: baseline; COPD: chronic obstructive pulmonary disease; VDV: ventilation defect volume.
Get Radiology Tree app to read full this article<
Discussion
Get Radiology Tree app to read full this article<
Get Radiology Tree app to read full this article<
Get Radiology Tree app to read full this article<
Get Radiology Tree app to read full this article<
Get Radiology Tree app to read full this article<
Get Radiology Tree app to read full this article<
Conclusions
Get Radiology Tree app to read full this article<
Acknowledgment
Get Radiology Tree app to read full this article<
Get Radiology Tree app to read full this article<
Get Radiology Tree app to read full this article<
Get Radiology Tree app to read full this article<
References
1. National Heart Lung and Blood Institute: Chronic obstructive pulmonary disease.2002.Department of Health and Human ServicesBethesda, MD
2. de Lange E.E., Mugler J.P., Brookeman J.R., et. al.: Lung air spaces: MR imaging evaluation with hyperpolarized 3 He gas. Radiology 1999; 210: pp. 851-857.
3. Kauczor H.U., Ebert M., Kreitner K.F., et. al.: Imaging of the lungs using 3 He MRI: preliminary clinical experience in 18 patients with and without lung disease. J Magn Reson Imaging 1997; 7: pp. 538-543.
4. Moller H.E., Chen X.J., Saam B., et. al.: MRI of the lungs using hyperpolarized noble gases. Magn Reson Med 2002; 47: pp. 1029-1051.
5. Salerno M., Altes T.A., Brookeman J.R., et. al.: Dynamic spiral MRI of pulmonary gas flow using hyperpolarized (3)He: preliminary studies in healthy and diseased lungs. Magn Reson Med 2001; 46: pp. 667-677.
6. Yablonskiy D.A., Sukstanskii A.L., Leawoods J.C., et. al.: Quantitative in vivo assessment of lung microstructure at the alveolar level with hyperpolarized 3 He diffusion MRI. Proc Natl Acad Sci U S A 2002; 99: pp. 3111-3116.
7. Saam B.T., Yablonskiy D.A., Kodibagkar V.D., et. al.: MR imaging of diffusion of (3)He gas in healthy and diseased lungs. Magn Reson Med 2000; 44: pp. 174-179.
8. Woods J.C., Choong C.K., Yablonskiy D.A., et. al.: Hyperpolarized 3 He diffusion MRI and histology in pulmonary emphysema. Magn Reson Med 2006; 56: pp. 1293-1300.
9. Morbach A.E., Gast K.K., Schmiedeskamp J., et. al.: Diffusion-weighted MRI of the lung with hyperpolarized helium-3: a study of reproducibility. J Magn Reson Imaging 2005; 21: pp. 765-774.
10. Salerno M., de Lange E.E., Altes T.A., et. al.: Emphysema: hyperpolarized helium 3 diffusion MR imaging of the lungs compared with spirometric indexes—initial experience. Radiology 2002; 222: pp. 252-260.
11. Woods J.C., Yablonskiy D.A., Choong C.K., et. al.: Long-range diffusion of hyperpolarized 3 He in explanted normal and emphysematous human lungs via magnetization tagging. J Appl Physiol 2005; 99: pp. 1992-1997.
12. Tanoli T.S., Woods J.C., Conradi M.S., et. al.: In vivo lung morphometry with hyperpolarized 3 He diffusion MRI in canines with induced emphysema: disease progression and comparison with computed tomography. J Appl Physiol 2007; 102: pp. 477-484.
13. Fain S.B., Altes T.A., Panth S.R., et. al.: Detection of age-dependent changes in healthy adult lungs with diffusion-weighted 3 He MRI. Acad Radiol 2005; 12: pp. 1385-1393.
14. Parraga G., Ouriadov A., Evans A., et. al.: Hyperpolarized 3 He ventilation defects and apparent diffusion coefficients in chronic obstructive pulmonary disease: preliminary results at 3.0 Tesla. Invest Radiol 2007; 42: pp. 384-391.
15. Swift A.J., Wild J.M., Fichele S., et. al.: Emphysematous changes and normal variation in smokers and COPD patients using diffusion 3 He MRI. Eur J Radiol 2005; 54: pp. 352-358.
16. Fain S.B., Panth S.R., Evans M.D., et. al.: Early emphysematous changes in asymptomatic smokers: detection with 3 He MR imaging. Radiology 2006; 239: pp. 875-883.
17. Choudhri A., Altes T.A., Stay R., et. al.: The occurrence of ventilation defects in the lungs of healthy subjects as demonstrated by hyperpolarized helium-3 MR imaging 2007; 93rd Scientific Assembly and Annual Meeting of the Radiological Society of North America SSA21-05.
18. Woodhouse N., Wild J.M., Paley M.N., et. al.: Combined helium-3/proton magnetic resonance imaging measurement of ventilated lung volumes in smokers compared to never-smokers. J Magn Reson Imaging 2005; 21: pp. 365-369.
19. de Lange E.E., Altes T.A., Wright C.M., et. al.: Hyperpolarized gas MR imaging of the lung: safety assessment of inhaled Helium-3 2003; pp. 525. Proceedings of the 89th Scientific Assembly and Annual Meeting of the Radiological Society of North America, Chicago
20. Woodhouse N., Wild J.M., Mills G.H., et. al.: Comparison of hyperpolarized 3-He administration methods in healthy and diseased subjects 2006; pp. 1288. Proceedings of the 14th Annual Scientific Meeting of the International Society of Magnetic Resonance in Medicine, Seattle
21. Global strategy for the diagnosis, management, and prevention of chronic obstructive pulmonary disease 2003; pp. 2701. NHLBI/WHO Workshop Report Update
22. de Lange E.E., Altes T.A., Patrie J.T., et. al.: The variability of regional airflow obstruction within the lungs of patients with asthma: assessment with hyperpolarized helium-3 magnetic resonance imaging. J Allergy Clin Immunol 2007; 119: pp. 1072-1078.
23. Landry A., Spence J.D., Fenster A.: Measurement of carotid plaque volume by 3-dimensional ultrasound. Stroke 2004; 35: pp. 864-869.
24. Landry A., Fenster A.: Theoretical and experimental quantification of carotid plaque volume measurements made by three-dimensional ultrasound using test phantoms. Med Phys 2002; 29: pp. 2319-2327.
25. Landry A., Spence J.D., Fenster A.: Quantification of carotid plaque volume measurements using 3D ultrasound imaging. Ultrasound Med Biol 2005; 31: pp. 751-762.
26. Lin L.I.: A concordance correlation coefficient to evaluate reproducibility. Biometrics 1989; 45: pp. 255-268.
27. Howell D.C.: Fundamental statistics for the behavioural sciences.2004.Brooks/Cole - Thomas Learning IncBelmont, GA
28. Altes T.A., Gersbach J.C., Mata J.F., et. al.: Evaluation of the safety of hyperpolarized helium-3 gas as an inhaled contrast agent for MRI 2007; Proceedings of the 15th Annual Scientific Meeting of the International Society of Magnetic Resonance in Medicine, Berlin
29. Evans , McCormack D., Ouriadov A., et. al.: Anatomical distribution of 3He apparent diffusion coefficients in severe chronic obstructive pulmonary disease. J Magn Reson Imaging 2007; 26: pp. 1537-1547.
30. Mathew L., McCallum J.M., McKay S., et. al.: 2007; Proceedings of the 15th Annual Scientific Meeting of the International Society for Magnetic Resonance in Medicine, Berlin