
Rationale and Objective
The purpose of this study was to compare image quality and artifacts of 16-detector row CT imaging of the aortic and mitral valve when performing ECG-gated synchronization using relative and absolute reconstructions.
Materials and Methods
Cardiac CT was performed in 22 consecutive patients; 20 data sets per RR interval were reconstructed with relative and absolute reconstructions. Mean and variability of heart rate during data acquisition were noted. Two readers assessed contrast media–related artifacts, calcification-related artifacts, ECG gating–related artifacts, and image quality in parallel and perpendicular planes.
Results
Contrast media–related and calcification-related artifacts similarly occurred with both reconstruction techniques. ECG gating–related artifacts occurred in both valves more often with relative reconstructions than with absolute reconstructions ( p = .001). Image quality was significantly better for absolute reconstructions for the open aortic cusp surface ( p = .014) and edge ( p = .008) in both planes, and of the closed mitral valve leaflets ( p = .003) and apposition zone ( p = .003) in perpendicular planes. Occurrence of ECG gating–related artifacts in both valves significantly correlated ( p = .01) with heart rate variability for relative reconstructions, whereas no correlation was found using the absolute technique.
Conclusion
Absolute reconstructions allow CT imaging of the aortic and mitral valve with fewer artifacts and are less sensitive to heart rate variability as compared to relative reconstructions.
Multidetector row computed tomography (CT) combined with retrospective electrocardiography (ECG) gating allows reconstruction of images of coronary artery and ventricular anatomy with high temporal and spatial resolution at arbitrary phases of the cardiac cycle ( ). Recent studies have demonstrated the feasibility of CT for imaging the normal and diseased mitral ( ) and aortic ( ) valve, indicating CT to be a modality that can evaluate not only coronary arteries and ventricular function but also cardiac valves. In the studies on animated CT imaging of the aortic and mitral valve, one of the main sources of image quality degradation were ECG gating–related artifacts occurring in approximately 50% of the patients ( ). This type of artifact derives from misregistration between the software-detected ECG signal and cardiac motion caused by improper detection of the R wave, sinus arrhythmia during CT data acquisition, bundle blocks, or supraventricular arrhythmias. This type of artefacts affects the temporal synchronization of adjacent parts of the image stack.
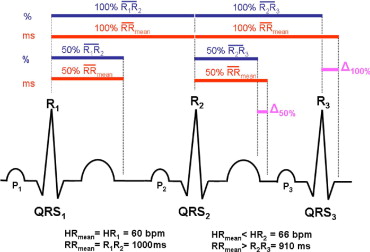
Several algorithms to reconstruct cardiac CT data in relation to the ECG signal are commonly performed ( ). In the most widely used approach, data are reconstructed at a relative delay based on each individual R wave throughout the data acquisition. Another common approach is characterized by data reconstruction at an absolute prospective or reverse delay based on the previous or upcoming R wave, respectively. Interestingly, no data directly comparing the two different reconstruction approaches are currently available to prove the superiority of either reconstruction method for imaging cardiac valves. The purpose of our study was to compare image quality and artifacts of animated CT imaging of the aortic and mitral valve when performing ECG-gated synchronization using the relative and the absolute approach in the same patient population, and to correlate artifacts with the mean heart rate and heart rate variability during data acquisition.
Methods
Patient Population
Get Radiology Tree app to read full this article<
Computed Tomography Scan Protocol
Get Radiology Tree app to read full this article<
Get Radiology Tree app to read full this article<
Image Reconstruction and Data Analysis
Get Radiology Tree app to read full this article<
Get Radiology Tree app to read full this article<
Get Radiology Tree app to read full this article<
Get Radiology Tree app to read full this article<
Get Radiology Tree app to read full this article<
Assessment of Artifacts
Get Radiology Tree app to read full this article<
Get Radiology Tree app to read full this article<
Image Quality of the Aortic and Mitral Valve
Get Radiology Tree app to read full this article<
Radiation Exposure
Get Radiology Tree app to read full this article<
Statistical Analysis
Get Radiology Tree app to read full this article<
Results
Mean Heart Rate and Heart Rate Variability
Get Radiology Tree app to read full this article<
Table 1
Mean Heart Rates, Heart Rate Variability, Minimum and Maximum Heart Rates, and Artifact Scores for Contrast Media Related Artifacts, Calcification Related Artifacts, and ECG Gating Related Artifacts for Relative and Absolute Reconstructions
Patient No. Heart Rate Artifact Level Scores for the Aortic Valve Artifact Level Scores for the Mitral Valve Contrast Media–Related Artifacts Calcification-Related Artifacts ECG Gating–Related Artifacts Contrast Media–Related Artifacts Calcification-Related Artifacts ECG Gating–Related Artifacts Mean SD Minimum Maximum Relative Absolute Relative Absolute Relative Absolute Relative Absolute Relative Absolute Relative Absolute 1 61.10 6.18 50 82 4 4 4 4 3 4 4 4 4 4 2 4 2 77.71 11.73 62 112 4 4 2 2 2 4 4 4 4 4 2 4 3 56.56 10.24 49 96 4 3 2 2 2 4 4 4 4 3 2 4 4 67.64 16.48 52 112 3 3 4 4 2 3 4 4 4 4 2 3 5 59.70 11.46 45 110 3 3 4 4 3 3 4 4 3 4 2 2 6 81.24 5.94 66 90 3 4 2 2 3 4 4 4 4 4 2 3 7 61.58 4.32 51 72 4 4 4 4 3 3 3 4 4 4 3 4 8 64.45 3.43 60 71 4 4 2 2 3 4 4 4 4 4 3 3 9 62.50 0.71 62 64 4 4 3 3 4 4 4 3 4 3 4 4 10 65.76 6.07 56 74 3 4 4 4 2 4 4 4 4 4 4 4 11 58.67 1.63 56 61 4 4 3 2 4 3 4 4 4 4 3 2 12 59.33 3.31 51 65 3 3 4 4 3 4 4 4 4 4 3 3 13 76.07 10.63 49 93 4 4 4 4 2 4 4 4 4 4 2 4 14 66.71 1.55 63 71 4 4 4 4 3 4 4 4 4 4 3 3 15 71.89 2.90 68 77 4 4 2 2 3 4 4 4 4 4 3 4 16 92.60 0.50 92 93 4 4 4 4 4 4 4 4 4 4 4 4 17 70.60 1.90 67 74 4 4 2 2 4 4 4 4 4 4 4 3 18 61.27 3.43 58 69 4 4 4 4 4 3 4 4 4 4 3 2 19 97.94 2.76 95 105 3 3 4 4 4 4 4 3 4 4 3 4 20 91.62 1.50 89 94 4 4 2 2 4 4 4 4 4 4 4 4 21 49.00 4.50 42 56 4 4 4 4 3 4 4 4 4 4 2 3 22 52.13 3.74 48 58 4 4 2 2 3 3 4 4 3 3 3 4 Mean ± SD 68.5 ± 13.0 5.2 ± 4.3 60.5 ± 14.7 81.8 ± 17.9 3.73 ± 0.46 3.77 ± 0.43 3.18 ± 0.96 3.14 ± 0.99 3.09 ± 0.75 ⁎ 3.73 ± 0.46 ⁎ 3.95 ± 0.21 3.91 ± 0.29 3.91 ± 0.29 3.86 ± 0.35 2.86 ± 0.77 ⁎ 3.41 ± 0.73 ⁎ P -values NS NS .001 NS NS .001
Get Radiology Tree app to read full this article<
Get Radiology Tree app to read full this article<
Assessment of Artifacts
Get Radiology Tree app to read full this article<
Get Radiology Tree app to read full this article<
Image Quality of the Aortic and Mitral Valve
Get Radiology Tree app to read full this article<
Table 2
Mean and Standard Deviation of Image Quality Scores for the Aortic Valve Using Relative and Absolute Reconstruction Techniques
Anatomical Landmark Relative Mean Score ± SD Absolute Mean Score ± SD_p_ -Value Aortic valve parallel plane Cusp surface (closed valve) 3.7 ± 0.6 3.6 ± 0.8 .356 Cusp apposition zone (closed valve) 3.7 ± 0.6 3.5 ± 0.7 .157 Cusp surface (transitional) 2.0 ± 0.7 2.0 ± 0.7 .317 Cusp edges (transitional) 2.0 ± 0.7 1.9 ± 0.8 .564 Cusp surface (open valve) 2.9 ± 0.8 ⁎ 3.2 ± 0.8 ⁎ .003 ⁎ Cusp edges (open valve) 2.7 ± 1.0 ⁎ 3.0 ± 1.0 ⁎ .003 ⁎ Aortic valve perpendicular plane Cusp surface (closed valve) 3.5 ± 0.6 3.5 ± 0.6 .317 Cusp apposition zone (closed valve) 3.5 ± 0.7 3.6 ± 0.6 .655 Cusp surface (transitional) 2.1 ± 0.8 2.0 ± 0.8 .564 Cusp edges (transitional) 2.1 ± 0.8 2.0 ± 0.8 .157 Cusp surface (open valve) 2.7 ± 0.7 ⁎ 3.0 ± 0.8 ⁎ .014 ⁎ Cusp edges (open valve) 2.6 ± 0.7 ⁎ 3.0 ± 0.7 ⁎ .008 ⁎
Get Radiology Tree app to read full this article<
Table 3
Mean and Standard Deviation of Image Quality Scores for the Mitral Valve Using Relative and Absolute Reconstruction Techniques
Anatomical Landmark Relative Mean Score ± SD Absolute Mean Score ± SD_p_ -Value Mitral valve parallel plane Tendinous cords (closed valve) 1.4 ± 0.7 1.4 ± 0.7 .365 Commissures (closed valve) 1.3 ± 0.5 1.2 ± 0.4 .374 Leaflets (closed valve) 1.2 ± 0.4 1.1 ± 0.4 .564 Leaflet apposition zone (closed valve) 2.5 ± 0.5 2.5 ± 0.5 .355 Tendinous cords (transitional) 1.1 ± 0.4 1.2 ± 0.5 .317 Commissures (transitional) 1.2 ± 0.4 1.3 ± 0.5 .317 Leaflets (transitional) 1.2 ± 0.6 1.3 ± 0.6 .655 Leaflet edges (transitional) 1.1 ± 0.4 1.1 ± 0.3 .564 Tendinous cords (open valve) 1.2 ± 0.5 1.3 ± 0.6 .364 Commissures (open valve) 1.3 ± 0.5 1.2 ± 0.4 .348 Leaflets (open valve) 2.1 ± 0.5 2.2 ± 0.4 .157 Leaflet edges (open valve) 2.0 ± 0.5 2.1 ± 0.4 .365 Mitral valve perpendicular plane Tendinous cords (closed valve) 1.6 ± 0.8 1.7 ± 0.7 .367 Commissures (closed valve) 3.8 ± 0.4 3.8 ± 0.4 .371 Leaflets (closed valve) 3.7 ± 0.5 ⁎ 4.0 ± 0.5 ⁎ .003 ⁎ Leaflet apposition zone (closed valve) 3.6 ± 0.5 ⁎ 4.0 ± 0.3 ⁎ .003 ⁎ Tendinous cords (transitional) 1.2 ± 0.4 1.3 ± 0.4 .381 Commissures (transitional) 3.6 ± 0.7 3.5 ± 0.6 .398 Leaflets (transitional) 3.1 ± 0.8 3.2 ± 0.8 .317 Leaflet edges (transitional) 3.0 ± 0.8 3.0 ± 0.8 .705 Tendinous cords (open valve) 1.2 ± 0.4 1.3 ± 0.5 .327 Commissures (open valve) 3.8 ± 0.5 3.7 ± 0.4 .157 Leaflets (open valve) 3.8 ± 0.5 3.8 ± 0.5 .364 Leaflet edges (open valve) 3.9 ± 0.4 3.8 ± 0.5 .414
Get Radiology Tree app to read full this article<
Table 4
Number of Cases With Best Image Quality of the Aortic and Mitral Valves in the Corresponding Reconstruction Phases for Absolute and Relative CT Reconstruction Techniques
Valve Opening State MPR Orientation CT Reconstruction Technique No. of Cases With Best Image Quality in the Corresponding No. of Reconstruction (% of RR Interval for Relative Reconstruction) No. 1 (5% RR) No. 2 (10% RR) No. 3 (15% RR) No. 4 (20% RR) … No. 10 (50% RR) No. 11 (55% RR) No. 12 (60% RR) No. 13 (65% RR) No. 14 (70% RR) … No. 20 (100% RR) Aortic Open Perpendicular Absolute 16 3 2 1 Relative 17 3 2 Parallel Absolute 16 2 2 2 Relative 16 4 2 Closed Perpendicular Absolute 1 3 14 3 1 Relative 1 2 15 2 2 Parallel Absolute 2 2 15 1 2 Relative 2 2 14 3 1 Mitral Open Perpendicular Absolute 1 4 5 11 1 Relative 2 3 4 12 1 Parallel Absolute 1 3 5 12 1 Relative 2 2 5 11 2 Closed Perpendicular Absolute 11 6 5 Relative 10 5 5 1 Parallel Absolute 10 6 5 1 Relative 11 5 5 1
Get Radiology Tree app to read full this article<
Radiation Exposure
Get Radiology Tree app to read full this article<
Discussion
Get Radiology Tree app to read full this article<
Get Radiology Tree app to read full this article<
Get Radiology Tree app to read full this article<
Get Radiology Tree app to read full this article<
Get Radiology Tree app to read full this article<
Get Radiology Tree app to read full this article<
Get Radiology Tree app to read full this article<
Get Radiology Tree app to read full this article<
Get Radiology Tree app to read full this article<
Limitations
Get Radiology Tree app to read full this article<
Get Radiology Tree app to read full this article<
Get Radiology Tree app to read full this article<
Get Radiology Tree app to read full this article<
Get Radiology Tree app to read full this article<
Get Radiology Tree app to read full this article<
Conclusion
Get Radiology Tree app to read full this article<
Get Radiology Tree app to read full this article<
References
1. Flohr T., Kuttner A., Bruder H., et. al.: Performance evaluation of a multi-slice CT system with 16-slice detector and increased gantry rotation speed for isotropic submillimeter imaging of the heart. Herz 2003; 28: pp. 7-19.
2. Alkadhi H., Bettex D., Wildermuth S., et. al.: Dynamic cine imaging of the mitral valve with 16-MDCT: A feasibility study. AJR Am J Roentgenol 2005; 185: pp. 636-646.
3. Alkadhi H., Wildermuth S., Bettex D.A., et. al.: Quantification of mitral regurgitation with 16-channel multi-detector row computed tomography. Radiology 2006; 238: pp. 454-463.
4. Messika-Zeitoun D., Serfaty J.M., Laissy J.P., et. al.: Assessment of the mitral valve area in patients with mitral stenosis by multislice computed tomography. J Am Coll Cardiol 2006; 48: pp. 411-413.
5. Baumert B., Plass A., Bettex D., et. al.: Dynamic cine mode imaging of the normal aortic valve using 16-channel multidetector row computed tomography. Invest Radiol 2005; 40: pp. 637-647.
6. Alkadhi H., Wildermuth S., Plass A., et. al.: Aortic stenosis: Comparative evaluation of 16-detector row CT and echocardiography. Radiology 2006; 240: pp. 47-55.
7. Bouvier E., Logeart D., Sablayrolles J.L., et. al.: Diagnosis of aortic valvular stenosis by multislice cardiac computed tomography. Eur Heart J 2006;
8. Feuchtner G.M., Dichtl W., Friedrich G.J., et. al.: Multislice computed tomography for detection of patients with aortic valve stenosis and quantification of severity. J Am Coll Cardiol 2006; 47: pp. 1410-1417.
9. Feuchtner G.M., Dichtl W., Schachner T., et. al.: Diagnostic performance of MDCT for detecting aortic valve regurgitation. AJR Am J Roentgenol 2006; 186: pp. 1676-1681.
10. Cademartiri F., Schuijf J.D., Mollet N.R., et. al.: Multislice CT coronary angiography: How to do it and what is the current clinical performance?. Eur J Nucl Med Mol Imaging 2005; 32: pp. 1337-1347.
11. Mollet N.R., Cademartiri F., de Feyter P.J.: Non-invasive multislice CT coronary imaging. Heart 2005; 91: pp. 401-407.
12. Kalender W.A., Wolf H., Suess C., Gies M., Greess H., Bautz W.A.: Dose reduction in CT by on-line tube current control: Principles and validation on phantoms and cadavers. Eur Radiol 1999; 9: pp. 323-328.
13. Herzog C., Arning-Erb M., Zangos S., et. al.: Multi-detector row CT coronary angiography: Influence of reconstruction technique and heart rate on image quality. Radiology 2006; 238: pp. 75-86.
14. Flohr T., Bruder H., Stierstorfer K., Simon J., Schaller S., Ohnesorge B.: New technical developments in multislice CT, part 2: Sub-millimeter 16-slice scanning and increased gantry rotation speed for cardiac imaging. Rofo Fortschr Geb Rontgenstr Neuen Bildgeb Verfahr 2002; 174: pp. 1022-1027.
15. Kalender W.A., Schmidt B., Zankl M., Schmidt M.: A PC program for estimating organ dose and effective dose values in computed tomography. Eur Radiol 1999; 9: pp. 555-562.
16. Herzog C., Abolmaali N., Balzer J.O., et. al.: Heart-rate-adapted image reconstruction in multidetector-row cardiac CT: Influence of physiological and technical prerequisite on image quality. Eur Radiol 2002; 12: pp. 2670-2678.
17. Sato T., Anno H., Kondo T., et. al.: Applicability of ECG-gated multislice helical CT to patients with atrial fibrillation. Circ Jpn 2005; 69: pp. 1068-1073.
18. Ruhl K.M., Das M., Koos R., et. al.: Variability of aortic valve calcification measurement with multislice spiral computed tomography. Invest Radiol 2006; 41: pp. 370-373.
19. Flohr T.G., McCollough C.H., Bruder H., et. al.: First performance evaluation of a dual-source CT (DSCT) system. Eur Radiol 2006; 16: pp. 256-268.