
Rationale and Objectives
This study aims to determine the optimal photon energy for image quality of the pulmonary arteries (PAs) on dual-energy computed tomography (CT) pulmonary angiography (CTPA) utilizing low volumes of iodinated contrast.
Materials and Methods
The study received institutional review board exemption and was Health Insurance Portability and Accountability Act compliant. Adults ( n = 56) who underwent dual-energy CTPA with 50–60 cc of iodinated contrast on a third-generation dual-source multidetector CT were retrospectively and consecutively identified. Twelve virtual monoenergetic kiloelectron volt (keV) image data sets (40–150 keV, 10-keV increments) were generated with a second-generation noise-reducing algorithm. Standard regions of interest were placed on main, right, left, and right interlobar pulmonary arteries; pectoralis muscle; and extrathoracic air. Attenuation [mean CT number (Hounsfield unit, HU)], noise [standard deviation (HU)], signal to noise (SNR), and contrast to noise ratio were evaluated. Three blinded chest radiologists rated (from 1 to 5, with 5 being the best) randomized monoenergetic and weighted-average images for attenuation and noise. P < .05 was considered significant.
Results
Region of interest mean CT number increased as keV decreased, with 40 keV having the highest value ( P < .001). Mean SNR was highest for 40–60 keV ( P < .05) (14.5–14.7) and was higher ( P < .05) than all remaining energies (90–150 keV) for all vessel regions combined. Contrast to noise ratio was highest for 40 keV ( P < .001) and decreased as keV increased. SNR was highest at 60 and 70 keV, only slightly higher than 40–50 keV ( P < .05). Reader scores for 40–50 keV were greater than other energies and weighted-average images ( P < .05).
Conclusions
Kiloelectron volt images of 40–50 keV from the second-generation algorithm optimize attenuation on dual-energy CTPA and can potentially aid in interpretation and avoiding nondiagnostic examinations.
Introduction
Computed tomography (CT) pulmonary angiography (CTPA) is now the first-line imaging examination for the diagnosis of pulmonary embolism. Although image quality continues to improve over time, suboptimal contrast enhancement of the pulmonary arteries on CTPA occasionally occurs, resulting in difficult image interpretation and nondiagnostic studies.
Dual-energy CT (DECT) imaging generates both low- and high-energy CT data. Dual-energy imaging on a dual-source CT scanner entails two x-ray CT tubes, one using a low and the other a high kilovolt potential (kVp), that image in a simultaneous or near-simultaneous manner . Each of the resulting two x-ray beams are composed of x-ray photons of varying photon energies, expressed in kiloelectron volts (keV), with the highest photon keV approximating that of the kVp used for imaging. Lower-energy photons are more likely to have photoelectric interactions with high atomic number elements such as iodine, given that the energies of these photons are closer to the k-shell electron binding energy of iodine (33 keV). Thus, iodine has more interactions with photons and hence has higher attenuation at lower photon energies than at higher photon energies. Therefore, the concentration of iodine in a region may be inferred from the change in CT numbers between low- and high-energy data. Additionally, virtual monoenergetic images may be synthesized as if an image was acquired using an x-ray beam composed of a single photon energy .
Get Radiology Tree app to read full this article<
Get Radiology Tree app to read full this article<
Materials and Methods
Subjects
Get Radiology Tree app to read full this article<
CT Imaging Protocol
Get Radiology Tree app to read full this article<
Get Radiology Tree app to read full this article<
Dual-energy Data Analysis
Get Radiology Tree app to read full this article<
Quantitative Analysis
Get Radiology Tree app to read full this article<
Qualitative Analysis
Get Radiology Tree app to read full this article<
Get Radiology Tree app to read full this article<
Get Radiology Tree app to read full this article<
Get Radiology Tree app to read full this article<
TABLE 1
Qualitative Assessment Scoring
Score Definition \* Degree of pulmonary artery enhancement (in areas without motion) 1 Poor; no diagnosis of pulmonary embolism possible 2 Only mild opacification 3 Fair; sufficient for diagnosis 4 Good 5 ExcellentPercentage of segmental/subsegmental pulmonary arteries with adequate enhancement (in areas without motion) (%Opac) † 1 No opacification of segmental/subsegmental arteries 2 >0% to ≤25% of segmental/subsegmental arteries are opacified 3 >25 to ≤50% of segmental/subsegmental arteries are opacified 4 >50 to ≤75% of segmental/subsegmental arteries are opacified 5 >75% to 100% of segmental/subsegmental arteries are opacifiedImage noise (as assessed in the worst area) 1 Major noise, rendering nondiagnostic, unable to diagnosis or exclude PE 2 Major noise, so that diagnosis/exclusion of PE possible but with low confidence 3 Moderate noise, but sufficient for diagnosis/exclusion of PE 4 Minor noise, with diagnosis not influenced 5 None perceivable
LPA, left pulmonary artery; MPA, main pulmonary artery; RPA, right pulmonary artery.
Get Radiology Tree app to read full this article<
Get Radiology Tree app to read full this article<
Get Radiology Tree app to read full this article<
Get Radiology Tree app to read full this article<
Statistical Analysis
Quantitative Analysis
Get Radiology Tree app to read full this article<
Get Radiology Tree app to read full this article<
Qualitative Analysis
Get Radiology Tree app to read full this article<
Results
Quantitative Analysis
Get Radiology Tree app to read full this article<
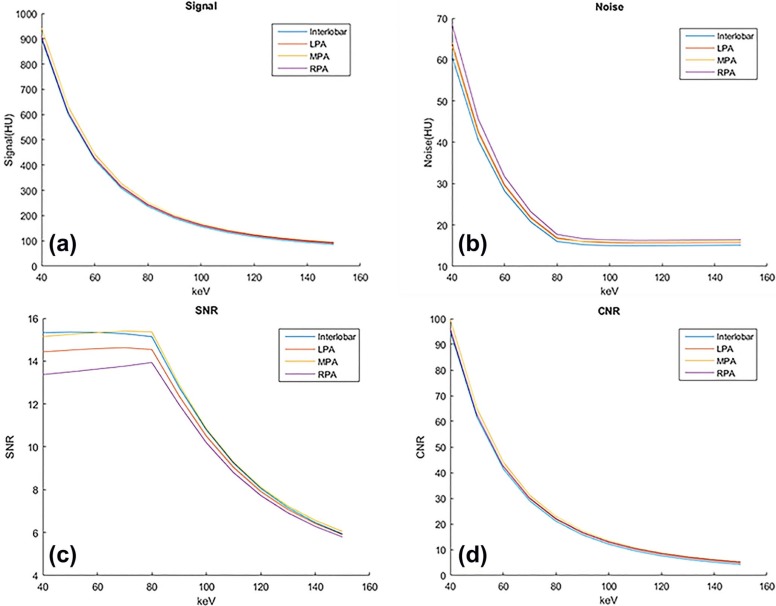
TABLE 2
Mean CT Value And Image Noise, as Expressed by the Standard Deviation of the HU (HUSD) Within an ROI, at Different Photon Energies (keV) for Majorquant (MPA, RPA, LPA) and Allquant (MPA, RPA, LPA, and Interlobar)
Photon Energy (keV) 40 50 60 70 80 90 100 110 120 130 140 150Majorquant Mean HU 920.29 617.32 433.03 319.40 246.56 198.16 164.69 140.88 123.49 110.51 100.63 92.98 HUSD 221.93 146.45 100.58 72.32 54.24 42.26 34.02 28.19 24.97 20.85 18.50 16.70 CI low HU 476.44 324.41 231.88 174.77 138.08 113.64 96.65 84.50 75.55 68.82 63.63 59.58 CI high HU 1364.14 910.23 634.19 464.04 355.03 282.67 232.73 197.25 171.43 152.20 137.62 126.37 HUSD 65.36 43.52 30.31 22.24 17.11 16.23 16.00 15.96 15.98 16.02 16.07 16.12 SD of HUSD 10.90 7.01 4.67 3.24 2.29 2.18 2.25 2.28 2.29 2.30 2.29 2.29 CI low HUSD 43.57 29.49 20.98 15.76 12.54 11.87 11.50 11.39 11.39 11.43 11.49 11.55 CI high HUSD 87.15 57.55 39.65 28.71 21.69 20.60 20.51 20.53 20.57 20.62 20.66 20.70Allquant Mean HU 914.83 613.15 429.65 316.50 243.98 195.81 162.50 138.79 121.48 108.55 98.71 91.09 HUSD 222.29 146.48 100.39 72.01 53.86 41.77 33.48 27.62 23.39 20.27 17.93 16.14 CI low HU 470.26 320.20 228.86 172.47 136.27 112.27 95.54 83.54 74.69 68.00 62.84 58.80 CI high HU 1359.40 906.10 630.44 460.53 351.69 279.35 229.45 194.03 168.26 149.09 134.57 123.38 HUSD 64.22 42.76 29.78 21.86 16.84 15.98 15.76 15.71 15.73 15.78 15.83 15.88 SD of HUSD 9.98 6.39 4.22 2.91 2.06 2.08 2.20 2.25 2.26 2.27 2.26 2.26 CI low HUSD 44.26 29.99 21.34 16.03 12.72 11.83 11.36 11.21 11.21 11.24 11.30 11.37 CI high HUSD 84.19 55.53 38.23 27.69 20.96 20.14 20.16 20.21 20.26 20.31 20.36 20.39
CI, 95% confidence interval; CT, computed tomography; HU, Hounsfield unit; HUSD, standard deviation of HU in ROI (noise); LPA, left pulmonary artery; MPA, main pulmonary artery; ROI, region of interest; RPA, right pulmonary artery; SD, standard deviation.
Majorquant = MPA, RPA, LPA; Allquant = MPA, RPA, LPA and interlobar pulmonary arteries.
Comparison of the mean CT value between two photon energies were significantly different ( P < .001) for all comparisons ( Table S1 ). All comparisons for image noise significantly different up to and for 80 keV ( Table S2 ).
Get Radiology Tree app to read full this article<
Get Radiology Tree app to read full this article<
Get Radiology Tree app to read full this article<
TABLE 3
SNR and CNR at Different Photon Energies (keV) Obtained From ROI Measurements with Comparison of SNR for Photon Energies
Photon Energy (keV) 40 50 60 70 80 90 100 110 120 130 140 150Majorquant Mean SNR 14.32 14.42 14.52 14.60 14.62 12.43 10.52 9.04 7.93 7.08 6.43 5.92 SD of SNR 3.48 3.45 3.41 3.36 3.21 2.73 2.34 2.01 1.76 1.55 1.39 1.27 CI low SNR 7.35 7.51 7.69 7.87 8.19 6.96 5.83 5.02 4.42 3.97 3.64 3.38 CI high SNR 21.29 21.33 21.35 21.33 21.05 17.90 15.20 13.07 11.44 10.18 9.21 8.46 Mean CNR 96.59 63.14 42.72 30.10 22.01 16.62 12.89 10.23 8.28 6.83 5.73 4.88 SD of CNR 53.06 34.70 23.61 16.82 12.50 9.64 7.68 6.29 5.29 4.55 3.99 3.57 CI low CNR −9.54 −6.26 −4.50 −3.54 −2.99 −2.67 −2.48 −2.35 −2.29 −2.26 −2.25 −2.26 CI high CNR 202.72 132.54 89.95 63.74 47.01 35.90 28.25 22.80 18.86 15.92 13.71 12.01Allquant Mean SNR 14.57 14.65 14.73 14.77 14.75 12.51 10.59 9.09 7.96 7.10 6.44 5.92 SD of SNR 3.56 3.51 3.46 3.40 3.25 2.78 2.40 2.06 1.79 1.58 1.42 1.29 CI low SNR 7.46 7.63 7.80 7.97 8.24 6.95 5.79 4.98 4.38 3.94 3.61 3.35 CI high SNR 21.68 21.68 21.65 21.57 21.25 18.08 15.38 13.21 11.54 10.26 9.27 8.50 Mean CNR 97.22 63.63 43.12 30.44 22.32 16.90 13.14 10.47 8.52 7.06 5.96 5.10 SD of CNR 53.27 34.89 23.79 16.99 12.67 9.81 7.85 6.45 5.45 4.71 4.15 3.73 CI low CNR −9.33 −6.15 −4.46 −3.55 −3.03 −2.73 −2.55 −2.44 −2.38 −2.35 −2.35 −2.36 CI high CNR 203.77 133.41 90.71 64.43 47.66 36.52 28.84 23.38 19.42 16.48 14.26 12.55
Comparison of SNR for Majorquant and Allquant ( P values) * Photon Energy (keV) Photon Energy (keV) 40 50 60 70 80 90 100 110 120 130 140 150 40 Majorquant
Allquant<0.001<0.001<0.001 /
0.0040.006/
0.118<0.001<0.001<0.001<0.001<0.001<0.001<0.001 50 Majorquant
Allquant<0.001 /
0.002<0.001 /
0.0170.031 /
0.317<0.001<0.001<0.001<0.001<0.001<0.001<0.001 60 Majorquant
Allquant0.002 /
0.096 0.179/
0.765<0.001<0.001<0.001<0.001<0.001<0.001<0.001 70 Majorquant
Allquant 0.729/
0.724<0.001<0.001<0.001<0.001<0.001<0.001<0.001 80 Majorquant
Allquant<0.001<0.001<0.001<0.001<0.001<0.001<0.001 90 Majorquant
Allquant<0.001<0.001<0.001<0.001<0.001<0.001 100 Majorquant
Allquant<0.001<0.001<0.001<0.001<0.001 110 Majorquant
Allquant<0.001<0.001<0.001<0.001 120 Majorquant
Allquant<0.001<0.001<0.001 130 Majorquant
Allquant<0.001<0.001 140 Majorquant
Allquant<0.001
CI, 95% confidence interval; CNR, contrast to noise ratio; LPA, left pulmonary artery; MPA, main pulmonary artery; RPA, right pulmonary artery; SD, standard deviation; SNR, signal to noise ratio.
Majorquant = MPA, RPA, LPA; Allquant = MPA, RPA, LPA and interlobar pulmonary arteries.
The CNR between two photon energies were significantly different ( P < .001) for all comparisons. When single value in box, the P value is for both groups 1 and 2; when two values in box, the first value is Majorquant and the second value is Allquant. Bold P values indicate statistical significance.
Get Radiology Tree app to read full this article<
Get Radiology Tree app to read full this article<
Qualitative Analysis
Get Radiology Tree app to read full this article<
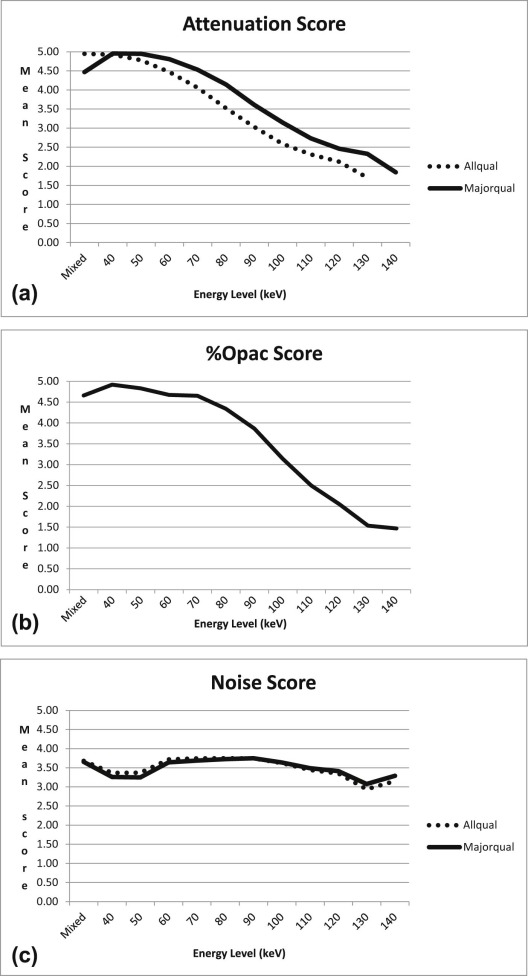
TABLE 4
Qualitative Evaluation of Degree of Vessel Attenuation for Majorqual and Allqual and Percentage of Subsegmental and Segmental Vessels Opacified (%Opac)
Comparison of Reader Attenuation Scores \* (Majorqual, Allqual) † and %Opac ‡ ( P values) § Photon Energy (keV) or WI Photon Energy (keV) or WI WI 40 50 60 70 80 90 100 110 120 130 140 WI Majorqual
Allqual
%Opac<0.001<0.001 /
< 0.001 /
0.169<0.001 /
< 0.001 /
1.000 0.925/
1.000/
1.000<0.001 /
< 0.001 /
0.005<0.001<0.001<0.001<0.001<0.001<0.001 40 Majorqual
Allqual
%Opac 1.000/
1.000/
0.932<0.017 /
< 0.001 /
0.005<0.001<0.001<0.001<0.001<0.001<0.001<0.001<0.001 50 Majorqual
Allqual
%Opac<0.029 /
0.002 /
0.406<0.001 /
<0.001 /
0.110<0.001<0.001<0.001<0.001<0.001<0.001<0.001 60 Majorqual
Allqual
%Opac<0.001 /
<0.001 /
0.100<0.001 /
<0.001 /
0.006<0.001<0.001<0.001<0.001<0.001<0.001 70 Majorqual
Allqual
%Opac<0.001 /
<0.001 /
0.006<0.001<0.001<0.001<0.001<0.001<0.001 80 Majorqual
Allqual
%Opac<0.001 /
<0.001 /
0.002<0.001<0.001<0.001<0.001<0.001 90 Majorqual
Allqual
%Opac<0.001<0.001<0.001<0.001<0.001 100 Majorqual
Allqual
%Opac<0.001 /
<0.001 /
0.003<0.001<0.001<0.001 110 Majorqual
Allqual
%Opac<0.001 /
<0.001 /
0.090<0.001<0.001 120 Majorqual
Allqual
%Opac0.035 /
0.010 /
0.087<0.001 /
<0.001 /
0.008 130 Majorqual
Allqual
%Opac<0.001 /
<0.001 /
1.000
Photon Energy (keV) WI 40 50 60 70 80 90 100 110 120 130 140Majorqual Mean score 4.47 4.95 4.95 4.81 4.53 4.14 3.61 3.15 2.73 2.46 2.33 1.84 SD 0.77 0.27 0.28 0.62 0.77 0.90 0.91 0.82 0.79 0.82 0.49 0.74Allqual Mean score 4.46 4.94 4.92 4.78 4.46 4.05 3.50 3.01 2.56 2.27 2.04 1.63 SD 0.79 0.30 0.38 0.68 0.82 0.93 0.93 0.86 0.85 0.86 0.66 0.72% Opac Mean 4.66 4.92 4.83 4.67 4.65 4.34 3.87 3.14 2.50 2.05 1.53 1.47 SD 0.84 0.41 0.62 0.91 0.86 1.12 1.32 1.53 1.49 1.30 1.07 0.85
CI, 95% confidence interval; LPA, left pulmonary artery; MPA, main pulmonary artery; RPA, right pulmonary artery; SD, standard deviation; WI, weighted-average image.
Get Radiology Tree app to read full this article<
Get Radiology Tree app to read full this article<
Get Radiology Tree app to read full this article<
Get Radiology Tree app to read full this article<
Get Radiology Tree app to read full this article<
Get Radiology Tree app to read full this article<
Get Radiology Tree app to read full this article<
TABLE 5
Comparison of Monoenergy Levels in Terms of Reader-assessed Image Noise Scores for Majorqual and Allqual
Comparison of Reader Image Noise Scores \* for Majorqual, Allqual ( P values) † Photon Energy (keV) or WI Photon Energy (keV) or WI‡ WI 40 50 60 70 80 90 100 110 120 130 140 WI Majorqual
Allqual<0.001<0.001 1.000 1.000/
0.965 0.880/
0.867 0.522/
0.942 1.000/
0.980/0.009 /
< 0.001<0.001<0.001<0.001 40 Majorqual
Allqual 1.000<0.001<0.001<0.001<0.001<0.0010.004 /
0.942 0.280/
1.000 0.241/
< 0.001 1.000/
0.021 50 Majorqual
Allqual<0.001<0.001<0.001<0.001<0.001<0.001 /
0.998 0.100/
0.990 0.271/
< 0.001 0.998/
0.005 60 Majorqual
Allqual 0.995/
1.000 0.712/
0.997 0.301/
1.000 1.000/
0.7200.012/
<0.001<0.001<0.001<0.001 70 Majorqual
Allqual 0.999/
1.000 0.956/
1.000 0.987/
0.235<0.001<0.001<0.001<0.001 80 Majorqual
Allqual 1.000 0.581/
0.111<0.001<0.001<0.001<0.001 90 Majorqual
Allqual 0.187/
0.186<0.001<0.001<0.001<0.001 100 Majorqual
Allqual0.008/
< 0.001<0.001<0.001<0.001 110 Majorqual
Allqual 0.820/
0.574<0.001 0.061/
<0.001 120 Majorqual
Allqual<0.001 0.824/
0.099 130 Majorqual
Allqual 0.183/
0.230
Photon Energy (keV) WI 40 50 60 70 80 90 100 110 120 130 140Majorqual Mean noise score 3.65 3.26 3.25 3.64 3.69 3.73 3.75 3.64 3.49 3.41 3.08 3.29 SD 0.68 0.98 0.90 0.61 0.65 0.55 0.56 0.50 0.53 0.54 0.37 0.56Allqual Mean noise score 3.70 3.38 3.40 3.73 3.76 3.77 3.76 3.64 3.44 3.35 2.92 3.10 SD 0.73 0.99 0.90 0.64 0.69 0.65 0.66 0.69 0.71 0.74 0.61 0.76
CI, 95% confidence interval; LPA, left pulmonary artery; MPA, main pulmonary artery; RPA, right pulmonary artery; SD, standard deviation; WI, weighted-average image.
Majorqual = MPA, RPA, LPA and interlobar pulmonary arteries; Allqual = MPA, RPA, LPA, interlobar, lobar, and segmental pulmonary arteries.
Get Radiology Tree app to read full this article<
Get Radiology Tree app to read full this article<
Get Radiology Tree app to read full this article<
Get Radiology Tree app to read full this article<
Get Radiology Tree app to read full this article<
Get Radiology Tree app to read full this article<
Get Radiology Tree app to read full this article<
Discussion
Get Radiology Tree app to read full this article<
Get Radiology Tree app to read full this article<
Get Radiology Tree app to read full this article<
Get Radiology Tree app to read full this article<
Get Radiology Tree app to read full this article<
Get Radiology Tree app to read full this article<
Conclusions
Get Radiology Tree app to read full this article<
Disclosures
Get Radiology Tree app to read full this article<
Get Radiology Tree app to read full this article<
Supplementary Data
Get Radiology Tree app to read full this article<
Appendix S1
Get Radiology Tree app to read full this article<
Get Radiology Tree app to read full this article<
References
1. Cheng J., Yin Y., Wu H., et. al.: Optimal monochromatic energy levels in spectral CT pulmonary angiography for the evaluation of pulmonary embolism. PLoS ONE 2013; 8: e63140
2. Flohr T.G., Bruder H., Stierstorfer K., et. al.: Image reconstruction and image quality evaluation for a dual source CT scanner. Med Phys 2008; 35: pp. 5882-5897.
3. Flohr T.G., McCollough C.H., Bruder H., et. al.: First performance evaluation of a dual-source CT (DSCT) system. Eur Radiol 2006; 16: pp. 256-268.
4. Apfaltrer P., Sudarski S., Schneider D., et. al.: Value of monoenergetic low-kV dual energy CT datasets for improved image quality of CT pulmonary angiography. Eur J Radiol 2014; 83: pp. 322-328.
5. Godoy M.C., Heller S.L., Naidich D.P., et. al.: Dual-energy MDCT: comparison of pulmonary artery enhancement on dedicated CT pulmonary angiography, routine and low contrast volume studies. Eur J Radiol 2011; 79: pp. e11-e17.
6. Grant K.L., Flohr T.G., Krauss B., et. al.: Assessment of an advanced image-based technique to calculate virtual monoenergetic computed tomographic images from a dual-energy examination to improve contrast-to-noise ratio in examinations using iodinated contrast media. Invest Radiol 2014; 49: pp. 586-592.
7. Weiss J., Notohamiprodjo M., Bongers M., et. al.: Noise-optimized monoenergetic post-processing improves visualization of incidental pulmonary embolism in cancer patients undergoing single-pass dual-energy computed tomography. Radiol Med 2017; 122: pp. 280-287.
8. Weiss J., Notohamiprodjo M., Bongers M., et. al.: Effect of noise-optimized monoenergetic postprocessing on diagnostic accuracy for detecting incidental pulmonary embolism in portal-venous phase dual-energy computed tomography. Invest Radiol 2017; 52: pp. 142-147.
9. Frellesen C., Kaup M., Wichmann J.L., et. al.: Noise-optimized advanced image-based virtual monoenergetic imaging for improved visualization of lung cancer: comparison with traditional virtual monoenergetic imaging. Eur J Radiol 2016; 85: pp. 665-672.
10. Martin S.S., Albrecht M.H., Wichmann J.L., et. al.: Value of a noise-optimized virtual monoenergetic reconstruction technique in dual-energy CT for planning of transcatheter aortic valve replacement. Eur Radiol 2017; 27: pp. 705-714.
11. Meier A., Higashigaito K., Martini K., et. al.: Dual energy CT pulmonary angiography with 6g iodine—a propensity score-matched study. PLoS ONE 2016; 11: e0167214
12. Sandfort V., Palanisamy S., Symons R., et. al.: Optimized energy of spectral CT for infarct imaging: experimental validation with human validation. J Cardiovasc Comput Tomogr 2017; 11: pp. 171-178.
13. Albrecht M.H., Trommer J., Wichmann J.L., et. al.: Comprehensive comparison of virtual monoenergetic and linearly blended reconstruction techniques in third-generation dual-source dual-energy computed tomography angiography of the thorax and abdomen. Invest Radiol 2016; 51: pp. 582-590.
14. Meier A., Wurnig M., Desbiolles L., et. al.: Advanced virtual monoenergetic images: improving the contrast of dual-energy CT pulmonary angiography. Clin Radiol 2015; 70: pp. 1244-1251.
15. Leithner D., Wichmann J.L., Vogl T.J., et. al.: Virtual monoenergetic imaging and iodine perfusion maps improve diagnostic accuracy of dual-energy computed tomography pulmonary angiography with suboptimal contrast attenuation. Invest Radiol 2017; 52: pp. 659-665.
16. Lee J.W., Lee G., Lee N.K., et. al.: Effectiveness of adaptive statistical iterative reconstruction for 64-slice dual-energy computed tomography pulmonary angiography in patients with a reduced iodine load: comparison with standard computed tomography pulmonary angiography. J Comput Assist Tomogr 2016; 40: pp. 777-783.
17. Mourits M.M., Nijhof W.H., van Leuken M.H., et. al.: Reducing contrast medium volume and tube voltage in CT angiography of the pulmonary artery. Clin Radiol 2016; 71: pp. e615-e617. e613
18. Yuan R., Shuman W.P., Earls J.P., et. al.: Reduced iodine load at CT pulmonary angiography with dual-energy monochromatic imaging: comparison with standard CT pulmonary angiography—a prospective randomized trial. Radiology 2012; 262: pp. 290-297.
19. Shrimpton P.C., Hiller M., Lewis M.A., et. al.: National survey: 2003. National survey of doses from CT in the UK. Br J Radiol 2006; 79: pp. 968-980.
20. Jessen K.A., Panzer W., Shrimpton P.C., et. al.: EUR 16262: European Guidelines on quality criteria for computed tomography. Paper presented at the Office for Official Publications of the European Communities, Luxembourg2000.
21. Schueller-Weidekamm C., Schaefer-Prokop C.M., Weber M., et. al.: CT angiography of pulmonary arteries to detect pulmonary embolism: improvement of vascular enhancement with low kilovoltage settings. Radiology 2006; 241: pp. 899-907.