
Rationale and Objectives
The aim of this study was to examine changes of brain iron content and diffusion patterns longitudinally in early-stage Parkinson’s disease (PD) patients using T2- and T2*-based magnetic resonance imaging (MRI) over 2-year follow-up.
Materials and Methods
We imaged 32 PD patients with tremor and 19 healthy controls. A follow-up study (median 25 months, range 22–31 months) was accomplished for 25 patients (men:women = 11:14; age range 44–87 years, median 73 years). All patients and healthy volunteers underwent clinical, neuropsychological, and MRI examinations on the same day. Three different MRI sequences were used and their results were compared: T2-weighted imaging, susceptibility-weighted imaging, and T2* mapping. Additionally, we evaluated diffusion tensor data between groups using tract-based spatial statistics.
Results
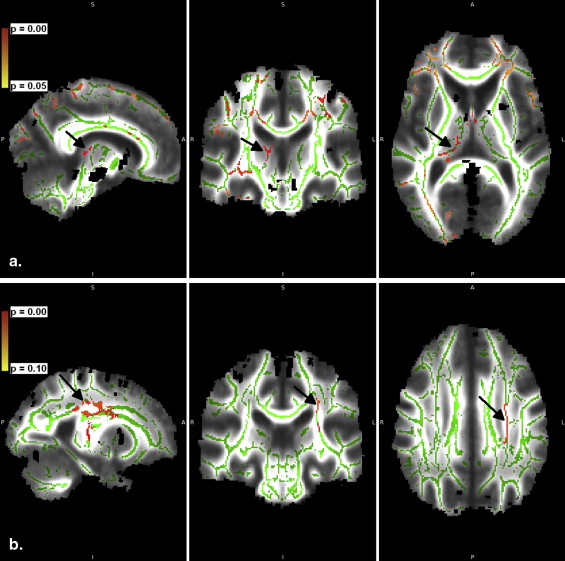
Over the 2-year follow-up, the iron-related relaxation increased in the globus pallidus anterior and the caudate nucleus and slightly in the substantia nigra pars compacta (SNc). In the globus pallidus anterior and medial SNc, the change was associated with mild cognitive impairment. In the caudate nucleus, the increase was pronounced in patients with disease onset at 67 years or older. In the SNc, medial transverse relaxation was increased, and in the thalamus, it was decreased, in patients with PD compared with healthy volunteers at 2-year follow-up. Tract-based spatial statistical data did not differ between groups based on gender or Unified Parkinson’s Disease Rating Scale, but a slight tendency to decreasing fractional anisotropy ( P < .10) in the genu of corpus callosum and bilaterally in corona radiata was seen over 2 years.
Conclusions
PD-related changes were found in putative iron content over 2 years. Although mild in the initial stages, these changes were consistent over MRI sequences. Rather than correlating with disease duration, the rate of changes was associated with individual characters, such as cognitive decline and age.
Parkinson’s disease (PD) is a neurodegenerative disease that is characterized by tremor, rigidity, bradykinesia, and postural instability . These motor symptoms are the basis of the diagnosis. Although the disease is incurable, various treatment options are available to enhance the quality of life, and new neuroprotective agents are constantly being developed . Depending on treatment, early initiation of therapy may provide benefit for the patient . Therefore, early diagnosis and initiation of therapy including follow-up are urgently needed. An accurate diagnosis of PD is challenging and increasingly complemented by imaging .
Imaging findings in PD patients are limited, but slight changes may be found with improving imaging techniques. Imaging of PD patients has made the most progress in the area of imaging dopamine transporters using positron emission tomography and various techniques of magnetic resonance imaging (MRI) . In addition to spectroscopy, diffusion tensor imaging (DTI), and functional imaging, one of the aspects investigated with MRI is the brain iron content, which is increased in the substantia nigra pars compacta (SNc) of PD patients . The brain iron content is associated with the loss of dopamine, and their concentrations seem to correlate as earlier shown in putamen . Therefore, because diagnostically promising results on the loss of dopamine have been reported with positron emission tomography , the results may be indirectly repeated by imaging iron with nonionizing MRI.
Get Radiology Tree app to read full this article<
Get Radiology Tree app to read full this article<
Get Radiology Tree app to read full this article<
Materials and methods
Get Radiology Tree app to read full this article<
Get Radiology Tree app to read full this article<
Get Radiology Tree app to read full this article<
MRI Protocol and Analysis
Get Radiology Tree app to read full this article<
c=(Sa−SgCC)(Sa+SgCC) c
=
(
S
a
−
S
g
C
C
)
(
S
a
+
S
g
C
C
)
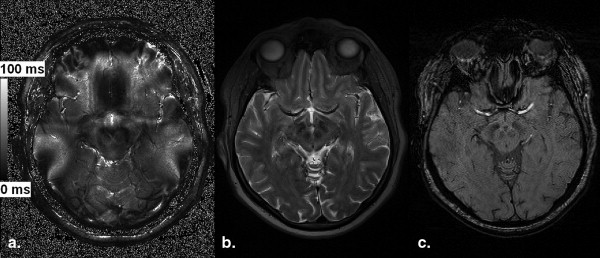
where S a and S gCC are the signal intensities of the concerned structure and gCC, respectively, as previously described in Rossi et al . In T2* mapping, the quantitative T2* (ms) was used. Representative images are shown in Figure 1 .
Table 1
Imaging Parameters
Parameter T2WI SWI MapIt DTI Slice thickness (mm) 3.0 1.5 4.0 3.0 Slice gap (mm) 0 0 0.8 3.9 Field of view 172.5 × 230.0 172.5 × 230.0 220.0 × 220.0 230.0 × 230.0 Acquisition matrix 384 × 290 256 × 182 384 × 384 128 × 128 Interpolated matrix 768 × 768 Repetition time (ms) 3200 27 422 5043 Echo time (ms) 354 20 4.18: 94 11.32: 18.46: 25.60: 32.74
DTI, diffusion tensor imaging; MapIt, multiple echo sequence for T2* measurement; SWI, susceptibility-weighted imaging; T2WI, T2-weighted imaging.
Get Radiology Tree app to read full this article<
Analysis for Iron Content
Get Radiology Tree app to read full this article<
Get Radiology Tree app to read full this article<
TBSS Analysis
Get Radiology Tree app to read full this article<
Statistical Analysis
Get Radiology Tree app to read full this article<
Get Radiology Tree app to read full this article<
Results
Longitudinal MRI Analysis of Iron Content
Get Radiology Tree app to read full this article<
Table 2
P Values for Comparison between the Baseline and 2-Year Follow-up of PD Patients
Region T2WI SWI R2* GP anterior.003 ∗ .127 ∗ .056 ∗ Caudate nucleus .489 ∗ .599 ∗ .081 ∗ SNc lateral .749 ∗ .847 ∗ 1.000 † SNc medial.031 ∗ .322 ∗ .943 † Cerebral peduncle .073 † 1.000 † .095 †
GP, globus pallidus; PD, Parkinson’s disease; SNc, substantia nigra compacta; SWI, susceptibility-weighted imaging; T2WI, T2-weighted imaging.
Student’s t -test for paired samples. The values have been corrected for multiple comparisons.
Get Radiology Tree app to read full this article<
Get Radiology Tree app to read full this article<
Get Radiology Tree app to read full this article<
Comparison with Clinical Data
Get Radiology Tree app to read full this article<
Get Radiology Tree app to read full this article<
Get Radiology Tree app to read full this article<
Comparison with Healthy Volunteers
Get Radiology Tree app to read full this article<
TBSS Data
Get Radiology Tree app to read full this article<
Get Radiology Tree app to read full this article<
Get Radiology Tree app to read full this article<
Discussion
Get Radiology Tree app to read full this article<
Get Radiology Tree app to read full this article<
Get Radiology Tree app to read full this article<
Get Radiology Tree app to read full this article<
Conclusion
Get Radiology Tree app to read full this article<
Get Radiology Tree app to read full this article<
References
1. Davie C.A.: A review of Parkinson’s disease. Br Med Bull 2008; 86: pp. 109-127.
2. Hart R.G., Pearce L.A., Ravina B.M., et. al.: Neuroprotection trials in Parkinson’s disease: systematic review. Mov Disord 2009; 24: pp. 647-654.
3. Massano J., Garrett C.: Deep brain stimulation and cognitive decline in Parkinson’s disease: a clinical review. Front Neurol 2012; 3: pp. 66.
4. Olanow C.W., Rascol O., Hauser R., et. al., ADAGIO Study Investigators: A double-blind, delayed-start trial of rasagiline in Parkinson’s disease. N Engl J Med 2009; 361: pp. 1268-1278.
5. Stoessl A.J., Martin W.W., McKeown M.J., et. al.: Advances in imaging in Parkinson’s disease. Lancet Neurol 2011; 10: pp. 987-1001.
6. Mascalchi M., Vella A., Ceravolo R.: Movement disorders: role of imaging in diagnosis. J Magn Reson Imaging 2012; 35: pp. 239-256.
7. Martin W.R.: Quantitative estimation of regional brain iron with magnetic resonance imaging. Parkinsonism Relat Disord 2009; 15: pp. 215-218.
8. Martin W.R., Wieler M., Gee M.: Midbrain iron content in early Parkinson disease: a potential biomarker of disease status. Neurology 2008; 70: pp. 1411-1417.
9. Dexter D.T., Carayon A., Javoy-Agid F., et. al.: Alterations in the levels of iron, ferritin and other trace metals in Parkinson’s disease and other neurodegenerative diseases affecting the basal ganglia. Brain 1991; 114: pp. 1953-1975.
10. Bartzokis G., Cummings J.L., Markham C.H., et. al.: MRI evaluation of brain iron in earlier- and later-onset Parkinson’s disease and normal subjects. Magn Reson Imaging 1999; 17: pp. 213-222.
11. Du G., Lewis M.M., Styner M., et. al.: Combined R2* and diffusion tensor imaging changes in the substantia nigra in Parkinson’s disease. Mov Disord 2011; 26: pp. 1627-1632.
12. Götz M.E., Double K., Gerlach M., et. al.: The relevance of iron in the pathogenesis of Parkinson’s disease. Ann N Y Acad Sci 2004; 1012: pp. 193-208.
13. Antonini A., Leenders K.L., Meier D., et. al.: T2 relaxation time in patients with Parkinson’s disease. Neurology 1993; 43: pp. 697-700.
14. Graham J.M., Paley M.N., Grünewald R.A., et. al.: Brain iron deposition in Parkinson’s disease imaged using the PRIME magnetic resonance sequence. Brain 2000; 123: pp. 2423-2431.
15. Kosta P., Argyropoulou M.I., Markoula S., et. al.: MRI evaluation of the basal ganglia size and iron content in patients with Parkinson’s disease. J Neurol 2006; 253: pp. 26-32.
16. Xu X., Wang Q., Zhang M.: Age, gender, and hemispheric differences in iron deposition in the human brain: an in vivo MRI study. Neuroimage 2008; 40: pp. 35-42.
17. Smith S.M., Jenkinson M., Woolrich M.W., et. al.: Advances in functional and structural MR image analysis and implementation as FSL. Neuroimage 2004; 23: pp. 208-219.
18. Smith S.M., Jenkinson M., Johansen-Berg H., et. al.: Tract-based spatial statistics: voxelwise analysis of multi-subject diffusion data. Neuroimage 2006; 31: pp. 1487-1505.
19. Smith S.M.: Fast robust automated brain extraction. Hum Brain Mapp 2002; 17: pp. 143-155.
20. Pfefferbaum A., Adalsteinsson E., Rohlfing T., et. al.: Diffusion tensor imaging of deep gray matter brain structures: effects of age and iron concentration. Neurobiol Aging 2010; 31: pp. 482-493.
21. Vaillancourt D.E., Spraker M.B., Prodoehl J., et. al.: High-resolution diffusion tensor imaging in the substantia nigra of de novo Parkinson disease. Neurology 2009; 72: pp. 1378-1384.
22. Karagulle Kendi A.T., Lehericy S., Luciana M., et. al.: Altered diffusion in the frontal lobe in Parkinson disease. AJNR Am J Neuroradiol 2008; 29: pp. 501-505.
23. Litvan I., Goldman J.G., Tröster A.I., et. al.: Diagnostic criteria for mild cognitive impairment in Parkinson’s disease: Movement Disorder Society Task Force guidelines. Mov Disord 2012; 27: pp. 349-356.
24. Lichy M.P., Wietek B.M., Mugler J.P., et. al.: Magnetic resonance imaging of the body trunk using a single-slab, 3-dimensional, T2-weighted turbo-spin-echo sequence with high sampling efficiency (SPACE) for high spatial resolution imaging: initial clinical experiences. Invest Radiol 2005; 40: pp. 754-760.
25. Haacke E.M., Mittal S., Wu Z., et. al.: Susceptibility-weighted imaging: technical aspects and clinical applications, part 1. AJNR Am J Neuroradiol 2009; 30: pp. 19-30.
26. Mittal S., Wu Z., Neelavalli J., et. al.: Susceptibility-weighted imaging: technical aspects and clinical applications, part 2. AJNR Am J Neuroradiol 2009; 30: pp. 232-252.
27. Welsch G.H., Trattnig S., Hughes T., et. al.: T2 and T2* mapping in patients after matrix-associated autologous chondrocyte transplantation: initial results on clinical use with 3.0-Tesla MRI. Eur Radiol 2010; 20: pp. 1515-1523.
28. Welsch G.H., Mamisch T.C., Hughes T., et. al.: In vivo biochemical 7.0 Tesla magnetic resonance: preliminary results of dGEMRIC, zonal T2, and T2* mapping of articular cartilage. Invest Radiol 2008; 43: pp. 619-626.
29. Rossi M., Ruottinen H., Elovaara I., et. al.: Brain iron deposition and sequence characteristics in parkinsonism: comparison of SWI, T2* Maps, T2-weighted- and FLAIR-SPACE. Invest Radiol 2010; 45: pp. 795-802.
30. Rossi M., Ruottinen H., Soimakallio S., et. al.: Clinical MRI for iron detection in Parkinson’s disease. Clin Imaging 2013; 37: pp. 631-636.
31. Hallgren B., Sourander P.: The effect of age on the non-haemin iron in the human brain. J Neurochem 1958; 3: pp. 41-51.
32. Gröger A., Berg D.: Does structural neuroimaging reveal a disturbance of iron metabolism in Parkinson’s disease? Implications from MRI and TCS studies. J Neural Transm 2012; 119: pp. 1523-1528.
33. Ryvlin P., Broussolle E., Piollet H., et. al.: Magnetic resonance imaging evidence of decreased putamenal iron content in idiopathic Parkinson’s disease. Arch Neurol 1995; 52: pp. 583-588.
34. Wallis L.I., Paley M.N., Graham J.M., et. al.: MRI assessment of basal ganglia iron deposition in Parkinson’s disease. J Magn Reson Imaging 2008; 28: pp. 1061-1067.
35. Zhang W., Sun S.G., Jiang Y.H., et. al.: Determination of brain iron content in patients with Parkinson’s disease using magnetic susceptibility imaging. Neurosci Bull 2009; 25: pp. 353-360.
36. Zhang J., Zhang Y., Wang J., et. al.: Characterizing iron deposition in Parkinson’s disease using susceptibility-weighted imaging: an in vivo MR study. Brain Res 2010; 1330: pp. 124-130.
37. Burzynska A.Z., Preuschhof C., Bäckman L., et. al.: Age-related differences in white matter microstructure: region-specific patterns of diffusivity. Neuroimage 2010; 49: pp. 2104-2112.
38. Haller S., Badoud S., Nguyen D., et. al.: Individual detection of patients with Parkinson disease using support vector machine analysis of diffusion tensor imaging data: initial results. AJNR Am J Neuroradiol 2012; 33: pp. 2123-2128.
39. Tessa C., Giannelli M., Della Nave R., et. al.: A whole-brain analysis in de novo Parkinson disease. AJNR Am J Neuroradiol 2008; 29: pp. 674-680.
40. Haacke E.M., Cheng N.Y., House M.J., et. al.: Imaging iron stores in the brain using magnetic resonance imaging. Magn Reson Imaging 2005; 23: pp. 1-25.
41. Deistung A., Schweser F., Wiestler B., et. al.: Quantitative susceptibility mapping differentiates between blood depositions and calcifications in patients with glioblastoma. PLoS One 2013; 8: pp. e57924.
42. Li M., Hu J., Miao Y., et. al.: In vivo measurement of oxygenation changes after stroke using susceptibility weighted imaging filtered phase data. PLoS One 2013; 8: pp. e63013.
43. Haller S., Badoud S., Nguyen D., et. al.: Differentiation between Parkinson disease and other forms of Parkinsonism using support vector machine analysis of susceptibility-weighted imaging (SWI): initial results. Eur Radiol 2013; 23: pp. 12-19.
44. Walsh A.J., Lebel R.M., Eissa A., et. al.: Multiple sclerosis: validation of MR imaging for quantification and detection of iron. Radiology 2013; 267: pp. 531-542.
45. Wood J.C., Enriquez C., Ghugre N., et. al.: MRI R2 and R2* mapping accurately estimates hepatic iron concentration in transfusion-dependent thalassemia and sickle cell disease patients. Blood 2005; 106: pp. 1460-1465.