
Purpose
This study aimed to assess variability in imaging facilities’ adherence to the minimum technical standards for prostate magnetic resonance imaging acquisition established by Prostate Imaging-Reporting and Data System (PI-RADS) version 2 (v2).
Methods
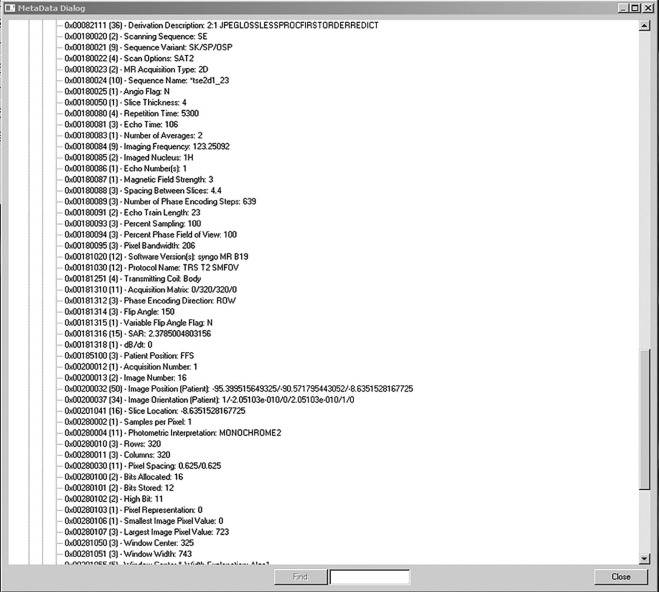
A total of 107 prostate magnetic resonance imaging examinations performed at 107 unique imaging facilities after the release of PI-RADS v2 and that were referred to a tertiary care center for secondary interpretation were included. Image sets, DICOM headers, and outside reports were reviewed to assess adherence to 21 selected PI-RADS v2 minimum technical standards.
Results
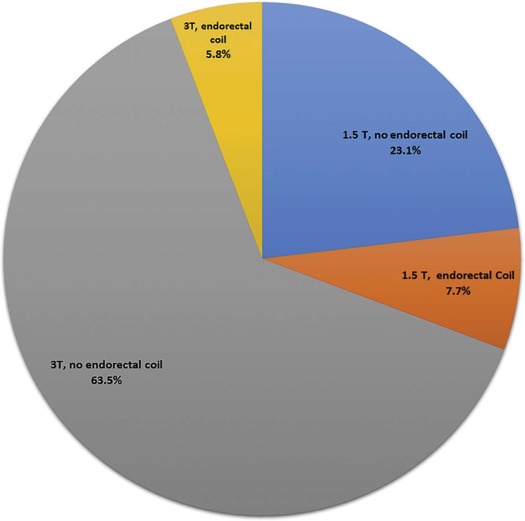
Hardware arrangements were 23.1%, 1.5T without endorectal coil; 7.7%, 1.5T with endorectal coil; 63.5%, 3T without endorectal coil; and 5.8%, 3T with endorectal coil. Adherence to minimum standards was lowest on T2 weighted imaging (T2WI) for frequency resolution ≤0.4 mm (16.8%) and phase resolution ≤0.7 mm (48.6%), lowest on diffusion-weighted imaging (DWI) for field of view (FOV) 120–220 mm (30.0%), and lowest on dynamic contrast-enhanced (DCE) imaging for slice thickness 3 mm (33.3%) and temporal resolution <10 s (31.5%). High b-value (≥1400 s/mm 2 ) images were included in 58.0% (calculated in 25.9%). Adherence to T2WI phase resolution and DWI inter-slice gap were greater ( P < .05) at 3T than at 1.5T. Adherence did not differ ( P > .05) for any parameter between examinations performed with and without an endorectal coil. Adherence was greater for examinations performed at teaching facilities for T2WI slice thickness and DCE temporal resolution ( P < .05). Adherence was not better for examinations performed in 2016 than in 2015 for any parameter ( P > .05).
Conclusion
Facilities’ adherence to PI-RADS v2 minimum technical standards was variable, being particularly poor for T2WI frequency resolution and DCE temporal resolution. The standards warrant greater community education. Certain technical standards may be too stringent, and revisions should be considered.
Introduction
The Prostate Imaging-Reporting and Data System (PI-RADS) version 2 (v2) was developed with the goal of improving the detection and characterization of suspected prostate cancer through multiparametric prostate magnetic resonance imaging (MRI). In support of this goal, its first listed specific aim is to “establish minimum acceptable technical parameters” for prostate MRI. PI-RADS v2 implements this aim by specifying a wide range of explicit acquisition parameters for T2-weighted imaging (T2WI), diffusion-weighted imaging (DWI), and dynamic contrast-enhanced imaging (DCE). The provision of these minimum technical standards is intended to promote robust image quality of prostate MRI across practices.
Much of the attention toward PI-RADS v2 has related to its standards for examination interpretation and reporting. Indeed, increasing peer-reviewed literature supports the diagnostic performance of PI-RADS v2 in the detection of clinically significant prostate cancer . However, less attention has been directed toward full dissemination and implementation of the minimum technical standards within PI-RADS v2. Therefore, little is known regarding the success in communication and dissemination of the technical standards by leaders in the field, as well as the success in adherence by individual practices. Moreover, given a paucity of data informing many of the individual standards, the determination of the exact standards relied heavily on expert consensus. Therefore, it remains possible that some of the technical standards are in fact suboptimal and could warrant reconsideration.
Get Radiology Tree app to read full this article<
Materials and Methods
Get Radiology Tree app to read full this article<
Get Radiology Tree app to read full this article<
Get Radiology Tree app to read full this article<
Get Radiology Tree app to read full this article<
Get Radiology Tree app to read full this article<
Get Radiology Tree app to read full this article<
Get Radiology Tree app to read full this article<
Results
Get Radiology Tree app to read full this article<
Get Radiology Tree app to read full this article<
Get Radiology Tree app to read full this article<
Get Radiology Tree app to read full this article<
TABLE 1
Summary of Range of Acquisition Parameters Relative to the PI-RADS v2 Minimum Technical Standards
Acquisition Parameter Minimum Standard Mean ± SD Median RangeT2-weighted imaging Slice thickness 3 mm 3.2 ± 0.7 3.0 1.5–8.0 Inter-slice gap No gap 0.3 ± 0.4 0.0 0.0–1.2 Field-of-view 12–20 cm 18.7 ± 3.5 18.0 11.9–33.9 In-plane resolution
(frequency) ≤0.4 mm 0.7 ± 0.2 0.6 0.3–1.4 In-plane resolution
(phase) ≤0.7 mm 0.8 ± 0.4 0.8 0.5–1.8Diffusion-weighted imaging TR ≥3000 ms 5728 ± 2201 5800 858–12,600 TE ≤90 ms 83 ± 22 79 52–200 Slice thickness ≤4 mm 3.6 ± 0.8 3.6 2.7–8.0 Inter-slice gap No gap 0.3 ± 0.4 0.0 0.0–1.8 Field-of-view 16–22 cm 24.7 ± 5.7 24.0 14.0–42.7 In-plane resolution
(frequency) ≤2.5 mm 1.9 ± 0.5 1.9 0.9–3.3 In-plane resolution
(phase) ≤2.5 mm 2.2 ± 0.6 2.1 1.2–4.7 High b-value images ≥1400 s/mm 2 n/a \* n/a \* n/a \* Dynamic contrast-enhanced imaging TR <100 ms 4.4 ± 1.3 4.1 2.2–11.0 TE <5 ms 1.7 ± 0.6 1.6 0.8–4.2 Slice thickness 3 mm 3.7 ± 0.7 3.6 2.5–6.0 Inter-slice gap No gap n/a † n/a † n/a † In-plane resolution
(frequency) ≤2 mm 1.3 ± 0.3 1.4 0.5–2.1 In-plane resolution
(phase) ≤2 mm 1.6 ± 0.4 1.6 0.7–2.7 Total duration ≥2 min 4.8 ± 2.0 4.9 1.3–11.2 Temporal
resolution <10 s 15.5 ± 11.2 13.0 4.0–69.0
PI-RADS, Prostate Imaging-Reporting and Data System; SD, standard deviation; TE, echo time; TR, repetition time.
Get Radiology Tree app to read full this article<
Get Radiology Tree app to read full this article<
TABLE 2
Summary of Adherence to PI-RADs v2 Minimum Technical Standards Among 107 Examinations Acquired at Different Facilities, Overall and Stratified by Field Strength and Coil Selection
Acquisition Parameter Minimum Standard Entire Cohort 1.5T, No ER Coil 3T, No ER Coil_P_ 1.5T or 3T, ER Coil 1.5T or 3T, No ER Coil_P_ \* T2-weighted imaging Slice thickness 3 mm 75.7% 76.9% 73.4% .796 85.7% 74.2% .510 Inter-slice gap No gap 57.0% 50.0% 60.9% .357 50.0% 58.1% .578 Field-of-view 12–20 cm 81.3% 80.8% 78.1% 1.0 100% 78.5% .067 In-plane resolution
(frequency) ≤0.4 mm 16.8% 15.4% 17.2% 1.0 14.3% 17.2% 1.0 In-plane resolution
(phase) ≤0.7 mm 48.6% 26.9% 56.3%.019 57.1% 47.3% .673Diffusion-weighted imaging TR ≥3000 ms 91.6% 95.0% 91.8% 1.0 92.3% 91.5% 1.0 TE ≤90 ms 75.8% 65.0% 80.3% .223 69.2% 76.8% .509 Slice thickness ≤4 mm 91.0% 82.6% 91.9% .245 100.0% 89.5% .352 Inter-slice gap No gap 63.0% 43.5% 74.2%.011 50.0% 65.1% .372 Field-of-view 16–22 cm 30.0% 26.1% 27.4% 1.0 50.0% 26.7% .114 In-plane resolution
(frequency) ≤2.5 mm 92.0% 87.0% 91.9% .677 100.0% 90.7% .596 In-plane resolution
(phase) ≤2.5 mm 75.0% 69.6% 74.2% .784 85.7% 73.3% .508 High b-value images ≥1400 s/mm 2 58.0% 56.5% 56.5% 1.0 64.3% 57.0% .772Dynamic contrast-enhanced imaging TR <100 ms 100.0% 100.0% 100.0% 1.0 100.0% 100.0% 1.0 TE <5 ms 100.0% 100.0% 100.0% 1.0 100.0% 100.0% 1.0 Slice thickness 3 mm 33.3% 22.7% 33.3% .423 57.1% 29.3% .063 Inter-slice gap No gap 100% 100% 100% .725 100% 100% 1.0 In-plane resolution
(frequency) ≤2 mm 97.9% 90.9% 100.0% 0.075 100.0% 97.6% 1.0 In-plane resolution
(phase) ≤2 mm 88.5% 81.8% 94.7% .090 85.7% 89.0% .660 Total duration ≥2 min 93.0% 94.1% 92.9% 1.0 90.9% 93.3% .581 Temporal
resolution <10 s 31.5% 11.8% 31.8% .193 54.5% 27.4% .090
ER = endorectal; PI-RADS, Prostate Imaging-Reporting and Data System; TE, echo time; TR, repetition time.
Get Radiology Tree app to read full this article<
Get Radiology Tree app to read full this article<
Get Radiology Tree app to read full this article<
Get Radiology Tree app to read full this article<
Get Radiology Tree app to read full this article<
Get Radiology Tree app to read full this article<
TABLE 3
Summary of Adherence to PI-RADs v2 Minimum Technical Standards, Stratified by Year of Examination and Facility Characteristics
Acquisition
Parameter Minimum
Standard 2015
MRI 2016
MRI_P_ <100
Miles ≥100
Miles_P_ Nonteaching Teaching_P_ \* T2-weighted imaging Slice thickness 3 mm 80.4% 70.6% 0.266 71.4% 86.7% 0.133 69.6% 92.9%.019 Inter-slice gap No gap 57.1% 56.9% 1.0 62.3% 43.3% 0.086 51.9% 71.4% .081 Field-of-view 12–20 cm 83.9% 78.4% 0.620 79.2% 86.7% 0.581 89.3% 78.5% .267 In-plane resolution
(frequency) ≤0.4 mm 32.1% 0.0%<0.001 15.6% 20.0% 0.576 16.5% 17.9% 1.0 In-plane resolution
(phase) ≤0.7 mm 67.9% 27.5%<0.001 45.5% 56.7% 0.395 46.8% 53.6% .390Diffusion-weighted imaging TR ≥3000 ms 89.8% 93.5% 0.716 91.3% 92.3% 1.0 83.3% 94.4% .108 TE ≤90 ms 75.5% 76.1% 1.0 75.4% 76.9% 1.0 74.6% 79.2% .786 Slice thickness ≤4 mm 90.4% 91.7% 1.0 94.4% 82.1% 0.111 87.7% 100.0% .108 Inter-slice gap No gap 67.3% 58.3% 0.410 66.7% 53.6% 0.254 61.6% 66.7% .816 field-of-view 16–22 cm 30.8% 29.2% 1.0 30.6% 28.6% 1.0 27.4% 37.0% .461 In-plane resolution
(frequency) ≤2.5 mm 90.4% 93.8% 0.717 89.3% 93.1% 0.683 91.8% 92.6% 1.0 In-plane resolution
(phase) ≤2.5 mm 71.2% 79.2% 0.489 67.9% 77.8% 0.315 74.0% 77.8% .799 High b-value images ≥1400 s/mm 2 55.8% 60.4% 0.682 58.3% 57.1% 1.0 56.2% 63.0% .650Dynamic contrast-enhanced imaging TR <100 ms 100.0% 100.0% 1.0 100.0% 100.0% 1.0 100.0% 100.0% 1.0 TE <5 ms 100.0% 100.0% 1.0 100.0% 100.0% 1.0 100.0% 100.0% 1.0 Slice thickness 3 mm 34.0% 32.7% 1.0 30.4% 40.7% 0.347 29.6% 44.0% .221 inter-slice gap No gap 100.0% 100.0% 1.0 100.0% 100.0% 1.0 100.0% 100.0% 1.0 In-plane resolution
(frequency) ≤2 mm 100.0% 95.9% 0.495 98.6% 96.3% 0.486 97.2% 100.0% 1.0 In-plane resolution
(phase) ≤2 mm 89.4% 87.8% 1.0 94.2% 74.1%0.010 87.3% 92.0% .723 Total duration ≥2 min 89.7% 96.9% 0.370 94.3% 88.9% 0.595 92.2% 95.0% 1.0 Temporal
resolution <10 s 22.5% 42.4% 0.081 44.4% 27.3% 0.243 24.5% 50.0%.0496
MRI, magnetic resonance imaging; PI-RADS, Prostate Imaging-Reporting and Data System; TE, echo time; TR, repetition time.
Get Radiology Tree app to read full this article<
Get Radiology Tree app to read full this article<
Discussion
Get Radiology Tree app to read full this article<
Get Radiology Tree app to read full this article<
Get Radiology Tree app to read full this article<
Get Radiology Tree app to read full this article<
Get Radiology Tree app to read full this article<
Get Radiology Tree app to read full this article<
Get Radiology Tree app to read full this article<
Get Radiology Tree app to read full this article<
Get Radiology Tree app to read full this article<
Get Radiology Tree app to read full this article<
Get Radiology Tree app to read full this article<
References
1. Kim S.H., Choi M.S., Kim M.J., et. al.: Validation of prostate imaging reporting and Data System version 2 using an MRI-ultrasound fusion biopsy in prostate cancer diagnosis. AJR Am J Roentgenol 2017; pp. 1-6.
2. Purysko A.S., Bittencourt L.K., Bullen J.A., et. al.: Accuracy and interobserver agreement for prostate imaging reporting and data system, version 2, for the characterization of lesions identified on multiparametric MRI of the prostate. AJR Am J Roentgenol 2017; 209: pp. 339-349.
3. Seo J.W., Shin S.J., Taik Oh Y., et. al.: PI-RADS version 2: detection of clinically significant cancer in patients with biopsy Gleason score 6 prostate cancer. AJR Am J Roentgenol 2017; 209: pp. W1-W9.
4. Rosenkrantz A.B., Liang Y., Duszak R., et. al.: Variation in patients’ travel times among imaging examination types at a large academic health system. Acad Radiol 2017; 24: pp. 1008-1012.
5. U.S. Census Bureau, Population Division : Annual Estimates of the Resident Population: April 1, 2010 to July 1, 2015. March2016.
6. U.S. Census Bureau : Table B-1. Metropolitan areas—area and population. From “State and Metropolitan Area Data Book: 2006”. Available at: https://www.census.gov/prod/2006pubs/smadb/smadb-06tableb.pdf
7. Association of American Medical Colleges : Integrated academic medical center hospitals. Available at: https://www.aamc.org/download/372006/data/01-97_integrated_academic_medical_center_hospitals.pdf
8. Google : Google Maps. Available at: https://www.google.com/maps/
9. Missouri Census Data Center : Metadata for dataset /pub/data/georef/zcta_master. Available at: http://mcdc.missouri.edu/data/georef/zcta_master.Metadata.html Revised on: August 19, 2013
10. Accreditation Council for Graduate Medical Education. Radiology-diagnostic programs academic year 2017–2018 United States. Available at: Accreditation Council for Graduate Medical Education (ACGME) - Public. Accessed August 21, 2017.
11. Sharif-Afshar A.R., Nguyen C., Feng T.S., et. al.: Prospective pilot trial to evaluate a high resolution diffusion-weighted MRI in prostate cancer patients. EBioMedicine 2016; 7: pp. 80-84.
12. Medved M., Soylu-Boy F.N., Karademir I., et. al.: High-resolution diffusion-weighted imaging of the prostate. AJR Am J Roentgenol 2014; 203: pp. 85-90.
13. Thierfelder K.M., Scherr M.K., Notohamiprodjo M., et. al.: Diffusion-weighted MRI of the prostate: advantages of Zoomed EPI with parallel-transmit-accelerated 2D-selective excitation imaging. Eur Radiol 2014; 24: pp. 3233-3241.
14. Korn N., Kurhanewicz J., Banerjee S., et. al.: Reduced-FOV excitation decreases susceptibility artifact in diffusion-weighted MRI with endorectal coil for prostate cancer detection. Magn Reson Imaging 2015; 33: pp. 56-62.
15. Attenberger U.I., Rathmann N., Sertdemir M., et. al.: Small field-of-view single-shot EPI-DWI of the prostate: evaluation of spatially-tailored two-dimensional radiofrequency excitation pulses. Z Med Phys 2016; 26: pp. 168-176.
16. Tamada T., Kanomata N., Sone T., et. al.: High b value (2,000 s/mm2) diffusion-weighted magnetic resonance imaging in prostate cancer at 3 Tesla: comparison with 1,000 s/mm2 for tumor conspicuity and discrimination of aggressiveness. PLoS ONE 2014; 9: e96619
17. Kitajima K., Takahashi S., Ueno Y., et. al.: Clinical utility of apparent diffusion coefficient values obtained using high b-value when diagnosing prostate cancer using 3 tesla MRI: comparison between ultra-high b-value (2000 s/mm(2)) and standard high b-value (1000 s/mm(2). J Magn Reson Imaging 2012; 36: pp. 198-205.
18. Rosenkrantz A.B., Hindman N., Lim R.P., et. al.: Diffusion-weighted imaging of the prostate: comparison of b1000 and b2000 image sets for index lesion detection. J Magn Reson Imaging 2013; 38: pp. 694-700.
19. Othman A.E., Falkner F., Weiss J., et. al.: Effect of temporal resolution on diagnostic performance of dynamic contrast-enhanced magnetic resonance imaging of the prostate. Invest Radiol 2016; 51: pp. 290-296.
20. Ream J.M., Doshi A.M., Dunst D., et. al.: Dynamic contrast-enhanced MRI of the prostate: an intraindividual assessment of the effect of temporal resolution on qualitative detection and quantitative analysis of histopathologically proven prostate cancer. J Magn Reson Imaging 2017; 45: pp. 1464-1475.
21. Rosenkrantz A.B., Geppert C., Grimm R., et. al.: Dynamic contrast-enhanced MRI of the prostate with high spatiotemporal resolution using compressed sensing, parallel imaging, and continuous golden-angle radial sampling: preliminary experience. J Magn Reson Imaging 2015; 41: pp. 1365-1373.
22. Hricak H., White S., Vigneron D., et. al.: Carcinoma of the prostate gland: MR imaging with pelvic phased-array coils versus integrated endorectal–pelvic phased-array coils. Radiology 1994; 193: pp. 703-709.