
Rationale and Objectives
The aim of this study was to determine the optimal arterial phase delay for computed tomography imaging of hepatocellular carcinoma (HCC) before and after transarterial chemoembolization (TACE) using a low iodine dose protocol.
Materials and Methods
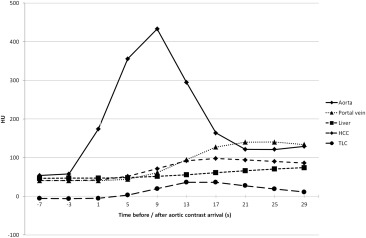
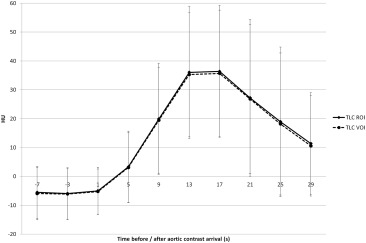
A total of 39 patients with known HCC were imaged with dynamic computed tomography of the liver (40-second scan duration, 60 mL of contrast medium), both on the same day before TACE and 1 day after TACE. Time attenuation curves of vessels, nonmalignant liver parenchyma, and 62 HCCs were normalized to a uniform aortic contrast arrival and analyzed.
Results
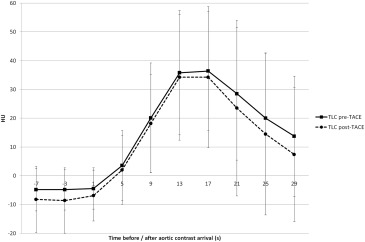
Maximal arterial phase HCC to liver contrast was reached between 13 and 17 seconds after aortic contrast arrival, both before and after TACE.
Conclusions
Using our low iodine dose protocol, arterial phase imaging of HCC should be performed between 13 and 17 seconds after aortic contrast arrival, both before and after TACE.
Introduction
Transarterial chemoembolization (TACE) is the recommended first-line therapy for hepatocellular carcinoma (HCC) in intermediate stage of the disease (Barcelona Clinic Liver Cancer scoring system stage B) . It is the most common first-line treatment for HCC worldwide, and currently almost half of all TACE treatments are performed in Barcelona Clinic Liver Cancer stage C . Classic anatomic tumor response criteria are insufficient for treatment monitoring after TACE as they do not take into account tumor necrosis induced by treatment . Therefore, modified Response Evaluation Criteria in Solid Tumors (mRECIST) are generally applied for HCC today, using the reduction in viable tumor mass to assess treatment response. Viable tumor is defined as uptake of contrast agent in the arterial phase of computed tomography (CT) or magnetic resonance imaging .
Most HCCs show increased enhancement in the arterial phase . Absence of contrast uptake after TACE indicates therapy-induced tumor devascularization. However, complete devascularization is not always achieved and the amount of contrast enhancement in viable tumors can vary . Therefore, optimization of arterial contrast should be aimed at. Beside the contrast injection protocol, the scan timing is the essential parameter for the resulting tumor to liver contrast (TLC).
Get Radiology Tree app to read full this article<
Get Radiology Tree app to read full this article<
Get Radiology Tree app to read full this article<
Materials and methods
Study Population
Get Radiology Tree app to read full this article<
Get Radiology Tree app to read full this article<
Transarterial Chemoembolization
Get Radiology Tree app to read full this article<
Dynamic CT of the Liver
Get Radiology Tree app to read full this article<
Get Radiology Tree app to read full this article<
Get Radiology Tree app to read full this article<
Get Radiology Tree app to read full this article<
Image Processing
Get Radiology Tree app to read full this article<
Get Radiology Tree app to read full this article<
Get Radiology Tree app to read full this article<
ROI/VOI Placement
Get Radiology Tree app to read full this article<
Get Radiology Tree app to read full this article<
Get Radiology Tree app to read full this article<
Scan Time Normalization
Get Radiology Tree app to read full this article<
Data Analysis
Get Radiology Tree app to read full this article<
Results
Get Radiology Tree app to read full this article<
Get Radiology Tree app to read full this article<
Table 1
Size and Perfusion Parameters of HCCs and Tumor-free Liver Before and After TACE
Parameters Pre-TACE Post-TACE HCC Size (cm) 3.7 ± 2.1 2.2 ± 1.0 ROI Analysis HCC ROI area (cm 2 ) 7.9 ± 8.5 2.5 ± 1.9 ALP (mL/100 mL/min) 59.1 ± 20.7 55.7 ± 17.1 PVP (mL/100 mL/min) 11.0 ± 11.4 9.6 ± 20.1 HPI (%) 89.3 ± 10.1 90.8 ± 14.9 Tumor-free liver ALP (mL/100 mL/min) 10.4 ± 6.3 12.3 ± 8.9 PVP (mL/100 mL/min) 64.3 ± 26.3 72.6 ± 19.9 HPI (%) 22.9 ± 16.9 20.5 ± 15.7 VOI analysis HCC VOI volume (cm 3 ) 21.7 ± 39.5 2.6 ± 2.3 ALP (mL/100 mL/min) 57.9 ± 19.5 54.2 ± 16.0 PVP (mL/100 mL/min) 11.1 ± 12.4 10.0 ± 17.3 HPI (%) 89.3 ± 10.1 90.1 ± 12.9 Tumor-free liver ALP (mL/100 mL/min) 10.3 ± 6.1 12.2 ± 8.7 PVP (mL/100 mL/min) 66.2 ± 24.6 72.2 ± 19.9 HPI (%) 22.6 ± 16.7 20.4 ± 16.0
ALP, arterial liver perfusion; HCC, hepatocellular carcinoma; HPI, hepatic perfusion index; PVP, portal venous liver perfusion; ROI, region of interest; SD, standard deviation; VOI, volume of interest.
Values are presented as the mean ± SD.
Get Radiology Tree app to read full this article<
Get Radiology Tree app to read full this article<
Get Radiology Tree app to read full this article<
Get Radiology Tree app to read full this article<
Get Radiology Tree app to read full this article<
Get Radiology Tree app to read full this article<
Get Radiology Tree app to read full this article<
Discussion
Get Radiology Tree app to read full this article<
Get Radiology Tree app to read full this article<
Get Radiology Tree app to read full this article<
Get Radiology Tree app to read full this article<
Get Radiology Tree app to read full this article<
Get Radiology Tree app to read full this article<
Get Radiology Tree app to read full this article<
Get Radiology Tree app to read full this article<
Get Radiology Tree app to read full this article<
Get Radiology Tree app to read full this article<
Get Radiology Tree app to read full this article<
Get Radiology Tree app to read full this article<
Get Radiology Tree app to read full this article<
Get Radiology Tree app to read full this article<
Conclusions
Get Radiology Tree app to read full this article<
Get Radiology Tree app to read full this article<
References
1. European Association for the Study of the Liver; European Organisation for Research and Treatment of Cancer: EASL-EORTC clinical practice guidelines: management of hepatocellular carcinoma. J Hepatol 2012; 56: pp. 908-943.
2. Sieghart W., Hucke F., Peck-Radosavljevic M.: Transarterial chemoembolization: modalities, indication, and patient selection. J Hepatol 2015; 62: pp. 1187-1195.
3. Saraswat V.A., Pandey G., Shetty S.: Treatment algorithms for managing hepatocellular carcinoma. J Clin Exp Hepatol 2014; 4: pp. 80-89.
4. Lencioni R., Llovet J.M.: Modified RECIST (mRECIST) assessment for hepatocellular carcinoma. Semin Liver Dis 2010; 30: pp. 52-60.
5. Bruix J., Sherman M., Llovet J.M., et. al., EASL Panel of Experts on HCC: Clinical management of hepatocellular carcinoma. Conclusions of the Barcelona-2000 EASL conference. European Association for the Study of the Liver. J Hepatol 2001; 35: pp. 421-430.
6. Alba E., Valls C., Dominguez J., et. al.: Transcatheter arterial chemoembolization in patients with hepatocellular carcinoma on the waiting list for orthotopic liver transplantation. AJR Am J Roentgenol 2008; 190: pp. 1341-1348.
7. Lee J.H., Lee J.M., Kim S.J., et. al.: Enhancement patterns of hepatocellular carcinomas on multiphasic multidetector row CT: comparison with pathological differentiation. Br J Radiol 2012; 85: pp. e573-e583.
8. Hennedige T., Yang Z.J., Ong C.K., et. al.: Utility of non-contrast-enhanced CT for improved detection of arterial phase hyperenhancement in hepatocellular carcinoma. Abdom Imaging 2014; 39: pp. 1247-1254.
9. Yanaga Y., Awai K., Nakaura T., et. al.: Optimal contrast dose for depiction of hypervascular hepatocellular carcinoma at dynamic CT using 64-MDCT. AJR Am J Roentgenol 2008; 190: pp. 1003-1009.
10. Wu D., Tan M., Zhou M., et. al.: Liver computed tomographic perfusion in the assessment of microvascular invasion in patients with small hepatocellular carcinoma. Invest Radiol 2015; 50: pp. 188-194.
11. Kagawa Y., Okada M., Yagyu Y., et. al.: Optimal scan timing of hepatic arterial-phase imaging of hypervascular hepatocellular carcinoma determined by multiphasic fast CT imaging technique. Acta Radiol 2013; 54: pp. 843-850.
12. Bruix J., Sherman M., American Association for the Study of Liver Diseases: Management of hepatocellular carcinoma: an update. Hepatology 2011; 53: pp. 1020-1022.
13. Kim S.H., Kamaya A., Willmann J.K.: CT perfusion of the liver: principles and applications in oncology. Radiology 2014; 272: pp. 322-344.
14. Deak P.D., Smal Y., Kalender W.A.: Multisection CT protocols: sex- and age-specific conversion factors used to determine effective dose from dose-length product. Radiology 2010; 257: pp. 158-166.
15. Baron R.L.: Understanding and optimizing use of contrast material for CT of the liver. AJR Am J Roentgenol 1994; 163: pp. 323-331.
16. Fleischmann D.: How to design injection protocols for multiple detector-row CT angiography (MDCTA). Eur Radiol 2005; 15: pp. E60-E65.
17. Murakami T., Onishi H., Mikami K., et. al.: Determining the optimal timing for early arterial phase hepatic CT imaging by measuring abdominal aortic enhancement in variable contrast injection protocols. J Comput Assist Tomogr 2006; 30: pp. 206-211.
18. Yamaguchi I., Kidoya E., Suzuki M., et. al.: Optimizing scan timing of hepatic arterial phase by physiologic pharmacokinetic analysis in bolus-tracking technique by multi-detector row computed tomography. Radiol Phys Technol 2011; 4: pp. 43-52.
19. Murakami T., Kim T., Kawata S., et. al.: Evaluation of optimal timing of arterial phase imaging for the detection of hypervascular hepatocellular carcinoma by using triple arterial phase imaging with multidetector-row helical computed tomography. Invest Radiol 2003; 38: pp. 497-503.
20. Kanematsu M., Goshima S., Kondo H., et. al.: Optimizing scan delays of fixed duration contrast injection in contrast-enhanced biphasic multidetector-row CT for the liver and the detection of hypervascular hepatocellular carcinoma. J Comput Assist Tomogr 2005; 29: pp. 195-201.
21. Goshima S., Kanematsu M., Kondo H., et. al.: MDCT of the liver and hypervascular hepatocellular carcinomas: optimizing scan delays for bolus-tracking techniques of hepatic arterial and portal venous phases. AJR Am J Roentgenol 2006; 187: pp. W25-W32.
22. Lell M.M., Jost G., Korporaal J.G., et. al.: Optimizing contrast media injection protocols in state-of-the art computed tomographic angiography. Invest Radiol 2015; 50: pp. 161-167.
23. Ichikawa T., Okada M., Kondo H., et. al.: Recommended iodine dose for multiphasic contrast-enhanced mutidetector-row computed tomography imaging of liver for assessing hypervascular hepatocellular carcinoma: multicenter prospective study in 77 general hospitals in Japan. Acad Radiol 2013; 20: pp. 1130-1136.
24. Noda Y., Kanematsu M., Goshima S., et. al.: Reducing iodine load in hepatic CT for patients with chronic liver disease with a combination of low-tube-voltage and adaptive statistical iterative reconstruction. Eur J Radiol 2015; 84: pp. 1-18.