
Rationale and Objectives
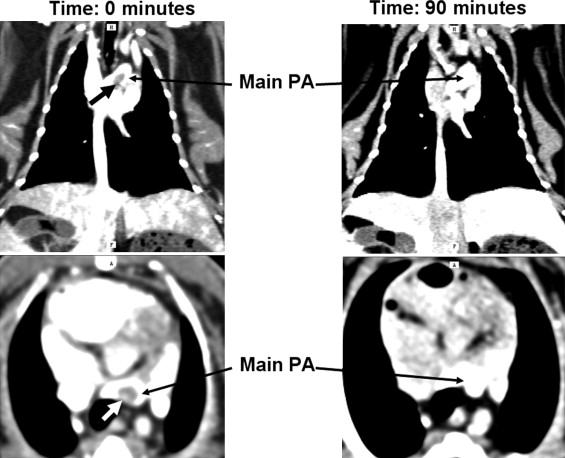
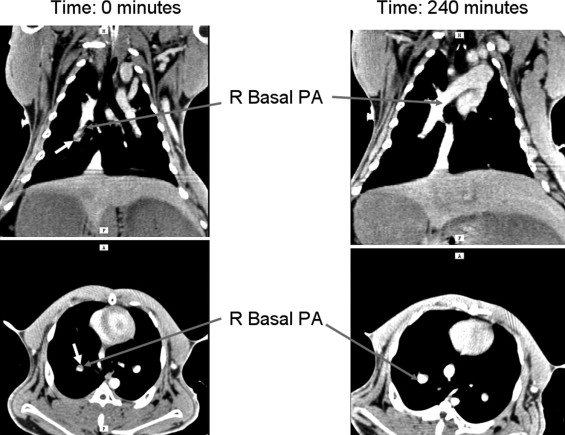
Polyethylene glycol−coated liposomal blood pool contrast agents maintain contrast enhancement over several hours. This study aimed to evaluate (long-term) imaging of pulmonary arteries, comparing conventional iodinated contrast with a liposomal blood pool contrast agent. Also, visualization of the (real-time) therapeutic effects of tissue plasminogen activator (t-PA) on pulmonary embolism (PE) was attempted.
Materials and Methods
Six rabbits (weight approximately 4 kg) had autologous blood clots injected through the superior vena cava. Imaging was performed using conventional contrast (iohexol, 350 mg I/ml; GE HealthCare, Princeton, NJ) at a dose of 1400 mg I per animal, and after wash-out, animals were imaged using an iodinated liposomal blood pool agent (88 mg I/mL, dose 900 mg I/animal). Subsequently, five animals were injected with 2 mg of t-PA and imaging continued for up to 4½ hours.
Results
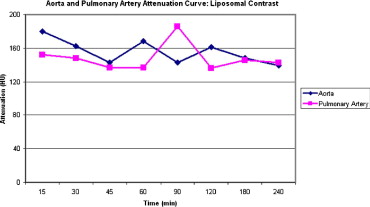
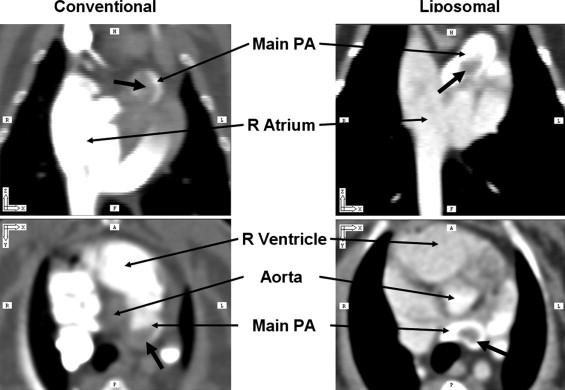
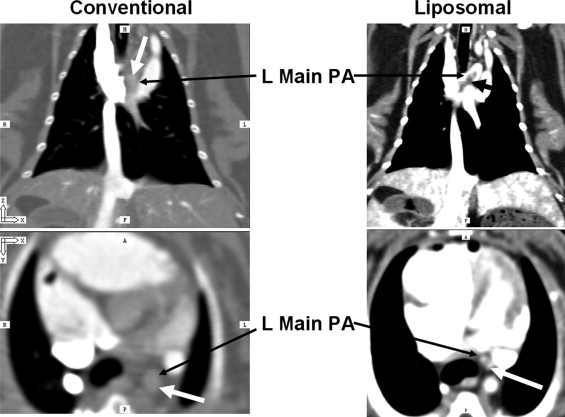
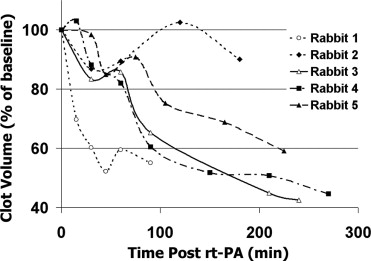
Both contrast agents identified PE in the pulmonary trunk and main pulmonary arteries in all rabbits. Liposomal blood pool agent yielded uniform enhancement, which remained relatively constant throughout the experiments. Conventional agents exhibited nonuniform opacification and rapid clearance postinjection. Three of six rabbits had mistimed bolus injections, requiring repeat injections. Following t-PA, pulmonary embolus volume (central to segmental) decreased in four of five treated rabbits (range 10−57%, mean 42%). One animal showed no response to t-PA.
Conclusions
Liposomal blood pool agents effectively identified acute PE without need for reinjection. PE resolution following t-PA was quantifiable over several hours. Blood pool agents offer the potential for repeated imaging procedures without need for repeated (nephrotoxic) contrast injections.
Patients who present with acute chest symptoms are a frequent clinical problem ( ). This is partly due to the range of acute diagnoses that can be considered. As a result, early triage to decide on adequate management is crucial. This has led to a significant increase in CT utilization ( ), and attempts are now focusing on reducing the number of patients requiring imaging ( ). Essentially, the three most critical diagnoses that clinicians focus on are (a) myocardial ischemia, (b) pulmonary embolism (PE), and (c) aortic dissection or rupture. Although all three diagnoses can now be evaluated using CT, simultaneous evaluation, or a “triple rule-out” CT protocol, it is difficult to entertain due to competing requirements. Because conventional contrast agents are distributed and cleared within minutes ( ), effective multifunctional imaging becomes difficult. Thus, for PE evaluation, the contrast bolus has to be timed to be optimal in the right heart and pulmonary circulation ( ), while for assessment of the aorta and coronary arteries, a greater delay from bolus to imaging is required to reach optimal contrast enhancement in the left heart.
A correctly timed contrast bolus delay is not easy to achieve; even with the aid of a test bolus or bolus detection systems in modern CT scanners, up to 10% of PE studies have suboptimal contrast in the pulmonary arteries ( ). Although one could devise a combined protocol with multiple contrast bolus injections and repeated CT imaging of the relevant field of view, it is likely that the number of suboptimal contrast studies will rise. A single study with optimal, simultaneous enhancement in multiple vascular beds would prevent repeat studies with their incremental x-ray dose with each scan and the nephrotoxicity of repeat contrast administration.
Get Radiology Tree app to read full this article<
Get Radiology Tree app to read full this article<
Materials and methods
Rabbit In Vivo Protocol
Get Radiology Tree app to read full this article<
Get Radiology Tree app to read full this article<
Get Radiology Tree app to read full this article<
Induction of Pulmonary Embolism
Get Radiology Tree app to read full this article<
Thrombolytic Therapy Protocol
Get Radiology Tree app to read full this article<
Imaging Protocol
Get Radiology Tree app to read full this article<
Get Radiology Tree app to read full this article<
Contrast Agents
Get Radiology Tree app to read full this article<
Get Radiology Tree app to read full this article<
Get Radiology Tree app to read full this article<
Get Radiology Tree app to read full this article<
Image Analysis
Get Radiology Tree app to read full this article<
Get Radiology Tree app to read full this article<
Results
Contrast Agent Comparison
Get Radiology Tree app to read full this article<
Get Radiology Tree app to read full this article<
Get Radiology Tree app to read full this article<
Get Radiology Tree app to read full this article<
Thrombolytic Effect Measurements
Get Radiology Tree app to read full this article<
Get Radiology Tree app to read full this article<
Discussion
Get Radiology Tree app to read full this article<
Get Radiology Tree app to read full this article<
Get Radiology Tree app to read full this article<
Get Radiology Tree app to read full this article<
Get Radiology Tree app to read full this article<
Get Radiology Tree app to read full this article<
Get Radiology Tree app to read full this article<
References
1. ESC Task Force on Pulmonary Embolism. Eur Heart J 2000; 21: pp. 1301-1336.
2. BTS Standards of Care Committee Pulmonary Embolism Guideline Development Group: British Thoracic Society guidelines for the management of suspected acute pulmonary embolism. Thorax 2003; 58: pp. 470-484.
3. O’Neill J.M., Wright L., Murchison J.T.: Helical CTPA in the investigation of pulmonary embolism: A 6-year review. Clin Radiol 2004; 59: pp. 819-825.
4. Wittram C., Meehan M.J., Halpern E.F., Shepard J.A., McLoud T.C., Thrall J.H.: Trends in thoracic radiology over a decade at a large academic medical center. J Thorac Imaging 2004; 19: pp. 164-170.
5. Le Gal G., Bounameaux H.: Diagnosing pulmonary embolism: running after the decreasing prevalence of cases among suspected patients [editorial]. J Thromb Haemost 2004; 2: pp. 1244-1246.
6. Kline J.A., Mitchell A.M., Kabrhel C., Richman P.B., Courtney D.M.: Clinical criteria to prevent unnecessary diagnostic testing in emergency department patients with suspected pulmonary embolism. J Throm Haemost 2004; 2: pp. 1247-1255.
7. Kline J.A., Webb W.B., Jones A.E., Hernandez-Nino J.: Impact of rapid rule-out protocol for pulmonary embolism on the rate of screening, missed cases, and pulmonary vascular imaging in an urban US emergency department. Ann Emerg Med 2004; 44: pp. 490-502.
8. Perrier A., Roy P.M., Sanchez O., et. al.: Multidetector-row computed tomography in suspected pulmonary embolism. N Engl J Med 2005; 352: pp. 1760-1768.
9. Desser T.S., Rubin D.L., Muller H., McIntire G.L., Bacon E.R., Toner J.L.: Blood pool and liver enhancement in CT with liposomal iodixanol: Comparison with iohexol. Acad Radiol 1999; 6: pp. 176-183.
10. Wiart M., Corot C., Berthezene Y., Violas X., Canet E.: CT pulmonary angiography with a macromolecular contrast medium: A comparative study versus iobitridol in rabbits. Invest Radiol 2001; 36: pp. 547-553.
11. Vera D.R., Mattrey R.F.: A molecular CT blood pool contrast agent. Acad Radiol 2002; 9: pp. 784-792.
12. Schoepf U.J., Costello P.: CT angiography for diagnosis of pulmonary embolism: State of the art. Radiology 2004; 230: pp. 329-337.
13. Prokop M., Schaefer-Prokop C.M., Hartmann I.J., Engelke C.: Pulmonary CT angiography.Lipson D.A.van Beek E.J.R.Functional lung imaging.2005.Taylor and FrancisNew York:pp. 87-142.
14. Jones S.E., Wittram C.: The indeterminate CT pulmonary angiogram: Imaging characteristics and patient clinical outcome. Radiology 2005; 237: pp. 329-337.
15. Kao C.Y., Hoffman E.A., Beck K.C., Bellamkonda R.V., Annapragada A.V.: Long-residence-time nano-scale liposomal iohexol for X-ray-based blood pool imaging. Acad Radiol 2003; 10: pp. 475-483.
16. Mukundan S., Ghaghada K.B., et. al.: A liposomal nanoscale contrast agent for preclinical CT in mice. et. AJR Am J Roetgenol 2006; 186: pp. 300-307.
17. Kipfmueller F., Quiroz R., Goldhaber S.Z., Schoepf U.J., Costello P., Kucher N.: Chest CT assessment following thrombolysis or surgical embolectomy for acute pulmonary embolism. Vasc Med 2005; 10: pp. 85-89.
18. Sachse A., Leike J.U., Schneider T., et. al.: Biodistribution and computed tomography blood-pool imaging properties of polyethylene glycol-coated iopromide-carrying liposomes. Invest Radiol 1997; 32: pp. 44-50.
19. Hoffman E.A., Gnanaprakasam D., Gupta K.B., Hoford J.D., Kugelmass S.D., Kulawiec R.S.: VIDA: An environment for multidimensional image display and analysis. SPIE Proc 1992; 1660: pp. 694-711.
20. Amirav I., Kramer S.S., Grunstein M.M., Hoffman E.A.: Assessment of methacholine-induced airway constriction by ultrafast high-resolution computed tomography. J Appl Physiol 1993; 75: pp. 2239-2250.
21. Schmiedl U.P., Krause W., Leike J., Sachse A.: CT blood pool enhancement in primates with iopromide-carrying liposomes containing soy phosphatidyl glycerol. Acad Radiol 1999; 6: pp. 164-169.
22. Shapira Y., Vaturi M., Hasdai D., Battler A., Sagie A.: The safety and efficacy of repeated courses of tissue-type plasminogen activator in patients with stuck mitral valves who did not fully respond to the initial thrombolytic course. J Thromb Haemost 2003; 1: pp. 725-728.
23. Schofer J., Lins M., Mathey D.G., Sheehan F.H., The PRIMI Trial Study Group: Time course of left ventricular function and coronary patency after saruplase vs streptokinase in acute myocardial infarction. Eur Heart J 1993; 14: pp. 958-963.
24. Levine M.N., Weitz J., Turpie A.G., Andrew M., Cruickshank M., Hirsh J.: A new short infusion dosage regimen of recombinant tissue plasminogen activator in patients with venous thromboembolic disease. Chest 1990; 97: pp. 168S-171S.
25. Fujisaka Y., Horiike A., Shimizu T., Yamamoto N., Yamada Y., Tamura T.: Phase 1 clinical study of pegylated liposomal doxorubicin (JNS002) in Japanese patients with solid tumors. Jpn J Clin Oncol 2006; (E-pub ahead of print)