
Rationale and objectives
A new postprocessing algorithm named adaptive statistical iterative reconstruction (ASIR)-V has been recently introduced. The aim of this article was to analyze the impact of ASIR-V algorithm on signal, noise, and image quality of coronary computed tomography angiography.
Materials and Methods
Fifty consecutive patients underwent clinically indicated coronary computed tomography angiography (Revolution CT; GE Healthcare, Milwaukee, WI). Images were reconstructed using filtered back projection and ASIR-V 0%, and a combination of filtered back projection and ASIR-V 20%–80% and ASIR-V 100%. Image noise, signal-to-noise ratio (SNR), and contrast-to-noise ratio (CNR) were calculated for left main coronary artery (LM), left anterior descending artery (LAD), left circumflex artery (LCX), and right coronary artery (RCA) and were compared between the different postprocessing algorithms used. Similarly a four-point Likert image quality score of coronary segments was graded for each dataset and compared. A cutoff value of P < .05 was considered statistically significant.
Results
Compared to ASIR-V 0%, ASIR-V 100% demonstrated a significant reduction of image noise in all coronaries ( P < .01). Compared to ASIR-V 0%, SNR was significantly higher with ASIR-V 60% in LM ( P < .01), LAD ( P < .05), LCX ( P < .05), and RCA ( P < .01). Compared to ASIR-V 0%, CNR for ASIR-V ≥60% was significantly improved in LM ( P < .01), LAD ( P < .05), and RCA ( P < .01), whereas LCX demonstrated a significant improvement with ASIR-V ≥80%. ASIR-V 60% had significantly better Likert image quality scores compared to ASIR-V 0% in segment-, vessel-, and patient-based analyses ( P < .01).
Conclusions
Reconstruction with ASIR-V 60% provides the optimal balance between image noise, SNR, CNR, and image quality.
Introduction
Coronary computed tomography angiography (CCTA) is an excellent noninvasive tool for the accurate diagnosis of patients with coronary artery disease (CAD) . Novel techniques utilizing CCTA are broadening its application for the assessment of ischemic heart disease . However, CCTA has raised concerns regarding radiation exposure to the patient . Several strategies for CCTA image acquisition and postprocessing have been adopted from different vendors to maintain diagnostic image quality while reducing radiation dose . Low–dose protocol CCTA using dose modulation, prospective electrocardiographic triggering, high-pitch acquisition, and low tube potential have been shown to be effective strategies for radiation dose reduction . However, decreasing tube potential has been associated with increased image noise and degradation of CCTA images . To overcome this issue, iterative reconstruction (IR) algorithms were developed. IR algorithms allow for an improvement in image quality and diagnostic accuracy compared to standard filtered back projection (FBP) in CCTA acquired with a low-dose protocol . Although IR represents a useful tool in clinical practice, it is important to consider some of its limitations. Compared to standard FBP, IR requires a longer time for reconstruction and may cause underestimation of coronary artery calcium .
Recently, a new generation of adaptive statistical iterative reconstruction (ASIR-V; GE Healthcare, Milwaukee, WI) was developed . This new algorithm de-emphasizes the modeling of system optics and allows a reconstruction of images with similar speed compared to FBP. System optics is the main driver for improved spatial resolution and is the most time-consuming portion of the IR reconstruction process. Furthermore, the new ASIR-V compared to older versions of ASIR enables a further reduction of low signal artifacts. Therefore, a significant improvement in image quality can be achieved without a large penalty in reconstruction speed. The aim of this article was to compare image quality metrics for FBP with varying degrees of ASIR-V in CCTA.
Materials and Methods
Patient Population
Get Radiology Tree app to read full this article<
Patient Preparation and CCTA Acquisition
Get Radiology Tree app to read full this article<
Reconstruction and Analysis of CCTA Images
Get Radiology Tree app to read full this article<
Get Radiology Tree app to read full this article<
Get Radiology Tree app to read full this article<
Get Radiology Tree app to read full this article<
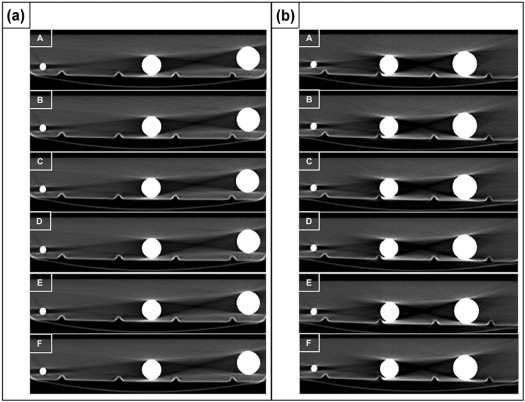
Phantom Setup and Image Acquisition
Get Radiology Tree app to read full this article<
Get Radiology Tree app to read full this article<
Get Radiology Tree app to read full this article<
Get Radiology Tree app to read full this article<
Get Radiology Tree app to read full this article<
Get Radiology Tree app to read full this article<
Get Radiology Tree app to read full this article<
Statistical Analysis
Get Radiology Tree app to read full this article<
Results
Patient Characteristics
Get Radiology Tree app to read full this article<
TABLE 1
Baseline Characteristics of the Overall Population
Baseline Characteristics Number, n (%) 50 Age (y), mean ± SD 64.3 ± 9.2 Male, n (%) 38 (76) Body mass index (kg/m 2 ), mean ± SD 26 ± 3.9
Risk Factors Hypertension, n (%) 18 (36) Smoker, n (%) 9 (18) Hyperlipidemia, n (%) 21 (42) Diabetes, n (%) 6 (12) Family history, n (%) 15 (30)
Clinical History Chest pain, n (%) 14 (28) Positive stress test, n (%) 12 (24) Follow-up of known CAD, n (%) 8 (16) Valvular disease, n (%) 5 (10) Arrhythmias, n (%) 5 (10) Dilated cardiomyopathy, n (%) 6 (12)
Intravenous β-blocker Number of patients, n (%) 31 (62) Dose (mg), mean ± SD 9.1 ± 4.2
Heart rate during the scan Minimum heart rate (bpm), mean ± SD 59.3 ± 13.5 Mean heart rate (bpm), mean ± SD 63.2 ± 13.8 Maximum heart rate (bpm), mean ± SD 73.9 ± 20.3
CAD, coronary artery disease; SD, standard deviation.
Get Radiology Tree app to read full this article<
Objective Image Quality
Get Radiology Tree app to read full this article<
TABLE 2
Comparison of SNR, CNR, and Image Noise Between ASIR-V 20%, 40%, 60%, 80%, 100%, and 0%
ASIR-V 0% ASIR-V 20% ASIR-V 40% ASIR-V 60% ASIR-V 80% ASIR-V 100% LM SNR, mean ± SD 14.6 ± 5.7 16.0 ± 6.7 17.1 ± 7.1 \* 19.9 ± 8.4 \* 21.8 ± 12.1 \* 23.0 ± 10.2 \* CNR, mean ± SD 17.3 ± 6.8 19.2 ± 8.0 † 20.3 ± 8.4 \* 23.7 ± 10.2 \* 26.0 ± 14.5 \* 27.5 ± 12.3 \* Noise (HU), mean ± SD 38.8 ± 12.7 35.6 ± 12.5 \* 34.3 ± 13.8 \* 30.4 ± 14.0 \* 30.3 ± 17.5 \* 27.0 ± 14.8 \* LAD SNR, mean ± SD 12.0 ± 4.7 12.6 ± 5.5 13.2 ± 6.7 13.8 ± 8.0 † 15.7 ± 8.6 \* 17.2 ± 9.5 \* CNR, mean ± SD) 14.6 ± 5.9 13.3 ± 6.9 16. 0 ± 8.0 16.8 ± 9.8 † 19.2 ± 10.1 \* 21.1 ± 12.5 \* Noise (HU), mean ± SD 44.8 ± 16.5 45.0 ± 20.0 43. 9 ± 22.3 45.0 ± 25.7 41.8 ± 26 .3 38.2 ± 23.3 \* LCX SNR, mean ± SD 9.0 ± 4.0 9.3 ± 3.9 9.9 ± 7.9 10.1 ± 5.3 † 11.4 ± 7.1 \* 13.0 ± 9.5 \* CNR, mean ± SD 11.0 ± 4.9 11.4 ± 4.6 12.2 ± 10.3 12.4 ± 6.5 14.0 ± 8.8 \* 15.9 ± 11.6 \* Noise (HU), mean ± SD 58.4 ± 27 54.5 ± 24.5 † 56.6 ± 28.6 56.5 ± 28.7 † 52.3 ± 26.0 \* 45.7 ± 23.9 \* RCA SNR, mean ± SD 9.8 ± 4.8 11.5 ± 5.8 \* 11.2 ± 5.8 † 12.8 ± 7.3 \* 13.4 ± 7.9 \* 14.6 ± 8.9 \* CNR, mean ± SD 11.8 ± 5.8 13.9 ± 6.6 \* 13.4 ± 6.6 \* 15.3 ± 8.2 \* 16.2 ± 9.3 \* 17.7 ± 10.8 \* Noise (HU), mean ± SD 54.3 ± 25.2 47.2 ± 22.9 \* 48.5 ± 25.1 \* 44.3 ± 22.3 \* 44.2 ± 25.6 \* 42.1 ± 25.8 \*
ASIR, adaptive statistical iterative reconstruction; CNR, contrast-to-noise ratio; LAD, left anterior descending artery; LCX, left circumflex coronary artery; LM, left main coronary artery; RCA, right coronary artery; SD, standard deviation; SNR, signal-to-noise ratio.
Statistical analysis compared different combinations of ASIR-V ≥20% with ASIR-V 0%.
Get Radiology Tree app to read full this article<
Get Radiology Tree app to read full this article<
Get Radiology Tree app to read full this article<
Get Radiology Tree app to read full this article<
Get Radiology Tree app to read full this article<
Get Radiology Tree app to read full this article<
Get Radiology Tree app to read full this article<
Get Radiology Tree app to read full this article<
TABLE 3
Comparison of SNR, CNR, and Image Noise Between ASIR-V 20%, 40%, 60%, 80%, 100%, and 0% in phantom
400 mg/mL ASIR-V 0% ASIR-V 20% ASIR-V 40% ASIR-V 60% ASIR-V 80% ASIR-V 100% Syringe of 20 mL SNR, mean ± SD 213.3 ± 19.9 233.7 ± 15.6 258.2 ± 26.2 † 289. 2 ± 28.8 † 310.0 ± 24.4 † 355.2 ± 54.0 † CNR, mean ± SD 196.9 ± 6.7 204.6 ± 40.3 212.2 ± 52.2 244.0 ± 70.4 262.3 ± 71.9 273.4 ± 87.2 Noise (HU), mean ± SD 14.4 ± 1.2 13.1 ± 0.9 11.9 ± 1.1 \* 10.7 ± 1.2 † 9.9 ± 0.8 † 8.7 ± 1.2 \*
320 mg/mL ASIR-V 0% ASIR-V 20% ASIR-V 40% ASIR-V 60% ASIR-V 80% ASIR-V 100% Syringe of 20 mL SNR, mean ± SD 228.7 ± 39.9 251.6 ± 14.9 282.5 ± 18.8 291.0 ± 13.9 350.6 ± 13.1 † 407.8 ± 11.4 † CNR, mean ± SD 228.1 ± 39.4 251.1 ± 14.4 281.8 ± 17.2 290.4 ± 12.8 349.9 ± 13.9 † 407.0 ± 12.4 † Noise (HU), mean ± SD 13.7 ± 2.6 12.2 ± 0.7 10.9 ± 0.7 10.5 ± 0.4 8.7 ± 0.3 7.5 ± 0.2
ASIR, adaptive statistical iterative reconstruction; CNR, contrast-to-noise ratio; SD, standard deviation; SNR, signal-to-noise ratio.
Statistical analysis compared different combinations of ASIR-V ≥20% with ASIR-V 0%.
Get Radiology Tree app to read full this article<
Get Radiology Tree app to read full this article<
Get Radiology Tree app to read full this article<
Subjective Image Quality
Get Radiology Tree app to read full this article<
TABLE 4
Comparison of Likert Image Quality Score Between ASIR-V 20%, 40%, 60%, 80%, 100%, and 0% in a Segment-based Analysis
N ASIR-V 0% ASIR-V 20% ASIR-V 40% ASIR-V 60% ASIR-V 80% ASIR-V 100% LM 50 2.6 ± 0.5 3.2 ± 0.6 \* 3.7 ± 0.4 \* 3.8 ± 0.4 \* 2.9 ± 0.6 \* 2.5 ± 0.5 Proximal LAD 50 2.4 ± 0.6 3.0 ± 0.6 \* 3.6 ± 0.7 \* 3.6 ± 0.8 \* 2.7 ± 0.6 \* 2.2 ± 0.5 Mid LAD 50 2.3 ± 0.6 2.7 ± 0.8 \* 3.3 ± 0.9 \* 3.4 ± 0.8 \* 2.5 ± 0.6 † 2.1 ± 0.6 \* Distal LAD 50 2.3 ± 0.6 2.7 ± 0.7 \* 3.2 ± 0.8 \* 3.3 ± 0.9 \* 2.5 ± 0.6 † 2.1 ± 0.5 \* D1 50 2.2 ± 0.6 2.5 ± 0.8 \* 3.1 ± 1.0 \* 3.2 ± 1.0 \* 2.4 ± 0.7 1.9 ± 0.5 \* Proximal LCX 50 2.4 ± 0.5 3.0 ± 0.6 \* 3.5 ± 0.6 \* 3.6 ± 0.6 \* 2.8 ± 0.6 \* 2.3 ± 0.5 Mid LCX 50 2.3 ± 0.5 2.7 ± 0.7 \* 3.3 ± 0.8 \* 3.3 ± 0.8 \* 2.5 ± 0.6 † 2.1 ± 0.5 † Distal LCX 50 2.2 ± 0.5 2.3 ± 0.7 3.0 ± 1.0 \* 3.0 ± 1.1 \* 2.4 ± 0.7 † 2.0 ± 0.5 † M1 50 2.3 ± 0.7 2.6 ± 0.8 \* 3.2 ± 0.9 \* 3.3 ± 0.9 \* 2.2 ± 0.7 \* 2.0 ± 0.6 \* Proximal RCA 50 2.4 ± 0.7 2.7 ± 0.8 \* 3.3 ± 0.9 \* 3.3 ± 0.9 \* 2.4 ± 0.7 2.1 ± 0.6 \* Mid RCA 50 2.1 ± 0.8 2.3 ± 0.9 † 2.9 ± 1.0 \* 2.9 ± 1.1 \* 2.3 ± 0.8 1.9 ± 0.6 \* Distal RCA 50 2.2 ± 0.7 2.5 ± 0.8 \* 3.0 ± 1.0 \* 3.1 ± 1.0 \* 2.3 ± 0.8 1.9 ± 0.5 \* PLA 50 2.1 ± 0.7 2.3 ± 0.8 3.0 ± 1.0 \* 3.0 ± 1.0 \* 2.4 ± 0.7 † 1.9 ± 0.6 \* PDA 50 2.1 ± 0.7 2.3 ± 0.8 \* 2.9 ± 1.0 \* 2.9 ± 1.1 \* 2.3 ± 0.8 † 1.9 ± 0.6 \*
ASIR, adaptive statistical iterative reconstruction; LAD, left anterior descending artery; LCX, left circumflex artery; LM, left main coronary artery; PDA, posterior descending artery; PLA, posterolateral artery.; RCA, right coronary artery.
Statistical analysis compared different combinations of ASIR-V ≥20% with ASIR-V 0%.
Get Radiology Tree app to read full this article<
Get Radiology Tree app to read full this article<
TABLE 5
Comparison of Likert Image Quality Score Between ASIR-V 20%, 40%, 60%, 80%, 100%, and 0% in Vessel- and Patient-based Analyses †
N ASIR-V 0% ASIR-V 20% ASIR-V 40% ASIR-V 60% ASIR-V 80% ASIR-V 100% LAD 50 2.3 ± 0.5 2.8 ± 0.6 \* 3.4 ± 0.7 \* 3.4 ± 0.7 \* 2.6 ± 0.5 \* 2.1 ± 0.4 \* LCX 50 2.3 ± 0.4 2.7 ± 0.6 \* 3.3 ± 0.8 \* 3.3 ± 0.7 \* 2.6 ± 0.5 \* 2.1 ± 0.4 RCA 50 2.3 ± 0.4 2.5 ± 0.7 3.1 ± 0.8 \* 3.1 ± 0.9 \* 2.3 ± 0.6 2.0 ± 0.4 \* Patient-based analysis 50 2.3 ± 0.4 2.6 ± 0.5 \* 3.2 ± 0.7 \* 3.3 ± 0.7 \* 2.5 ± 0.5 \* 2.1 ± 0.4 \*
ASIR, adaptive statistical iterative reconstruction; LAD, left anterior descending artery; LCX, left circumflex artery; RCA, right coronary artery.
Statistical analysis compared different combinations of ASIR-V ≥20% with ASIR-V 0%.
Get Radiology Tree app to read full this article<
Get Radiology Tree app to read full this article<
Get Radiology Tree app to read full this article<
Get Radiology Tree app to read full this article<
Get Radiology Tree app to read full this article<
TABLE 6
Comparison of Likert Image Quality Score Between ASIR-V 20%, 40%, 60%, 80%, 100%, and 0% in Phantom \*
400 mg/mL ASIR-V 0% ASIR-V 20% ASIR-V 40% ASIR-V 60% ASIR-V 80% ASIR-V 100% Syringe 1 mL 1.6 ± 0.5 2.3 ± 0.6 3.3 ± 0.6 † 4.0 ± 0.0 † 3.3 ± 0.5 † 2.6 ± 0.6 Syringe 10 mL 2.0 ± 0 2.6 ± 0.5 † 3.6 ± 0.6 † 3.8 ± 0.4 † 3.3 ± 0.6 † 3.0 ± 0 † Syringe 20 mL 2.6 ± 0.5 3.0 ± 0.0 3.6 ± 0.5 † 3.7 ± 0.5 † 3.3 ± 0.5 3.3 ± 0.5
320 mg/mL ASIR-V 0% ASIR-V 20% ASIR-V 40% ASIR-V 60% ASIR-V 80% ASIR-V 100% Syringe 1 mL 1.6 ± 0.5 2.3 ± 0.5 3.6 ± 0.6 † 3.7 ± 0.6 † 3.3 ± 0.5 † 3.3 ± 0.5 † Syringe 10 mL 1.7 ± 0.6 2.7 ± 0.6 3.7 ± 0.6 4.0 ± 0.0 † 3.3 ± 0.6 3.0 ± 0.0 Syringe 20 mL 2.3 ± 0.7 3.0 ± 0.0 3.7 ± 0.5 † 3.7 ± 0.6 † 3.6 ± 0.6 † 3.2 ± 0.6
ASIR, adaptive statistical iterative reconstruction.
Statistical analysis compared different combinations of ASIR-V ≥20% with ASIR-V 0%.
Get Radiology Tree app to read full this article<
Get Radiology Tree app to read full this article<
Get Radiology Tree app to read full this article<
Get Radiology Tree app to read full this article<
Get Radiology Tree app to read full this article<
Discussion
Get Radiology Tree app to read full this article<
Get Radiology Tree app to read full this article<
Get Radiology Tree app to read full this article<
Get Radiology Tree app to read full this article<
Get Radiology Tree app to read full this article<
Get Radiology Tree app to read full this article<
Get Radiology Tree app to read full this article<
Get Radiology Tree app to read full this article<
Get Radiology Tree app to read full this article<
References
1. Task Force Members, Montalescot G., Sechtem U., et. al.: 2013 ESC guidelines on the management of stable coronary artery disease: the Task Force on the Management of Stable Coronary Artery Disease of the European Society of Cardiology. Eur Heart J 2013; 34: pp. 2949-3003.
2. Maffei E., Seitun S., Martini C., et. al.: Prognostic value of computed tomography coronary angiography in patients with chest pain of suspected cardiac origin. Radiol Med 2011; 116: pp. 690-705.
3. Guaricci A.I., Pontone G., Brunetti N.D., et. al.: The presence of remodeled and mixed atherosclerotic plaques at coronary ct angiography predicts major cardiac adverse events—the CAFE-PIE study. Int J Cardiol 2016; 215: pp. 325-331.
4. De Cecco C.N., Meinel F.G., Chiaramida S.A., et. al.: Coronary artery computed tomography scanning. Circulation 2014; 129: pp. 1341-1345.
5. Pontone G., Andreini D., Guaricci A.I., et. al.: Rationale and design of the PERFECTION (comparison between stress cardiac computed tomography PERfusion versus Fractional flow rEserve measured by Computed Tomography angiography In the evaluation of suspected cOroNary artery disease) prospective study. J Cardiovasc Comput Tomogr 2016; 10: pp. 330-334.
6. Gerber T.C., Kantor B., McCollough C.H.: Radiation dose and safety in cardiac computed tomography. Cardiol Clin 2009; 27: pp. 665-677.
7. Pontone G., Andreini D., Bertella E., et. al.: Impact of an intra-cycle motion correction algorithm on overall evaluability and diagnostic accuracy of computed tomography coronary angiography. Eur Radiol 2016; 26: pp. 147-156.
8. Iyama Y., Nakaura T., Kidoh M., et. al.: Submillisievert radiation dose coronary CT angiography: clinical impact of the knowledge-based iterative model reconstruction. Acad Radiol 2016; 23: pp. 1393-1401.
9. Linsen P.V., Coenen A., Lubbers M.M., et. al.: Computed tomography angiography with a 192-slice dual-source computed tomography system: improvements in image quality and radiation dose. J Clin Imaging Sci 2016; 6: pp. 44.
10. Hausleiter J., Martinoff S., Hadamitzky M., et. al.: Image quality and radiation exposure with a low tube voltage protocol for coronary CT angiography results of the PROTECTION II Trial. JACC Cardiovasc Imaging 2010; 3: pp. 1113-1123.
11. Yin W.H., Lu B., Hou Z.H., et. al.: Detection of coronary artery stenosis with sub-milliSievert radiation dose by prospectively ECG-triggered high-pitch spiral CT angiography and iterative reconstruction. Eur Radiol 2013; 23: pp. 2927-2933.
12. Primak A.N., McCollough C.H., Bruesewitz M.R., et. al.: Relationship between noise, dose, and pitch in cardiac multi-detector row CT. Radiographics 2006; 26: pp. 1785-1794.
13. Leipsic J., Labounty T.M., Heilbron B., et. al.: Estimated radiation dose reduction using adaptive statistical iterative reconstruction in coronary CT angiography: the ERASIR study. AJR Am J Roentgenol 2010; 195: pp. 655-660.
14. Arcadi T., Maffei E., Mantini C., et. al.: Coronary CT angiography using iterative reconstruction vs. filtered back projection: evaluation of image quality. Acta Biomed 2015; 86: pp. 77-85.
15. Nelson R.C., Feuerlein S., Boll D.T.: New iterative reconstruction techniques for cardiovascular computed tomography: how do they work, and what are the advantages and disadvantages?. J Cardiovasc Comput Tomogr 2011; 5: pp. 286-292.
16. McQuiston A.D., Muscogiuri G., Schoepf U.J., et. al.: Approaches to ultra-low radiation dose coronary artery calcium scoring based on 3rd generation dual-source CT: a phantom study. Eur J Radiol 2016; 85: pp. 39-47.
17. General Electric : Revolution CT. Available at http://www3.gehealthcare.com.sg/en-gb/products/categories/computed_tomography/revolution_ct#
18. Kwon H., Cho J., Oh J., et. al.: The adaptive statistical iterative reconstruction-V technique for radiation dose reduction in abdominal CT: comparison with the adaptive statistical iterative reconstruction technique. Br J Radiol 2015; 88: pp. 20150463.
19. Kim H.G., Lee H.J., Lee S.K., et. al.: Image quality improvement with ASIR-V using a reduced radiation dose protocol for children. Eur Radiol 2017; 27: pp. 3609-3617.
20. Pontone G., Andreini D., Bartorelli A.L., et. al.: Feasibility and diagnostic accuracy of a low radiation exposure protocol for prospective ECG-triggering coronary MDCT angiography. Clin Radiol 2012; 67: pp. 207-215.
21. Pflederer T., Rudofsky L., Ropers D., et. al.: Image quality in a low radiation exposure protocol for retrospectively ECG-gated coronary CT angiography. AJR Am J Roentgenol 2009; 192: pp. 1045-1050.
22. Austen W.G., Edwards J.E., Frye R.L., et. al.: A reporting system on patients evaluated for coronary artery disease. Report of the Ad Hoc Committee for Grading of Coronary Artery Disease, Council on Cardiovascular Surgery, American Heart Association. Circulation 1975; 51: pp. 5-40.
23. Christner J.A., Kofler J.M., McCollough C.H.: Estimating effective dose for CT using dose-length product compared with using organ doses: consequences of adopting International Commission on Radiological Protection publication 103 or dual-energy scanning. AJR Am J Roentgenol 2010; 194: pp. 881-889.
24. Benz D.C., Grani C., Mikulicic F., et. al.: Adaptive statistical iterative reconstruction-V: impact on image quality in ultralow-dose coronary computed tomography angiography. J Comput Assist Tomogr 2016; 40: pp. 958-963.
25. Cademartiri F., de Monye C., Pugliese F., et. al.: High iodine concentration contrast material for noninvasive multislice computed tomography coronary angiography: iopromide 370 versus iomeprol 400. Invest Radiol 2006; 41: pp. 349-353.
26. Schwarz F., Grandl K., Arnoldi A., et. al.: Lowering radiation exposure in CT angiography using automated tube potential selection and optimized iodine delivery rate. AJR Am J Roentgenol 2013; 200: pp. W628-W634.
27. Fuchs T.A., Fiechter M., Gebhard C., et. al.: CT coronary angiography: impact of adapted statistical iterative reconstruction (ASIR) on coronary stenosis and plaque composition analysis. Int J Cardiovasc Imaging 2013; 29: pp. 719-724.
28. Leipsic J., Labounty T.M., Heilbron B., et. al.: Adaptive statistical iterative reconstruction: assessment of image noise and image quality in coronary CT angiography. AJR Am J Roentgenol 2010; 195: pp. 649-654.
29. Guaricci A.I., Schuijf J.D., Cademartiri F., et. al.: Incremental value and safety of oral ivabradine for heart rate reduction in computed tomography coronary angiography. Int J Cardiol 2012; 156: pp. 28-33.
30. Guaricci A.I., Maffei E., Brunetti N.D., et. al.: Heart rate control with oral ivabradine in computed tomography coronary angiography: a randomized comparison of 7.5 mg vs 5 mg regimen. Int J Cardiol 2013; 168: pp. 362-368.
31. Raju V.M., Gosling O.E., Morgan-Hughes G., et. al.: High-dose intravenous metoprolol usage for reducing heart rate at CT coronary angiography: efficacy and safety. Clin Radiol 2014; 69: pp. 739-744.
32. Mangold S., Cannao P.M., Schoepf U.J., et. al.: Impact of an advanced image-based monoenergetic reconstruction algorithm on coronary stent visualization using third generation dual-source dual-energy CT: a phantom study. Eur Radiol 2016; 26: pp. 1871-1878.
33. Zhao L., Plank F., Kummann M., et. al.: Improved non-calcified plaque delineation on coronary CT angiography by sonogram-affirmed iterative reconstruction with different filter strength and relationship with BMI. Cardiovasc Diagn Ther 2015; 5: pp. 104-112.
34. Puchner S.B., Ferencik M., Maehara A., et. al.: Iterative image reconstruction improves the accuracy of automated plaque burden assessment in coronary CT angiography: a comparison with intravascular ultrasound. AJR Am J Roentgenol 2017; pp. 1-8.