
Rationale and Objectives
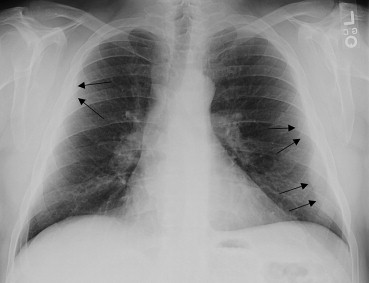
Subpleural fat can be difficult to distinguish from localized pleural thickening (LPT), a marker of asbestos exposure, on chest radiographs. The aims of this study were to examine the influence of body mass index (BMI) on the performance of radiograph readers when classifying LPT and to model the risk of false test results with varying BMI.
Materials and Methods
Subjects ( n = 200) were patients being screened or treated for asbestos-related health outcomes. A film chest radiograph, a digital chest radiograph, and a high-resolution computed tomography (HRCT) chest scan were collected from each subject. All radiographs were independently read by seven B readers and scored using the International Labour Office system. HRCT scans, read by three experienced thoracic radiologists, served as the gold standard for the presence of LPT. We calculated measures of radiograph reader performance, including sensitivity and specificity, for each image modality. We also used logistic regression to estimate the probability of a false-positive and a false-negative result while controlling for covariates.
Results
The proportion of false-positive readings correlated with BMI. While controlling for covariates, regression modeling showed the probability of a false-positive result increased with increasing BMI category, younger age, not having pleural calcification, and among subjects not reporting occupational or household contact asbestos exposure.
Conclusions
Clinicians should be cautious when evaluating radiographs of younger obese persons for the presence of asbestos-related pleural plaque, particularly in populations having an anticipated low or background prevalence of LPT.
Localized pleural thickening (LPT) is the most common health outcome associated with inhalation exposure to asbestos . The chest radiograph is the most frequently used modality to screen for asbestos-associated abnormalities, including LPT. However, it can be difficult to distinguish LPT from subpleural fat on chest radiographs and increased body mass index (BMI) has been associated with apparent pleural thickening .
Libby, Montana, was the site of a vermiculite mining and processing operation throughout much of the 20th century. Although vermiculite from other sources has not been linked to adverse health effects, Libby vermiculite contained elongate mineral particles comprising a mixture of asbestiform amphiboles, including winchite, richterite, and tremolite asbestos . In addition to occupational asbestos exposures at the Libby vermiculite operation, exposures also occurred among household contacts of those workers, and numerous exposure pathways existed for other residents of Libby . Consistent with pervasive asbestos exposures, radiographic surveys have found pleural abnormalities among these vermiculite workers and their families and among other Libby residents .
Get Radiology Tree app to read full this article<
Materials and methods
Subjects and Radiologic Image Reading
Get Radiology Tree app to read full this article<
Outcome Definitions
Get Radiology Tree app to read full this article<
Covariate Definitions
Get Radiology Tree app to read full this article<
Analysis
Get Radiology Tree app to read full this article<
Results
Get Radiology Tree app to read full this article<
Table 1
Characteristics of Subjects by BMI Category ( n [Row Percent], Unless Otherwise Specified)
BMI Category Normal (<25.0 kg/m 2 ) Overweight (25.0–29.9 kg/m 2 ) Obese (30.0–39.9 kg/m 2 ) Morbidly Obese (≥40.0 kg/m 2 ) All All 23 (12) 65 (33) 95 (48) 17 (9) 200 Gender Male 17 (12) 46 (32) 71 (50) 9 (6) 143 Female 6 (11) 19 (33) 24 (42) 8 (14) 57 Current or ex-smoker 16 (12) 46 (35) 60 (45) 11 (8) 133 Exposure category Occupational 4 (9) 9 (20) 28 (61) 5 (11) 46 Household contact 8 (16) 17 (33) 23 (45) 3 (6) 51 Residential 11 (11) 39 (38) 44 (43) 9 (9) 103 Age category Median 54.5 64.7 64.7 62.7 63.1 Minimum 37.1 40.0 39.7 46.7 37.1 Maximum 89.5 86.9 82.0 85.9 89.5 Right hemithoraces with LPT confirmed by HRCT 13 (17) 25 (33) 34 (44) 5 (7) 77 Left hemithoraces with LPT confirmed by HRCT 12 (16) 23 (31) 34 (46) 5 (7) 74
BMI, body mass index; HRCT, high-resolution computed tomography; LPT, localized pleural thickening.
Row percentages may not add to 100% due to rounding.
Get Radiology Tree app to read full this article<
Get Radiology Tree app to read full this article<
Table 2
Performance of Film and Digital Radiograph Readers for Detecting LPT, Overall and Stratified by BMI Category, Estimated Using GEE Modeling without Covariates (95% CI)
Parameter All Readings Normal Overweight Obese Morbidly Obese Film Sensitivity 0.60 (0.53–0.66) 0.51 (0.35–0.67) 0.57 (0.44–0.69) 0.66 (0.56–0.74) 0.53 (0.31–0.74) Specificity 0.66 (0.62–0.71) 0.77 (0.62–0.87) 0.76 (0.70–0.82) 0.60 (0.53–0.66) 0.59 (0.48–0.69) FP 0.48 (0.40–0.56) 0.28 (0.12–0.51) 0.42 (0.28–0.57) 0.53 (0.41–0.64) 0.65 (0.37–0.86) FN 0.27 (0.21–0.34) 0.43 (0.24–0.65) 0.25 (0.16–0.37) 0.24 (0.16–0.34) 0.25 (0.11–0.48) PPV 0.52 (0.44–0.60) 0.72 (0.49–0.88) 0.58 (0.43–0.72) 0.48 (0.37–0.59) 0.35 (0.14–0.63) NPV 0.73 (0.66–0.79) 0.57 (0.35–0.76) 0.75 (0.63–0.84) 0.76 (0.66–0.84) 0.75 (0.52–0.89) 1−Sensitivity 0.40 (0.34–0.47) 0.49 (0.33–0.66) 0.43 (0.31–0.56) 0.34 (0.26–0.44) 0.47 (0.26–0.69) 1−Specificity 0.34 (0.29–0.38) 0.23 (0.13–0.38) 0.24 (0.18–0.31) 0.41 (0.34–0.47) 0.41 (0.31–0.52) Digital Sensitivity 0.61 (0.54–0.67) 0.56 (0.41–0.70) 0.62 (0.50–0.73) 0.63 (0.52–0.73) 0.46 (0.23–0.70) Specificity 0.69 (0.64–0.73) 0.77 (0.60–0.88) 0.75 (0.68–0.81) 0.64 (0.56–0.70) 0.65 (0.50–0.77) FP 0.46 (0.38–0.54) 0.26 (0.11–0.50) 0.41 (0.28–0.55) 0.51 (0.39–0.63) 0.65 (0.35–0.86) FN 0.26 (0.20–0.33) 0.41 (0.22–0.62) 0.23 (0.15–0.34) 0.24 (0.16–0.35) 0.26 (0.11–0.50) PPV 0.54 (0.46–0.62) 0.74 (0.50–0.89) 0.59 (0.45–0.72) 0.49 (0.38–0.61) 0.35 (0.14–0.65) NPV 0.74 (0.68–0.80) 0.60 (0.38–0.78) 0.77 (0.66–0.86) 0.76 (0.65–0.84) 0.74 (0.50–0.89) 1−Sensitivity 0.40 (0.33–0.47) 0.44 (0.30–0.59) 0.38 (0.27–0.50) 0.37 (0.27–0.48) 0.54 (0.30–0.77) 1−Specificity 0.31 (0.27–0.36) 0.23 (0.12–0.40) 0.25 (0.19–0.32) 0.37 (0.30–0.44) 0.35 (0.23–0.50)
BMI, body mass index; CI, confidence interval; FP, false positive (1−PPV); FN, false negative (1−NPV); GEE, generalized estimating equations; HRCT, high-resolution computed tomography; LPT, localized pleural thickening; NPV, negative predictive value; PPV, positive predictive value.
*Predictive values are dependent on disease prevalence , which can be varied to illustrate the impact of prevalence. The prevalences of LPT on HRCT by BMI category as shown in Table 1 were used to calculate PPVs and NPVs shown in Table 2 . To examine the impact of a theoretical prevalence, one could calculate predictive values using these equations: PPV = (Sensitivity*Prevalence)/(Sensitivity*Prevalence+[1−Specificity]*[1−Prevalence]) or NPV = Specificity*(1−Prevalence)/(Specificity*[1−Prevalence]+[1−Sensitivity]*Prevalence).
Get Radiology Tree app to read full this article<
Get Radiology Tree app to read full this article<
Table 3
GEE Models for BMI as a Categorical and Continuous Variable, with Covariates, for the Risk of False-Positive (1−PPV) LPT Detection on Film Radiographs
Parameter Beta Estimate Standard Error Odds Ratio (95% CI) Chi-squared_P_ Value Categorical model Intercept 2.6537 1.2257 — 4.71 .03 Age −0.0512 0.0185 — 7.62 .01 Morbidly obese versus normal 1.9045 0.7238 6.7 (1.6–27.7) 6.92 .01 Obese versus normal 1.4787 0.5931 4.4 (1.4–14.0) 6.20 .01 Overweight versus normal 0.9674 0.6419 2.6 (0.8–9.3) 2.28 .13 Exposure (worker or household vs. residential) −0.7253 0.3460 0.5 (0.2–1.0) 4.41 .04 Pleural calcification −0.9249 0.3082 0.4 (0.2–0.7) 9.00 <.01 Continuous model Intercept 1.5808 1.4022 — 1.28 .26 Age −0.0465 0.0181 — 6.60 .01 BMI 0.0616 0.0255 — 5.81 .02 Exposure (worker or household vs. residential) −0.7064 0.3442 0.5 (0.3–1.0) 4.20 .04 Pleural calcification −0.8733 0.2979 0.4 (0.2–0.7) 8.58 <.01
BMI, body mass index; CI, confidence interval; GEE, generalized estimating equations; LPT, localized pleural thickening; PPV, positive predictive value.
Get Radiology Tree app to read full this article<
Get Radiology Tree app to read full this article<
Table 4
GEE Estimates of Probabilities of False-Positive LPT Detection on Film Radiographs for Various Covariate Combinations
Covariate Combination Estimate (95% CI) Chi-squared_P_ Value BMI effect for age 63 years and exposed occupationally or as a household contact Morbidly obese 0.65 (0.40–0.82) 1.39 .24 Obese 0.55 (0.40–0.61) 0.36 .55 Overweight 0.42 (0.25–0.53) 0.70 .40 Normal 0.21 (0.09–0.36) 0.44 .02 Age effect for normal BMI and not exposed occupationally or as a household contact at Age 83 years 0.17 (0.050.45) 4.91 .03 Age 73 years 0.25 (0.09–0.53) 3.04 .08 Age 63 years 0.36 (0.16–0.63) 1.01 .31 Age 53 years 0.49 (0.24–0.74) 0.01 .92 Exposure effect for age 63 years and normal BMI Occupational or household contact 0.21 (0.09–0.44) 5.65 .02 Residential 0.36 (0.16–0.63) 1.01 .31 Pleural calcification effect for age 63 years, normal BMI and not exposed occupationally or as a household contact Calcification present 0.18 (0.06–0.45) 4.98 .03 Calcification not present 0.36 (0.16–0.63) 1.01 .31
BMI, body mass index; CI, confidence interval; GEE, generalized estimating equations; LPT, localized pleural thickening.
The chi-squared and P -value results are from testing the hypothesis that the probability estimate is significantly different from that obtained by chance (i.e., a probability of 0.50).
Get Radiology Tree app to read full this article<
Get Radiology Tree app to read full this article<
Table 5
GEE Model with Covariates for the Risk of False-Negative (1−PPV) LPT Detection on Film Radiographs
Parameter Beta Estimate Standard Error Odds Ratio (95% CI) Chi-squared_P_ Value Intercept −1.9642 1.0544 — 3.46 .06 Age 0.0226 0.0165 — 1.90 .17 Morbidly obese versus normal −0.7979 0.7104 0.5 (0.1–1.8) 1.25 .26 Obese versus normal −0.9319 0.5595 0.4 (0.1–1.2) 2.79 .10 Overweight versus normal −0.8089 0.5777 0.4 (0.1–1.4) 1.96 .16 Exposure (occupational or household) 0.6219 0.3408 1.8 (1.0–3.6) 3.31 .07
CI, confidence interval; GEE, generalized estimating equations; LPT, localized pleural thickening; PPV, positive predictive value.
Table 6
GEE Estimates of Probabilities of False-Negative LPT Detection on Film Radiographs for Various Covariate Combinations
Covariate Combination Estimate (95% CI) Chi-squared_P_ Value BMI effect for age 63 years and exposed occupationally or as a household contact Morbidly obese 0.33 (0.14–0.59) 1.71 .19 Obese 0.30 (0.20–0.43) 8.70 <.01 Overweight 0.33 (0.20–0.49) 4.36 .04 Normal 0.52 (0.28–0.75) 0.03 .87 Age effect for normal weight and not exposed occupationally as a household contact 83 years 0.48 (0.20–0.78) 0.02 .90 73 years 0.42 (0.19–0.70) 0.29 .59 63 years 0.37 (0.17–0.62) 1.05 .30 53 years 0.32 (0.15–0.56) 2.21 .14 Exposure effect for age 63 years and normal weight Residential 0.52 (0.28–0.75) 0.03 .87 Occupational or household contact 0.37 (0.17–0.62) 1.05 .30
BMI, body mass index; CI, confidence interval; GEE, generalized estimating equations; LPT, localized pleural thickening.
The chi-squared and P -value results are from testing the hypothesis that the probability estimate is significantly different that obtained by chance (i.e., a probability of 0.50).
Get Radiology Tree app to read full this article<
Get Radiology Tree app to read full this article<
Get Radiology Tree app to read full this article<
Discussion
Get Radiology Tree app to read full this article<
Get Radiology Tree app to read full this article<
Get Radiology Tree app to read full this article<
Get Radiology Tree app to read full this article<
Get Radiology Tree app to read full this article<
Get Radiology Tree app to read full this article<
Get Radiology Tree app to read full this article<
Appendix
Get Radiology Tree app to read full this article<
Get Radiology Tree app to read full this article<
logitP[Yij=1|Dij=1,Xij1,…,XijK]=βD+0+∑Kk=1βD+kXijk logit
P
[
Y
ij
=
1
|
D
ij
=
1
,
X
ij
1
,
…
,
X
ijK
]
=
β
0
D
+
+
∑
k
=
1
K
β
k
D
+
X
ijk
Get Radiology Tree app to read full this article<
Get Radiology Tree app to read full this article<
logitP[Yij=0|Dij=0,Xij1,…,XijK]=βD−0+∑Kk=1βD−kXijk logit
P
[
Y
ij
=
0
|
D
ij
=
0
,
X
ij
1
,
…
,
X
ijK
]
=
β
0
D
−
+
∑
k
=
1
K
β
k
D
−
X
ijk
Get Radiology Tree app to read full this article<
Get Radiology Tree app to read full this article<
Get Radiology Tree app to read full this article<
Get Radiology Tree app to read full this article<
Sensitivity={1+exp[−(βD+0+∑Kk=1βD+kXijk)]}−1 Sensitivity
=
{
1
+
exp
[
−
(
β
0
D
+
+
∑
k
=
1
K
β
k
D
+
X
ijk
)
]
}
−
1
Get Radiology Tree app to read full this article<
Get Radiology Tree app to read full this article<
Specificity={1+exp[−(βD−0+∑Kk=1βD−kXijk)]}−1 Specificity
=
{
1
+
exp
[
−
(
β
0
D
−
+
∑
k
=
1
K
β
k
D
−
X
ijk
)
]
}
−
1
Get Radiology Tree app to read full this article<
References
1. Light R.W.: Pleural diseases.Fifth ed2007.Lippincott Williams & WilkinsPhiladelphia
2. Sargent E.N., Boswell W.D., Ralls P.W., et. al.: Subpleural fat pads in patients exposed to asbestos: distinction from non-calcified pleural plaques. Radiology 1984; 152: pp. 273-277.
3. Vix V.A.: Extrapleural costal fat. Radiology 1974; 112: pp. 563-565.
4. Lee Y.C., Runnion C.K., Pang S.C., et. al.: Increased body mass index is related to apparent circumscribed pleural thickening on plain chest radiographs. Am J Ind Med 2001; 39: pp. 112-116.
5. Antao V.C., Larson T.C., Horton D.K.: Libby vermiculite exposure and risk of developing asbestos-related lung and pleural diseases. Curr Opin Pulm Med 2012; 18: pp. 161-167.
6. Peipins L.A., Lewin M., Campolucci S., et. al.: Radiographic abnormalities and exposure to asbestos-contaminated vermiculite in the community of Libby, Montana, USA. Environ Health Perspect 2003; 111: pp. 1753-1759.
7. Whitehouse A.C.: Asbestos-related pleural disease due to tremolite associated with progressive loss of lung function: serial observations in 123 miners, family members, and residents of Libby, Montana. Am J Ind Med 2004; 46: pp. 219-225.
8. Larson T.C., Holiday D.B., Antao V.C., et. al.: Comparison of digital with film radiographs for the classification of pneumoconiotic pleural abnormalities. Acad Radiol 2011; 19: pp. 131-140.
9. ILO: Guidelines for the use of the ILO International Classification of Radiographs of Pneumoconioses.2000 Edition2002.International Labour OfficeGeneva
10. Kusaka Y., Hering K.G., Parker J.E.: HRCT for occupational and environmental respiratory diseases.2005.SpringerTokyo
11. Executive summary of the clinical guidelines on the identification, evaluation, and treatment of overweight and obesity in adults. Arch Intern Med 1998; 158: pp. 1855-1867.
12. Hanley J.A., Negassa A., Edwardes M.D., et. al.: Statistical analysis of correlated data using generalized estimating equations: an orientation. Am J Epidemiol 2003; 157: pp. 364-375.
13. Coughlin S.S., Trock B., Criqui M.H., et. al.: The logistic modeling of sensitivity, specificity, and predictive value of a diagnostic test. J Clin Epidemiol 1992; 45: pp. 1-7.
14. Pepe M.S., Whitaker R.C., Seidel K.: Estimating and comparing univariate associations with application to the prediction of adult obesity. Stat Med 1999; 18: pp. 163-173.
15. Gottschall E.B., Newman L.S.: Benign asbestos-related pleural disease.Bouros D.Lung biology and disease: Pleural disease.2004.Marcel Dekker, Inc.New York, NY:pp. 534-558.
16. Frumkin H., Pransky G., Cosmatos I.: Radiologic detection of pleural thickening. Am Rev Respir Dis 1990; 142: pp. 1325-1330.
17. Algranti E., Mendonca E.M., DeCapitani E.M., et. al.: Non-malignant asbestos-related diseases in Brazilian asbestos-cement workers. Am J Ind Med 2001; 40: pp. 240-254.
18. Shepherd J.R., Hillerdal G., McLarty J.: Progression of pleural and parenchymal disease on chest radiographs of workers exposed to amosite asbestos. Occup Environ Med 1997; 54: pp. 410-415.
19. de Klerk N.H., Cookson W.O., Musk A.W., et. al.: Natural history of pleural thickening after exposure to crocidolite. Br J Ind Med 1989; 46: pp. 461-467.
20. Dietz W.H., Bellizzi M.C.: Introduction: the use of body mass index to assess obesity in children. Am J Clin Nutr 1999; 70: pp. 123S-125S.
21. Ameille J., Mattei N., Laurent F., et. al.: Computed tomography findings in urban transportation workers with low cumulative asbestos exposure. Int J Tuberc Lung Dis 2007; 11: pp. 1352-1357.
22. Friedman A.C., Fiel S.B., Fisher M.S., et. al.: Asbestos-related pleural disease and asbestosis: a comparison of CT and chest radiography. AJR Am J Roentgenol 1988; 150: pp. 269-275.
23. Flegal K.M., Carroll M.D., Kit B.K., et. al.: Prevalence of obesity and trends in the distribution of body mass index among US adults, 1999-2010. JAMA 2012; 307: pp. 491-497.
24. Choi B., Schnall P.L., Yang H., et. al.: Sedentary work, low physical job demand, and obesity in US workers. Am J Ind Med 2010; 53: pp. 1088-1101.
25. Lewis C.E., McTigue K.M., Burke L.E., et. al.: Mortality, health outcomes, and body mass index in the overweight range: a science advisory from the American Heart Association. Circulation 2009; 119: pp. 3263-3271.
26. Stern E.J., White C.S.: Pleural diseases.Stern E.J.White C.S.Chest radiology companion.1999.Lippincott Williams & WilkinsPhiladelphia:pp. 373-400.
27. Altman D.G., Bland J.M.: Diagnostic tests 2: Predictive values. BMJ 1994; 309: pp. 102.