
Rationale and Objectives
To prospectively compare four contrast material injection protocols for dual-energy computed tomography (CT) pulmonary angiography (DE-CTPA) in patients with suspected pulmonary embolism (PE).
Materials and Methods
One hundred twenty consecutive patients were randomized to contrast material injection protocols defined by different iodine concentrations and iodine delivery rates (IDRs): (A) 80 mL iopromide 370/4 mL/sec = IDR 1.4 gI/sec; (B) 80 mL iopromide 370 at 3 mL/sec = IDR 1.1 gI/sec; (C) 98 mL iopromide 300 at 4.9 mL/sec = IDR 1.4 gI/sec; and (D) 98 mL iopromide 300 at 3.7 mL/sec = IDR 1.1 gI/sec. Attenuation values were measured in the inflow tract (subclavian vein–superior vena cava–right atrium), target tract (right ventricle–pulmonary trunk–pulmonary arteries), and outflow tract (left atrium–left ventricle–ascending aorta). Two readers assessed subjective image quality of CTPA images and iodine perfusion maps. The number of artifacts due to hyperdense contrast material on iodine perfusion maps was recorded.
Results
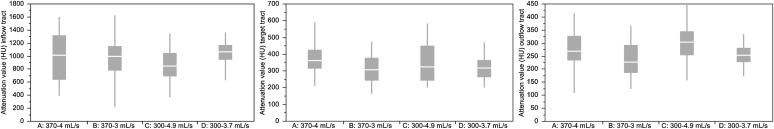
Target tract attenuation was highest for protocol A with 374 ± 98 Hounsfield units (HU) (highly concentrated contrast material/high IDR). This was significant compared to protocols B and D ( P = .0118, P = .0427) but not compared to protocol C ( P = .3395). No significant difference in target tract attenuation was found between protocols B (309 ± 80 HU), protocol C (352 ± 119 HU), and D (325 ± 74 HU). CTPA and iodine perfusion map image quality for protocol A was rated significantly higher compared to all other protocols (median score = 5/4; P < .0001 for both) with moderate interreader agreement (κ = 0.58/0.47). Protocols A and B displayed increased artifacts on iodine perfusion maps compared to protocols C and D (3 versus 2).
Conclusion
Despite increased artifacts on iodine perfusion maps, highly concentrated iodinated contrast material combined with high flow rates provides improved diagnostic image quality and has the highest target-tract attenuation for DE-CTPA protocols.
Diagnostic imaging plays a pivotal role in the diagnosis of pulmonary embolism (PE). In daily clinical routine, computed tomography (CT) pulmonary angiography (CTPA) has become the imaging modality of choice for the diagnosis of PE owing to its high spatial resolution, ready availability, and proven high diagnostic accuracy . CTPA allows for excellent diagnostic accuracy in detecting intravascular emboli in addition to providing valuable information concerning cardiopulmonary anatomy and pathology, including the presence of right ventricular dysfunction in patients with PE .
Dual-energy CT (DECT) examinations allow selective visualization of contrast material in tissues by taking advantage of the spectral properties of iodine . Thus, dual-energy CTPA (DE-CTPA) allows for a comprehensive pulmonary evaluation combining traditional CTPA for morphologic information and iodine-based perfusion maps for functional evaluation. The application of DE-CTPA in PE has shown promising results; however, all studies have reported a high incidence of contrast material–related beam-hardening artifacts . Beam-hardening artifacts may produce false-positive results or obscure true-positive findings. In turn, this limits both the sensitivity and the specificity of the technique . In an effort to enhance diagnostic quality of DE-CTPA scans, the contrast material delivery protocol has to be adjusted . DE-CTPA scans require a uniquely tailored protocol aimed at maximum pulmonary arterial and parenchymal enhancement while also minimizing contrast material–related beam hardening artifacts . In addition to a high attenuation in the large pulmonary arteries, a high attenuation of the pulmonary parenchyma is also required. Protocols strive to avoid high attenuation in the inflow vessels such as the subclavian vein and the superior vena cava to reduce beam-hardening artifacts.
Get Radiology Tree app to read full this article<
Get Radiology Tree app to read full this article<
Materials and methods
Patients
Get Radiology Tree app to read full this article<
Contrast Material Injection Protocols
Get Radiology Tree app to read full this article<
Table 1
Contrast Material Injection Protocols
Group Contrast Material Iodine Concentration (mg/mL) Total Volume (mL) Injection Rate (mL/sec) Iodine Delivery Rate (gI/sec) Injection Time (s) Total Iodine Load (g) A Iopromide 370 370 80 4 1.4 20 29.6 B Iopromide 370 370 80 3 1.1 26.7 29.6 C Iopromide 300 300 98 4.9 1.4 20 29.4 D Iopromide 300 300 98 3.7 1.1 26.5 29.4
Get Radiology Tree app to read full this article<
Get Radiology Tree app to read full this article<
Scanning Protocol
Get Radiology Tree app to read full this article<
Image Analysis
Get Radiology Tree app to read full this article<
Objective Image Quality
DE-CTPA images
Get Radiology Tree app to read full this article<
Iodine-based perfusion maps
Get Radiology Tree app to read full this article<
Get Radiology Tree app to read full this article<
Subjective Image Quality
DE-CTPA image quality rating
Get Radiology Tree app to read full this article<
Iodine-based perfusion map rating
Get Radiology Tree app to read full this article<
Get Radiology Tree app to read full this article<
Statistical analysis
Get Radiology Tree app to read full this article<
Results
Get Radiology Tree app to read full this article<
Get Radiology Tree app to read full this article<
Table 2
Patient Demographics
Group N Male/Female Gender Age (yr) Height (cm) Weight (kg) BMI (kg/m 2 ) A 30 14/16 68 ± 11 167 ± 9 74.7 ± 16.2 27 ± 6 B 30 14/16 69 ± 16 169 ± 7 74.8 ± 18.1 26 ± 6 C 30 19/11 61 ± 12 170 ± 9 80.4 ± 16.9 27 ± 5 D 30 14/16 69 ± 15 170 ± 9 77.5 ± 18.5 27 ± 7
BMI, body mass index.
Get Radiology Tree app to read full this article<
Objective Image Quality
DE-CTPA attenuation values
Get Radiology Tree app to read full this article<
Table 3
Attenuation Values (in Hounsfield Units) at Various Anatomic Levels as Measured on 120-kV “Virtual” Computed Tomography Angiography of the Lungs
Vessel Segment Group A Group B Group C Group D Subclavian vein 1538 ± 843 1816 ± 613 1465 ± 667 1923 ± 443 Superior vena cava 815 ± 355 824 ± 361 775 ± 408 780 ± 207 Right atrium 437 ± 126 363 ± 115 402 ± 156 387 ± 106 Right ventricle 352 ± 110 295 ± 96 352 ± 120 305 ± 72 Pulmonary trunk 388 ± 101 319 ± 77 358 ± 127 334 ± 77 Right pulmonary artery 379 ± 101 311 ± 79 347 ± 117 329 ± 77 Left pulmonary artery 377 ± 96 311 ± 76 351 ± 125 332 ± 75 Left atrium 287 ± 74 242 ± 65 314 ± 75 261 ± 44 Left ventricle 241 ± 84 217 ± 63 275 ± 73 236 ± 39 Ascending aorta 303 ± 83 250 ± 67 316 ± 82 273 ± 46 Inflow tract 930 ± 344 1001 ± 318 880 ± 300 1030 ± 199 Target tract 374 ± 98 309 ± 80 352 ± 119 325 ± 74 Outflow tract 277 ± 75 236 ± 64 302 ± 74 257 ± 41 Pulmonary parenchyma 27 ± 7 23 ± 5 24 ± 5 23 ± 5
To provide comprehensive results, vessel segments were consolidated as follows—inflow tract: subclavian vein, superior vena cava, and right atrium; target tract: right ventricle, pulmonary trunk, and pulmonary arteries; outflow tract: left atrium, left ventricle, and ascending aorta. Note that a high target tract attenuation in combination with a low inflow tract attenuation should indicate superior image quality.
Get Radiology Tree app to read full this article<
Get Radiology Tree app to read full this article<
Get Radiology Tree app to read full this article<
Get Radiology Tree app to read full this article<
Get Radiology Tree app to read full this article<
Table 4
Individual Protocol Comparison
A (370-4 mL/sec) vs B (370-3 mL/sec) A (370-4 mL/sec) vs C (300-4.9 mL/sec) A (370-4 mL/sec) vs D (300-3.7 mL/sec) B (370-3 mL/sec) vs C (300-4.9 mL/sec) B (370-3 mL/sec) vs D (300-3.7 mL/sec) C (300-4.9 mL/sec) vs D (300-3.7 mL/sec) Inflow tract 930 ± 344 vs 1001 ± 318 930 ± 344 vs 880 ± 300 930 ± 344 vs 1030 ± 199 1001 ± 318 vs 880 ± 300 1001 ± 318 vs 1030 ± 199 880 ± 300 vs 1030 ± 199P value .42 .51 .32 .09 .49.01 Target tract 374 ± 98 vs 309 ± 80 374 ± 98 vs 352 ± 119 374 ± 98 vs 325 ± 74 309 ± 80 vs 352 ± 119 309 ± 80 vs 325 ± 74 352 ± 119 vs 325 ± 74P value.01 .33.04 .34 .43 .64 Outflow tract 277 ± 75 vs 236 ± 64 277 ± 75 vs 302 ± 74 277 ± 75 vs 257 ± 41 236 ± 64 vs 302 ± 74 236 ± 64 vs 257 ± 41 302 ± 74 vs 257 ± 41P value.01 .20 .42.0009 .07.008
Inflow tract includes subclavian vein, superior vena cava, and right atrium; target tract includes right ventricle, pulmonary trunk and pulmonary arteries; outflow tract includes left atrium, left ventricle, and ascending aorta.
Note that bold print indicates significant results.
Get Radiology Tree app to read full this article<
Iodine-based perfusion map attenuation
Get Radiology Tree app to read full this article<
Table 5
Iodine-Based Perfusion Map and Dual-Energy Computed Tomography Pulmonary Angiography (DE-CTPA) Subjective and Objective Image Quality Criteria
Iodine-Based Perfusion Maps Group A Group B Group C Group D Parenchyma overlay (HU ± SD) 26.7 ± 6.8 23.4 ± 5.5 24.0 ± 5 22.8 ± 5.5 Average number of beam hardening artifacts (minimum–maximum) 3 (1–4) 3 (3–3) 2 (1–4) 2 (2–2) Image quality Reader A (minimum–maximum) 4 (3–5) 3 (3–4) 3 (2–4) 3 (2–3) Image quality Reader B (minimum–maximum) 5 (3–5) 3 (3–5) 3 (3–5) 3 (2–3) DE-CTPA image quality median score (minimum–maximum) Reader A 5 (3–5) 3 (2–5) 4 (3–4) 3 (3–4) Reader B 5 (3–5) 3 (3–5) 3 (3–5) 3 (2–4)
HU, Hounsfield units; SD, standard deviation.
Get Radiology Tree app to read full this article<
Subjective Image Quality
DE-CTPA image quality rating
Get Radiology Tree app to read full this article<
Get Radiology Tree app to read full this article<
Get Radiology Tree app to read full this article<
Get Radiology Tree app to read full this article<
Iodine-based perfusion map image quality and number of beam-hardening artifacts
Get Radiology Tree app to read full this article<
Get Radiology Tree app to read full this article<
Get Radiology Tree app to read full this article<
Get Radiology Tree app to read full this article<
Get Radiology Tree app to read full this article<
Discussion
Get Radiology Tree app to read full this article<
Get Radiology Tree app to read full this article<
Get Radiology Tree app to read full this article<
Get Radiology Tree app to read full this article<
Get Radiology Tree app to read full this article<
Get Radiology Tree app to read full this article<
Get Radiology Tree app to read full this article<
Get Radiology Tree app to read full this article<
References
1. Henzler T., Schoenberg S.O., Schoepf U.J., et. al.: Diagnosing acute pulmonary embolism: systematic review of evidence base and cost-effectiveness of imaging tests. J Thorac Imaging 2012; 27: pp. 304-314.
2. Remy-Jardin M., Pistolesi M., Goodman L.R., et. al.: Management of suspected acute pulmonary embolism in the era of CT angiography: a statement from the Fleischner Society. Radiology 2007; 245: pp. 315-329.
3. Henzler T., Roeger S., Meyer M., et. al.: Pulmonary embolism: CT signs and cardiac biomarkers for predicting right ventricular dysfunction. Eur Respir J 2012; 39: pp. 919-926.
4. Johnson T.R., Krauss B., Sedlmair M., et. al.: Material differentiation by dual energy CT: initial experience. Eur Radiol 2007; 17: pp. 1510-1517.
5. Fink C., Johnson T.R., Michaely H.J., et. al.: Dual-energy CT angiography of the lung in patients with suspected pulmonary embolism: initial results. ROFO Fortschr Geb Rontgenstr Nuklearmed 2008; 180: pp. 879-883.
6. Krissak R., Henzler T., Reichert M., et. al.: Enhanced visualization of lung vessels for diagnosis of pulmonary embolism using dual energy CT angiography. Invest Radiol 2010; 45: pp. 341-346.
7. Nance J.W., Henzler T., Meyer M., et. al.: Optimization of contrast material delivery for dual-energy computed tomography pulmonary angiography in patients with suspected pulmonary embolism. Invest Radiol 2012 Jan; 47: pp. 78-84.
8. Pontana F., Faivre J.B., Remy-Jardin M., et. al.: Lung perfusion with dual-energy multidetector-row CT (MDCT): feasibility for the evaluation of acute pulmonary embolism in 117 consecutive patients. Acad Radiol 2008; 15: pp. 1494-1504.
9. Thieme S.F., Johnson T.R., Lee C., et. al.: Dual-energy CT for the assessment of contrast material distribution in the pulmonary parenchyma. AJR Am J Roentgenol 2009; 193: pp. 144-149.
10. Yang G.F., Yang X., Zhang L.J., et. al.: Pulmonary enhancement imaging with dual energy CT for the detection of pulmonary embolism in a rabbit model: comparison to perfusion planar scintigraphy, SPECT and SPECT-CT modalities. Acad Radiol 2011; 18: pp. 605-614.
11. Chae E.J., Seo J.B., Jang Y.M., et. al.: Dual-energy CT for assessment of the severity of acute pulmonary embolism: pulmonary perfusion defect score compared to CT angiographic obstruction score and right ventricular/left ventricular diameter ratio. AJR Am J Roentgenol 2010; 194: pp. 604-610.
12. Bauer R.W., Kramer S., Renker M., et. al.: Dose and image quality at CT pulmonary angiography-comparison of first and second generation dual-energy CT and 64-slice CT. Eur Radiol 2011; 21: pp. 2139-2147.
13. Behrendt F.F., Bruners P., Keil S., et. al.: Effect of different saline chaser volumes and flow rates on intravascular contrast enhancement in CT using a circulation phantom. Eur J Radiol 2010; 73: pp. 688-693.
14. Goodman L.R., Gulsun M., Nagy P., et. al.: CT of deep venous thrombosis and pulmonary embolus: does iso-osmolar contrast agent improve vascular opacification?. Radiology 2005; 234: pp. 923-928.
15. Kerl J.M., Bauer R.W., Renker M., et. al.: Triphasic contrast injection improves evaluation of dual energy lung perfusion in pulmonary CT angiography. Eur J Radiol 2011; 80: pp. e483-e487.
16. Bae K.T.: Intravenous contrast medium administration and scan timing at CT: considerations and approaches. Radiology 2010; 256: pp. 32-61.
17. Behrendt F.F., Pietsch H., Jost G., et. al.: Intra-individual comparison of different contrast media concentrations (300 mg, 370 mg and 400 mg iodine) in MDCT. Eur Radiol 2010; 20: pp. 1644-1650.
18. Langenberger H., Friedrich K., Plank C., et. al.: MDCT angiography for detection of pulmonary emboli: comparison between equi-iodine doses of iomeprol 400 mgI/mL and iodixanol 320 mgI/mL. Eur J Radiol 2009; 70: pp. 579-588.
19. Muhlenbruch G., Behrendt F.F., Eddahabi M.A., et. al.: Which Iodine concentration in chest CT?–a prospective study in 300 patients. Eur Radiol 2008; 18: pp. 2826-2832.
20. Behrendt F.F., Plumhans C., Keil S., et. al.: Contrast enhancement in chest multidetector computed tomography: intraindividual comparison of 300 mg/mL versus 400 mg/mL iodinated contrast medium. Acad Radiol 2009; 16: pp. 144-149.
21. Flohr T.G., McCollough C.H., Bruder H., et. al.: First performance evaluation of a dual-source CT (DSCT) system. Eur Radiol 2006; 16: pp. 256-268.
22. Petersilka M., Bruder H., Krauss B., et. al.: Technical principles of dual source CT. Eur J Radiol 2008; 68: pp. 362-368.
23. Hoey E.T., Gopalan D., Ganesh V., et. al.: Dual-energy CT pulmonary angiography: a novel technique for assessing acute and chronic pulmonary thromboembolism. Clin Radiol 2009; 64: pp. 414-419.
24. Henzler T., Meyer M., Reichert M., et. al.: Dual-energy CT angiography of the lungs: Comparison of test bolus and bolus tracking techniques for the determination of scan delay. Eur J Radiol 2012; 81: pp. 132-138.
25. Han J.K., Kim A.Y., Lee K.Y., et. al.: Factors influencing vascular and hepatic enhancement at CT: experimental study on injection protocol using a canine model. J Comput Assist Tomogr 2000; 24: pp. 400-406.