
Rationale and Objectives
To determine the intraindividual impact of radiation dose reduction in abdominal computed tomography (CT) on diagnostic performance in patients with suspected appendicitis.
Materials and Methods
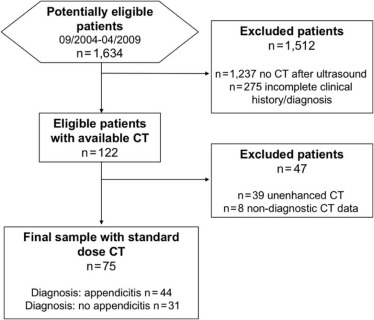
This study was approved by the institutional review board. Seventy-five patients who underwent standard contrast-enhanced abdominal CT for suspected appendicitis between 2004 and 2009 were retrospectively included. Low-dose CT reconstructions with 75%, 50%, and 25% of the original radiation dose level were generated by applying realistic reduced-dose simulation. Two blinded, independent readers assessed image quality, signal-to-noise ratio, and diagnostic confidence on each dataset. Diagnostic accuracy for detection of appendicitis and complications were calculated for each reader. Paired univariate tests were used to determine intraindividual differences.
Results
Among 75 subjects included in the analysis (57% female, mean age: 41 ± 18 years), the prevalence of histopathologically confirmed appendicitis was 59%. Signal-to-noise ratio and subjective image quality of 50% and 25% reduced-dose CTs were significantly lower than the reference datasets (all P < .005). Appendicitis was correctly identified in all reference and low-dose datasets (sensitivity: 100%, negative predictive value: 100%). Presence of complications was correctly detected in all reference, 75%, and 50% datasets, but was decreased in 25% datasets (sensitivity: 77.8% and negative predictive value: 97.4%). Diagnostic confidence was high for original and 75% datasets, but significantly lower for 50% and 25% datasets ( P < .001).
Conclusions
Our results indicate that diagnostic accuracy in abdominal CT acquisitions acquired at 75% and 50% of radiation dose is maintained in patients with suspected appendicitis, whereas further reduction of radiation exposition is associated with decreased diagnostic performance.
Introduction
Acute appendicitis is one of the most frequent diagnoses in acute nontraumatic abdominal pain, affecting mostly patients in the second and third decade of life, with a cumulative lifetime risk of 9.0% . Established clinical signs, laboratory blood values, and transabdominal ultrasound may help in confirming or excluding the diagnosis of appendicitis; however, several studies underline the predominant benefit of computed tomography (CT) compared to ultrasound in the diagnostic workup, with excellent sensitivity and negative predictive value . Additionally, previous research reported a decline in negative appendectomy rates, which can be attributed to the use of CT in the diagnostic management of appendicitis .
Taking into consideration that patients in whom appendicitis is suspected are often young adults or children, the exposure to ionizing radiation is of particular concern, and CT protocols with reduced radiation exposure are mandatory. Although low-dose CT protocols are often associated with a decrease in image quality and thus potential deterioration of diagnostic accuracy, several studies demonstrated no hampering of diagnostic performance for detection of appendicitis in low-dose CT compared to standard-dose CT . Kim et al. also reported that low-dose CT is noninferior to standard-dose CT with respect to negative appendectomy rates (3.5% vs 3.2%, respectively) . However, these and other studies on low-dose CT in patients with appendicitis are based on between-group comparisons without intraindividual reference and without taking into account associated conditions and complications, which may explain the limited implementation of these low-dose CT protocols in clinical practice.
Get Radiology Tree app to read full this article<
Materials and Methods
Subjects and Data Acquisition
Get Radiology Tree app to read full this article<
Reference Standard
Get Radiology Tree app to read full this article<
Low-dose Simulation
Get Radiology Tree app to read full this article<
Qualitative and Quantitative Analyses
Get Radiology Tree app to read full this article<
Get Radiology Tree app to read full this article<
Get Radiology Tree app to read full this article<
Diagnostic Assessment and Interreader Variability
Get Radiology Tree app to read full this article<
Statistical Analysis
Get Radiology Tree app to read full this article<
Institutional Review Board Approval
Get Radiology Tree app to read full this article<
Results
Subjects and Data Acquisition
Get Radiology Tree app to read full this article<
Get Radiology Tree app to read full this article<
Demographical Information and Diagnoses of the Study Population
Get Radiology Tree app to read full this article<
TABLE 1
Patient Demographic Characteristics, Intraoperative Diagnoses, and Presence of Complications of All Patients
Variable Total Patients without Acute Appendicitis Patients with Acute Appendicitis_n_ (%) or Mean (±SD)n (%) or Mean (±SD)n (%) or Mean (±SD)n 75 31 44 Age (y) 40.6 (±17.6) 33.2 (±14.2) 46.2 (±18.0) Male gender 32 (42.7) 9 (29.0) 23 (52.3) Female gender 43 (57.3) 22 (71.0) 21 (47.7) Male-to-female ratio 0.7 0.4 1.1 White cell count ( n /µL) 13,587.7 (±5,424.1) 11,266.8 (±3,766.5) 15,223.0 (±5424.1) C-reactive protein (mg/dL) 6.2 (±8.9) 3.5 (±6.1) 6.2 (±8.9)
Data are arithmetic means and standard deviations (continuous variables) or counts and percentages (categorical variables).
TABLE 2
Intraoperative Diagnoses and Final Diagnoses in Synopsis of Clinical, Intraoperative, and Histopathological Findings
Intraoperative and/or Histopathological Diagnosis, n (%) Acute appendicitis without perforation ( n ) 9 (25.3) Periappendiceal abscess ( n ) 6 (8.0) Perforation ( n ) 17 (22.7) Another cause ( n ) 9 (12.0) Surgical diagnosis missing ( n ) 9 (12.0) No operation ( n ) 13 (17.3) Diagnosis of acute appendicitis 44 (58.7)
Data are counts and percentages (categorical variables).
Get Radiology Tree app to read full this article<
Get Radiology Tree app to read full this article<
Get Radiology Tree app to read full this article<
Get Radiology Tree app to read full this article<
Quantitative and Qualitative Analyses of the CT Datasets
Get Radiology Tree app to read full this article<
Get Radiology Tree app to read full this article<
Get Radiology Tree app to read full this article<
TABLE 3
Summary of the Evaluation of Subjective Quality of the Original Standard-dose CT and the Generated Low-dose CT Datasets in Terms of Subjective Quality
Reference CT 75% Low-dose CT 50% Low-dose CT 25% Low-dose CT 100% vs 75% Low-dose CT 100% vs 50% Low-dose CT 100% vs 25% Low-dose CT Subjective image quality Overall quality Reader A 2 (1–3) 2 (2–4) 3 (2–5) 4 (3–5) 0.003 0.001 0.001 Reader B 1 (1–3) 2 (2–4) 3 (2–5) 4 (3–5) 0.001 0.001 0.001 Image noise Reader A 2 (1–3) 2 (2–4) 3 (2–5) 4 (3–5) 0.001 0.000 0.001 Reader B 1 (1–3) 2 (2–4) 3 (2–5) 4 (3–5) 0.001 0.001 0.001 Sharpness Reader A 2 (1–3) 3 (2–4) 3 (2–5) 4 (3–5) 0.001 0.000 0.001 Reader B 1 (1–3) 3 (2–4) 3 (2–5) 4 (3–5) 0.001 0.001 0.001 Artefacts Reader A 1 (1–3) 2 (1–3) 3 (2–5) 4 (3–5) 0.006 0.001 0.001 Reader B 1 (1–3) 2 (1–3) 3 (2–5) 4 (3–5) 0.060 0.001 0.001 Diagnostic confidence Overall Reader A 1 (1–2) 2 (1–4) 3 (2–5) 4 (3–5) 0.001 0.001 0.001 Reader B 1 (1–3) 2 (1–4) 3 (2–5) 4 (3–5) 0.001 0.001 0.001 Appendicitis-specific Reader A 1 (1–3) 2 (1–4) 2 (1–5) 2 (1–5) 0.698 0.011 0.001 Reader B 1 (1–3) 1 (1–4) 1 (1–5) 2 (1–5) 0.309 0.003 0.000
CT, computed tomography.
Data are median with minimum and maximum. Subjective quality was evaluated on a five-point Likert scale (1 = excellent to 5 = very poor).
Get Radiology Tree app to read full this article<
Diagnostic Performance
Get Radiology Tree app to read full this article<
TABLE 4
Diagnostic Accuracy of Detection of Complications in the 25% Reduced-dose CT Datasets in Comparison to Original-dose CT
Complications Overall Abscess Formation Free Intraabdominal Air Reader A Reader B Reader A Reader B Reader A Reader B Sensitivity 77.78 (52.36–93.59) 96.21 (91.38–98.75) 81.82 (48.22–97.72) 72.73 (39.03–93.98) 71.43 (29.04–96.33) 71.43 (29.04–96.33) Specificity 97.40 (93.48–99.29) 96.77 (92.63–98.94) 100.00 (49.4–100.00) 100.00 (94.4–100.0) 94.12 (85.62–98.37) 92.65 (83.67–97.57) PPV 77.78 (56.33–90.47) 96.21 (91.47–98.37) 100.00 100.00 55.56 (30.22–78.30) 50.00 (27.59-27.41) NPV 97.40 (94.05–98.89) 96.77 (92.70–98.61) 96.97 (90.13–99.12) 95.52 (89.04–98.25) 96.97 (90.83–99.04) 96.92 (90.69–99.03)
NPV, negative predictive value; PPV, positive predictive value.
Data are indicated in percentage with 95% confidence interval.
Get Radiology Tree app to read full this article<
Get Radiology Tree app to read full this article<
Get Radiology Tree app to read full this article<
Get Radiology Tree app to read full this article<
Interreader Variability
Get Radiology Tree app to read full this article<
TABLE 5
Interreader Agreement Between Reader A vs Reader B Within the Low-dose Generated CT Dataset and the Original Dataset in Terms of Subjective Analyses
Interreader Agreement, Cohen Kappa (±Asymptotic Standard Error) 25% Low-dose CT 50% Low-dose CT 75% Low-dose CT 100% Low-dose CT Wall thickening of the appendix 0.899 (±0.047) 1 (±0) 0.974 (±0.026) 0.917 (±0.04) Appendicolith 1 (±0) 0.927 (±0.072) 0.938 (±0.058) 0.798 (±0.077) Periappendiceal phlegmon 0.974 (±0.026) 0.975 (±0.025) 0,973 (±0.026) 0.901 (±0.042) Free intraabdominal fluid 0.882 (±0.053) 1 (±0) 1 (±0) 0.932 (±0.038) Free intraabdominal air 0.94 (±0.06) 1 (±0) 1 (±0) 1 (±0) Abscess formation 0.934 (±0.066) 1 (±0) 1 (±0) 1 (±0) Confidence in diagnosis of acute appendicitis 0.862 (±0.049) 0.842 (±0.054) 0.922 (±0.043) 0.756 (±0.136) Diagnosis of an acute appendicitis 1 (±0) 1 (±0) 1 (±0) 1 (±0)
Data are indicated in Cohen κ values (±asymptotic standard error), respectively. Interreader agreement indicated as κ values ranging from 0.0 to 1.0, overall (depicted: 0.4–0.59 = weak, 0.6–0.79 = moderate, 0.8–0.9 = strong and above 0.90 = almost perfect).
Get Radiology Tree app to read full this article<
Discussion
Get Radiology Tree app to read full this article<
Get Radiology Tree app to read full this article<
Get Radiology Tree app to read full this article<
Get Radiology Tree app to read full this article<
Get Radiology Tree app to read full this article<
Get Radiology Tree app to read full this article<
Acknowledgement
Get Radiology Tree app to read full this article<
References
1. Anderson J.E., Bickler S.W., Chang D.C., et. al.: Examining a common disease with unknown etiology: trends in epidemiology and surgical management of appendicitis in California, 1995–2009. World J Surg 2012; 36: pp. 2787-2794.
2. Bhangu A., Soreide K., Di Saverio S., et. al.: Acute appendicitis: modern understanding of pathogenesis, diagnosis, and management. Lancet 2015; 386: pp. 1278-1287.
3. Stewart B., Khanduri P., McCord C., et. al.: Global disease burden of conditions requiring emergency surgery. Br J Surg 2014; 101: pp. e9-e22.
4. Collaborative S., Cuschieri J., Florence M., et. al.: Negative appendectomy and imaging accuracy in the Washington State Surgical Care and Outcomes Assessment Program. Ann Surg 2008; 248: pp. 557-563.
5. Coursey C.A., Nelson R.C., Patel M.B., et. al.: Making the diagnosis of acute appendicitis: do more preoperative CT scans mean fewer negative appendectomies? A 10-year study. Radiology 2010; 254: pp. 460-468.
6. Kim K., Kim Y.H., Kim S.Y., et. al.: Low-dose abdominal CT for evaluating suspected appendicitis. N Engl J Med 2012; 366: pp. 1596-1605.
7. Keyzer C., Tack D., de Maertelaer V., et. al.: Acute appendicitis: comparison of low-dose and standard-dose unenhanced multi-detector row CT. Radiology 2004; 232: pp. 164-172.
8. Seo H., Lee K.H., Kim H.J., et. al.: Diagnosis of acute appendicitis with sliding slab ray-sum interpretation of low-dose unenhanced CT and standard-dose i.v. contrast-enhanced CT scans. AJR Am J Roentgenol 2009; 193: pp. 96-105.
9. Won Kim C., Kim J.H.: Realistic simulation of reduced-dose CT with noise modeling and sinogram synthesis using DICOM CT images. Med Phys 2014; 41: pp. 011901.
10. Othman A.E., Brockmann C., Yang Z., et. al.: Effects of radiation dose reduction in volume perfusion CT imaging of acute ischemic stroke. Eur Radiol 2015; 25: pp. 3415-3422.
11. McHugh M.L.: Interrater reliability: the kappa statistic. Biochem Med (Zagreb) 2012; 22: pp. 276-282.
12. Callahan M.J., Anandalwar S.P., MacDougall R.D., et. al.: Pediatric CT dose reduction for suspected appendicitis: a practice quality improvement project using artificial Gaussian noise. Part 2. Clinical outcomes. AJR Am J Roentgenol 2015; 204: pp. 636-644.
13. Andersson R.E.: Short and long-term mortality after appendectomy in Sweden 1987 to 2006. Influence of appendectomy diagnosis, sex, age, co-morbidity, surgical method, hospital volume, and time period. A national population-based cohort study. World J Surg 2013; 37: pp. 974-981.
14. Lunca S., Bouras G., Romedea N.S.: Acute appendicitis in the elderly patient: diagnostic problems, prognostic factors and outcomes. Rom J Gastroenterol 2004; 13: pp. 299-303.
15. Omari A.H., Khammash M.R., Qasaimeh G.R., et. al.: Acute appendicitis in the elderly: risk factors for perforation. World J Emerg Surg 2014; 9: pp. 6.
16. Styrud J., Eriksson S., Nilsson I., et. al.: Appendectomy versus antibiotic treatment in acute appendicitis. A prospective multicenter randomized controlled trial. World J Surg 2006; 30: pp. 1033-1037.
17. Minneci P.C., Sulkowski J.P., Nacion K.M., et. al.: Feasibility of a nonoperative management strategy for uncomplicated acute appendicitis in children. J Am Coll Surg 2014; 219: pp. 272-279.
18. Caruso A.M., Pane A., Garau R., et. al.: Acute appendicitis in children: not only surgical treatment. J Pediatr Surg 2017; 52: pp. 444-448.
19. Fefferman N.R., Bomsztyk E., Yim A.M., et. al.: Appendicitis in children: low-dose CT with a phantom-based simulation technique—initial observations. Radiology 2005; 237: pp. 641-646.
20. Geyer L.L., Schoepf U.J., Meinel F.G., et. al.: State of the art: iterative CT reconstruction techniques. Radiology 2015; 276: pp. 339-357.
21. Geyer L.L., De Cecco C.N., Schoepf U.J., et. al.: Low-volume contrast medium protocol for comprehensive cardiac and aortoiliac CT assessment in the context of transcatheter aortic valve replacement. Acad Radiol 2015; 22: pp. 1138-1146.
22. Anderson B.A., Salem L., Flum D.R.: A systematic review of whether oral contrast is necessary for the computed tomography diagnosis of appendicitis in adults. Am J Surg 2005; 190: pp. 474-478.
23. Drake F.T., Alfonso R., Bhargava P., et. al.: Enteral contrast in the computed tomography diagnosis of appendicitis: comparative effectiveness in a prospective surgical cohort. Ann Surg 2014; 260: pp. 311-316.
24. Doria A.S., Moineddin R., Kellenberger C.J., et. al.: US or CT for diagnosis of appendicitis in children and adults? A meta-analysis. Radiology 2006; 241: pp. 83-94.