
Rationale and Objectives
Different computed tomography imaging protocols and patient characteristics can impact the accuracy and precision of the calcium score and may lead to inconsistent patient treatment recommendations. The aim of this work was to determine the impact of reconstruction algorithm and gender characteristics on coronary artery calcium scoring based on a phantom study using computed tomography.
Materials and Methods
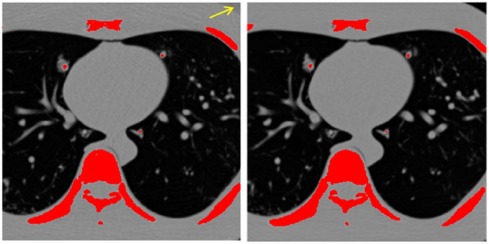
Four synthetic heart vessels with vessel diameters corresponding to female and male left main and left circumflex arteries containing calcification-mimicking materials (200–1000 HU) were inserted into a thorax phantom and were scanned with and without female breast plates (male and female phantoms, respectively). Ten scans were acquired and were reconstructed at 3-mm slices using filtered-back projection (FBP) and iterative reconstruction with medium and strong denoising (IR3 and IR5) algorithms. Agatston and calcium volume scores were estimated for each vessel. Calcium scores for each vessel and the total calcium score (summation of all four vessels) were compared between the two phantoms to quantify the impact of the breast plates and reconstruction parameters. Calcium scores were also compared among vessels of different diameters to investigate the impact of the vessel size.
Results
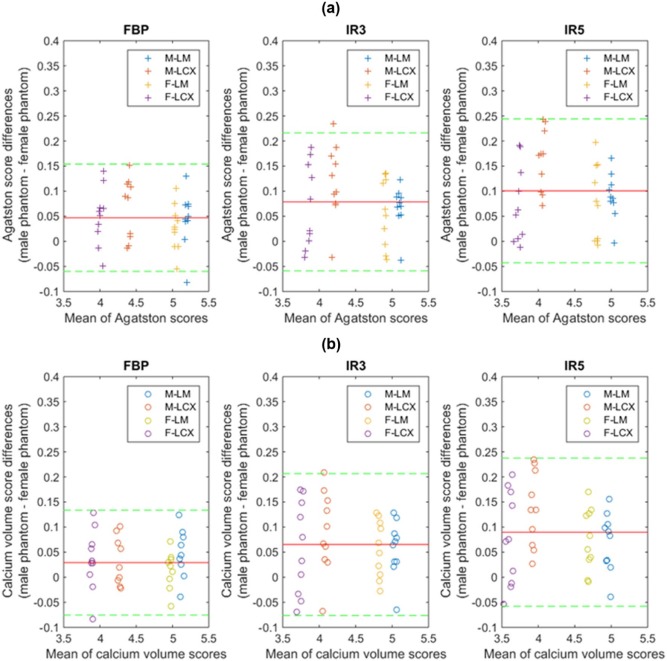
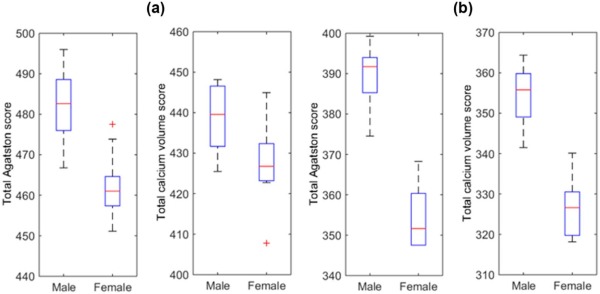
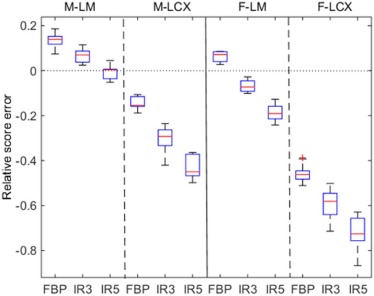
The calcium scores were significantly larger for FBP reconstruction (FBP > IR3>IR5). Agatston scores (calcium volume score) for vessels in the male phantom scans were on average 4.8% (2.9%), 8.2% (7.1%), and 10.5% (9.4%) higher compared to those in the female phantom with FBP, IR3, and IR5, respectively, when exposure was conserved across phantoms. The total calcium scores from the male phantom were significantly larger than those from the female phantom ( P < 0.05). In general, calcium volume scores were underestimated (up to about 50%) for smaller vessels, especially when scanned in the female phantom.
Conclusions
Calcium scores significantly decreased with iterative reconstruction and tended to be underestimated for female anatomy (smaller vessels and presence of breast plates).
Introduction
Cardiovascular disease is the leading cause of death in American women, and women have higher cardiovascular mortality rates compared to men . A common screening approach for intermediate risk patients is the identification of calcium in the coronary arteries using computed tomography (CT) . The calcium score is used as an overall indicator of coronary health, with higher scores indicating higher risk of coronary artery disease. In general, women have smaller, faster beating hearts, smaller arteries, and a different breast structure compared to men, which can potentially lead to differences in performing quantitative calcium scoring .
Research has been done to standardize and quantify coronary artery calcium in CT, accounting for patient differences. McCollough et al. reported a consensus standard for quantification of coronary artery calcium and reported standardized CT acquisition parameters to achieve comparable image noise, spatial resolution, and mass scores among patients of varying sizes . Willemink et al. recently compared calcium scoring with a smaller 300×200mm 300
×
200
mm and a larger 400×300mm 400
×
300
mm chest phantom in a multivendor phantom study . Willemink et al. showed that the calcium scores were systematically underestimated in a larger chest phantom. Willemink et al. stated that the results were relevant to women in the sense that the thorax attenuation of the women was similar to a larger chest.
Get Radiology Tree app to read full this article<
Get Radiology Tree app to read full this article<
Methods
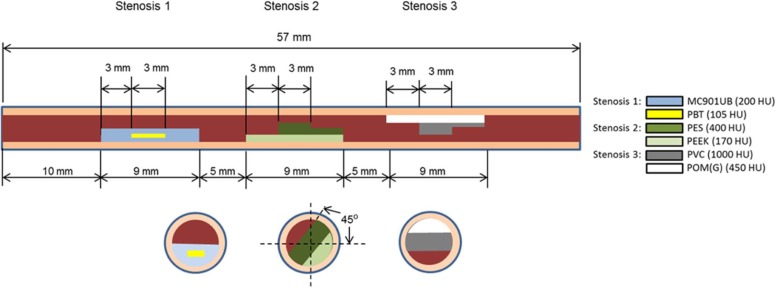
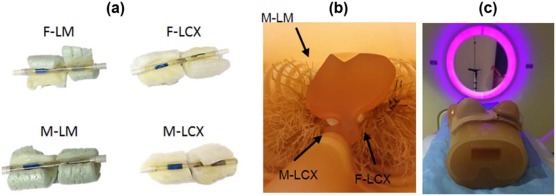
Anthropomorphic Phantom Materials
Get Radiology Tree app to read full this article<
Get Radiology Tree app to read full this article<
Get Radiology Tree app to read full this article<
Get Radiology Tree app to read full this article<
Imaging Protocol
Get Radiology Tree app to read full this article<
Get Radiology Tree app to read full this article<
Calcium Scoring
Get Radiology Tree app to read full this article<
Get Radiology Tree app to read full this article<
Reference Standard
Get Radiology Tree app to read full this article<
Noise Measurement
Get Radiology Tree app to read full this article<
Statistical Analyses
Get Radiology Tree app to read full this article<
Get Radiology Tree app to read full this article<
Get Radiology Tree app to read full this article<
Results
Reference Standard for Calcium Stenosis Volume
Get Radiology Tree app to read full this article<
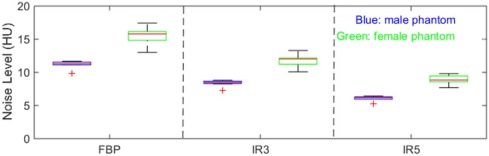
Image Noise
Get Radiology Tree app to read full this article<
Get Radiology Tree app to read full this article<
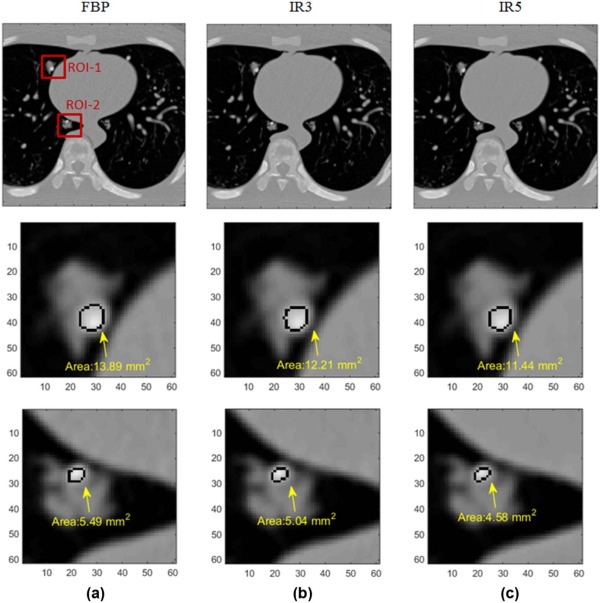
Effect of Image Reconstruction Method on Calcium Score Estimation
Get Radiology Tree app to read full this article<
Table 1
Total Agatston and Total Calcium Volume Scores \* for Female and Male Phantoms
Total calcium score Gender FBP IR3 IR5 Mean ± SD Min, max Mean ± SD Min, max Mean ± SD Min, max Agatston score Female 462 ± 8.3 451, 477 399 ± 8.4 390, 412 354 ± 7.6 348, 368 Male 482 ± 8.7 467, 496 429 ± 7.9 414, 441 390 ± 7.9 374, 399 Calcium volume score Female 427 ± 9.6 408, 445 369 ± 8.0 359, 387 326 ± 7.6 318, 340 Male 439 ± 7.9 425, 448 393 ± 7.9 379, 407 354 ± 7.0 341, 364
FBP, filtered-back projection; IR3, iterative reconstruction with denoising strength 3; IR5, iterative reconstruction with denoising strength 5; SD, standard deviation.
Get Radiology Tree app to read full this article<
Get Radiology Tree app to read full this article<
Gender Impact
Get Radiology Tree app to read full this article<
Get Radiology Tree app to read full this article<
Get Radiology Tree app to read full this article<
Get Radiology Tree app to read full this article<
Get Radiology Tree app to read full this article<
Table 2
The Coefficients of Variations for the Agatston and Calcium Volume Scores From 10 Repeated Scans Averaged Across the Reconstruction Algorithms and Slice Thicknesses
Coefficient of Variation Agatston Score Calcium Volume Score (mm 3 ) FBP IR3 IR5 FBP IR3 IR5 Female0.0180 0.0211 0.0216 0.0225 0.0218 0.0234 Male 0.01810.01840.02020.01800.02010.0197
FBP, filtered-back projection; IR3, iterative reconstruction with denoising strength 3; IR5, iterative reconstruction with denoising strength 5.
The bold numbers indicate the lower coefficients of variation between the female and male phantom images.
Get Radiology Tree app to read full this article<
Get Radiology Tree app to read full this article<
Get Radiology Tree app to read full this article<
Discussion
Get Radiology Tree app to read full this article<
Get Radiology Tree app to read full this article<
Get Radiology Tree app to read full this article<
Get Radiology Tree app to read full this article<
Get Radiology Tree app to read full this article<
Get Radiology Tree app to read full this article<
Conclusions
Get Radiology Tree app to read full this article<
Acknowledgments
Get Radiology Tree app to read full this article<
Get Radiology Tree app to read full this article<
References
1. Tsang J.C., Min J.K., Lin F.Y., et. al.: Sex comparison of diagnostic accuracy of 64-multidetector row coronary computed tomographic angiography: results from the multicenter ACCURACY trial. J Cardiovasc Comput Tomogr 2012; 6: pp. 246-251.
2. Goff D.C., Lloyd-Jones D.M., Bennett G., et. al.: 2013 ACC/AHA guideline on the assessment of cardiovascular risk. J Am Coll Cardiol 2014; 129: pp. S49-S73.
3. Burger I.M., Kass N.E., Sunshine J.H., et. al.: The use of CT for screening: a national survey of radiologists’ activities and attitudes 1. Radiol 2008; 248: pp. 160-168.
4. Ryan S.M., Goldberger A.L., Pincus S.M., et. al.: Gender-and age-related differences in heart rate dynamics: are women more complex than men?. J Am Coll Cardiol 1994; 24: pp. 1700-1707.
5. Dodge J.T., Brown B.G., Bolson E.L., et. al.: Lumen diameter of normal human coronary arteries. Influence of age, sex, anatomic variation, and left ventricular hypertrophy or dilation. Circulation 1992; 86: pp. 232-246.
6. Ostchega Y., Porter K.S., Hughes J., et. al.: Resting pulse rate reference data for children, adolescents, and adults: United States, 1999–2008.2011.US Department of Health and Human Services, Centers for Disease Control and Prevention, National Center for Health Statisticspp. 1-16.
7. McCollough C.H., Ulzheimer S., Halliburton S.S., et. al.: Coronary artery calcium: a multi-institutional, multimanufacturer international standard for quantification at cardiac CT. Radiol 2007; 243: pp. 527-538.
8. Willemink M.J., Abramiuc B., den Harder A.M., et. al.: Coronary calcium scores are systematically underestimated at a large chest size: a multivendor phantom study. J Cardiovasc Comput Tomogr 2015; 9: pp. 415-421.
9. Gebhard C., Fiechter M., Fuchs T.A., et. al.: Coronary artery calcium scoring: influence of adaptive statistical iterative reconstruction using 64-MDCT. Int J Cardiol 2013; 167: pp. 2932-2937.
10. Kurata A., Dharampal A., Dedic A., et. al.: Impact of iterative reconstruction on CT coronary calcium quantification. Eur Radiol 2013; 23: pp. 3246-3252.
11. McQuiston A.D., Muscogiuri G., Schoepf U.J., et. al.: Approaches to ultra-low radiation dose coronary artery calcium scoring based on 3rd generation dual-source CT: a phantom study. Eur J Radiol 2016; 85: pp. 39-47.
12. Willemink M.J., Takx R.A., de Jong P.A., et. al.: The impact of CT radiation dose reduction and iterative reconstruction algorithms from four different vendors on coronary calcium scoring. Eur Radiol 2014; 24: pp. 2201-2212.
13. Takahashi M., Kimura F., Umezawa T., et. al.: Comparison of adaptive statistical iterative and filtered back projection reconstruction techniques in quantifying coronary calcium. J Cardiovasc Comput Tomogr 2016; 10: pp. 61-68.
14. Schindler A., Vliegenthart R., Schoepf U.J., et. al.: Iterative image reconstruction techniques for CT coronary artery calcium quantification: comparison with traditional filtered back projection in vitro and in vivo. Radiol 2014; 270: pp. 387-393.
15. Suh Y.J., Kim Y.J., Hong S.R., et. al.: Combined use of automatic tube potential selection with tube current modulation and iterative reconstruction technique in coronary CT angiography. Radiol 2013; 269: pp. 722-729.
16. Morin R.L., Gerber T.C., McCollough C.H.: Radiation dose in computed tomography of the heart. Circulation 2003; 107: pp. 917-922.
17. Rollano-Hijarrubia E., Stokking R., van der Meer F., et. al.: Imaging of small high-density structures in CT: a phantom study. Acad Radiol 2006; 13: pp. 893-908.