
Rationale and Objectives
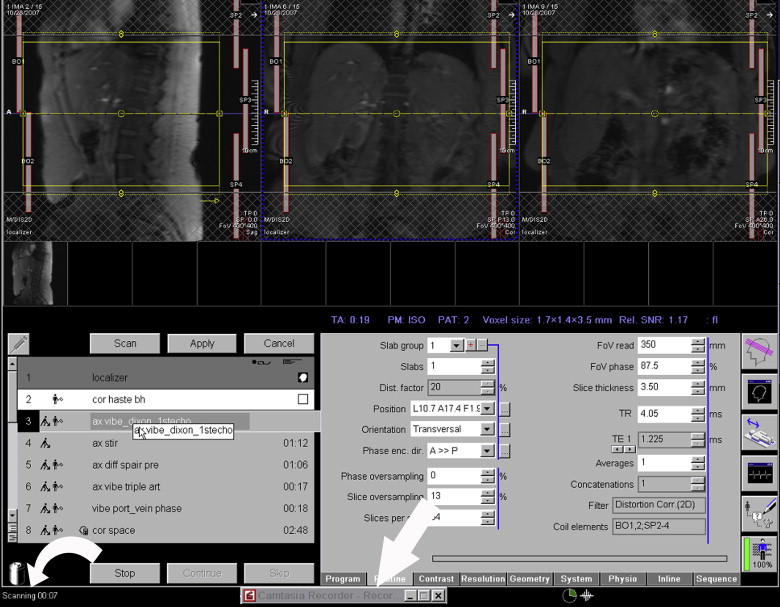
The aim of this study was to assess if graphical user interface screen-capture software applied to a magnetic resonance (MR) hardware console could nonintrusively allow the analysis of discrepancies between expected and experienced MR table time.
Materials and Methods
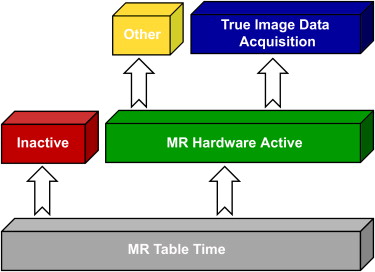
Individual MR examination acquisition processes were captured in audio-video interleave streams for 10 patients who underwent comprehensive liver MR imaging. These audio-video streams were dissected into periods of true image data acquisition, scanner activity without direct image data acquisition, and scanner inactivity.
Results
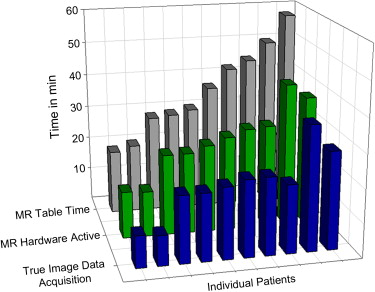
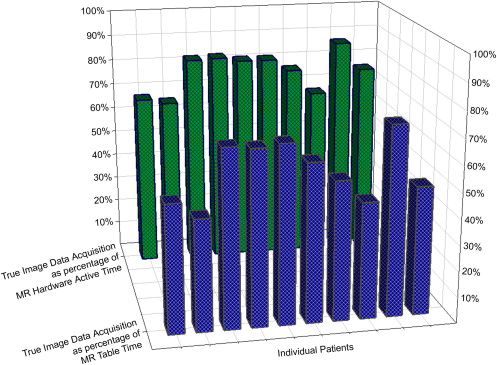
Total expected time required for standardized liver MR image acquisition was estimated at 15 minutes. Experienced table times varied highly, ranging from 19:00 to 58:08 minutes. Image data acquisition occurred during approximately 58% (range, 43.3%–73.7%) of overall table time. Image data were obtained approximately 77% (range, 65.6%–87.0%) of the time the scanner spent active.
Conclusion
Graphical user interface screen-capture software installed on an MR console nonintrusively revealed significant periods of table time spent not obtaining true image data and explained discrepancies between expected and experienced MR table times. Table-time calculations using Digital Imaging and Communications in Medicine image headers and scanner-logged time stamps are underestimations of true table time because they do not take into account some scanner activities not directly leading to image formation.
Recent developments in magnetic resonance (MR) technology, in particular the implementation of multichannel system architectures allowing parallel imaging acceleration in combination with higher field and gradient strengths, have resulted in increased temporal resolution of MR sequences, subsequently resulting in decreased overall sequence acquisition time. Frequently, however, overall patient time in the MR scanner room is considerably longer than expected when summing the component sequences of the MR protocol used, or when extracting acquisition times and time stamps from Digital Imaging and Communications in Medicine (DICOM) image headers. Furthermore, the use of individual and thereby variable physiologic parameters such as electrocardiographic and plethysmographic traces for cardiac-triggered and respiratory-triggered MR imaging leads to unpredictable variations in overall acquisition times, which are not accurately documented in DICOM image headers.
Work-flow studies and institution-wide quality initiatives frequently favor processes taking place before and after the image acquisition process and often do not examine in detail what occurs while a patient is within the MR suite itself. Considering increasing health policy focus on patient-centered practice , clinical questions necessitating imaging may be answerable in a manner that minimizes components of no value to patients through sequence or imaging protocol redesigns.
Get Radiology Tree app to read full this article<
Get Radiology Tree app to read full this article<
Materials and methods
Patient Demographics
Get Radiology Tree app to read full this article<
Comprehensive Hepatic MR Imaging Protocol
Get Radiology Tree app to read full this article<
Get Radiology Tree app to read full this article<
Get Radiology Tree app to read full this article<
Get Radiology Tree app to read full this article<
Graphical User Interface Screen-capture Solution for Work-flow Analysis
Get Radiology Tree app to read full this article<
Get Radiology Tree app to read full this article<
Get Radiology Tree app to read full this article<
Get Radiology Tree app to read full this article<
Results
Get Radiology Tree app to read full this article<
Get Radiology Tree app to read full this article<
Table 1
Patient Demographics and Workflow Analysis Summary
Patient Age Sex Inpatient vs Outpatient Technologist Experience (y) Image Data Acquisition Time (min) Scanner Active Time (min) Total Scan Time (min) Image Data Acquisition Time vs Total Scan Time (%) Image Data Acquisition Time vs Scanner Active Time (%) 1 61 M Outpatient 15 9:25 13:57 19:00 49.6 67.5 2 35 F Inpatient 8 8:53 13:32 20:32 43.3 65.6 3 60 M Inpatient 8 19:51 24:02 28:51 68.8 82.6 4 61 F Inpatient 8 19:57 24:04 29:27 67.8 83.0 5 66 F Outpatient 15 21:11 26:00 30:43 69.0 81.5 6 19 M Inpatient 8 22:48 28:01 37:03 61.5 81.4 7 81 M Outpatient 3 23:03 30:02 42:35 54.1 76.7 8 64 M Outpatient 5 20:22 30:33 44:57 45.3 66.7 9 50 M Outpatient 10 36:57 42:27 50:08 73.7 87.0 10 75 M Outpatient 15 29:02 38:17 58:08 49.9 75.8
F, female; M, male.
Get Radiology Tree app to read full this article<
Get Radiology Tree app to read full this article<
Get Radiology Tree app to read full this article<
Get Radiology Tree app to read full this article<
Discussion
Get Radiology Tree app to read full this article<
Get Radiology Tree app to read full this article<
Get Radiology Tree app to read full this article<
Get Radiology Tree app to read full this article<
Get Radiology Tree app to read full this article<
Get Radiology Tree app to read full this article<
Get Radiology Tree app to read full this article<
Get Radiology Tree app to read full this article<
Get Radiology Tree app to read full this article<
Get Radiology Tree app to read full this article<
References
1. Laine C., Davidoff F.: Patient-centered medicine. A professional evolution. JAMA 1996; 275: pp. 152-156.
2. Demiris G., Afrin L.B., Speedie S., et. al.: Patient-centered applications: use of information technology to promote disease management and wellness. A white paper by the AMIA knowledge in motion working group. J Am Med Inform Assoc 2008; 15: pp. 8-13.
3. Barr M.S.: The need to test the patient-centered medical home. JAMA 2008; 300: pp. 834-835.
4. Gale D.R., Gale M.E., Schwartz R.K., Muse V.V., Walker R.E.: An automated PACS workstation interface: a timesaving enhancement. AJR Am J Roentgenol 2000; 174: pp. 33-36.
5. Halsted M.J., Froehle C.M.: Design, implementation, and assessment of a radiology workflow management system. AJR Am J Roentgenol 2008; 191: pp. 321-327.
6. George M.L.: Lean Six Sigma: combining Six Sigma quality with Lean speed.2002.McGraw-HillNew York
7. Viau M., Southern B.: Six Sigma and Lean concepts, a case study: patient centered care model for a mammography center. Radiol Manage 2007; 29: pp. 19-28.
8. Bahensky J.A., Roe J., Bolton R.: Lean Sigma—will it work for healthcare?. J Healthc Inf Manag 2005; 19: pp. 39-44.
9. Trisolini M.G., Boswell S.B., Johnson S.K., McNeil B.J.: Radiology work-load measurements reflecting variables specific to hospital, patient, and examination: results of a collaborative study. Radiology 1988; 166: pp. 247-253.
10. Janower M.L.: Productivity standards for technologists: how to use them. Radiology 1988; 166: pp. 276-277.
11. McNeil B.J., Sapienza A., Van Gerpen J., et. al.: Radiology department management system: technologists’ costs. Radiology 1985; 156: pp. 57-60.
12. Revesz G., Shea F.J., Ziskin M.C.: Patient flow and utilization of resources in a diagnostic radiology department. Radiology 1972; 104: pp. 21-26.
13. Chang P.J.: Challenges and opportunities for radiology in the next millennium: re-engineering the radiology practice in an electronic world. Radiographics 2001; 21: pp. 1013-1014.
14. Bazzoli G.J., Chen H.F., Zhao M., Lindrooth R.C.: Hospital financial condition and the quality of patient care. Health Econ 2008; 17: pp. 977-995.
15. Forman H.P.: Medicare update for radiologists: predictions for 2008 and beyond. AJR Am J Roentgenol 2007; 189: pp. 3-4.