
Rationale and Objectives
Quantitative susceptibility mapping (QSM) is a novel technique which allows determining the bulk magnetic susceptibility distribution of tissue in vivo from gradient echo magnetic resonance (MR) phase images. Our purpose was to evaluate if there is additional diagnostic value of QSM images in detecting the cortical gray matter involvement in multiple sclerosis (MS) patients.
Materials and Methods
Our institutional review board approved this study. Conventional MR imaging, including T2-weighted imaging and two- or three-dimensional fluid-attenuated inversion recovery images, and QSM imaging examinations were performed in 27 patients (19 male and eight female) with MS. Two radiologists (radiologists 1 and 2) assessed the MS lesions in the following 3 anatomic regions: intracortical, mixed white matter–gray matter (WM–GM), and juxtacortical regions. The numbers of lesions per region category were compared between conventional MR images with and without QSM images.
Results
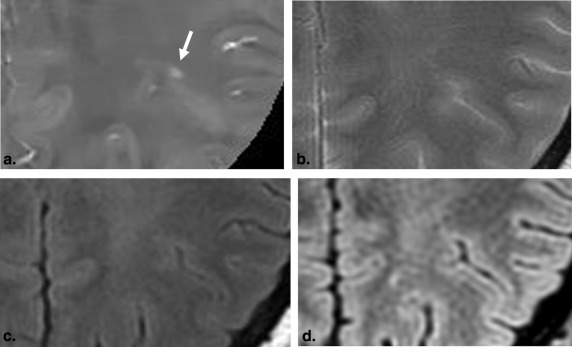
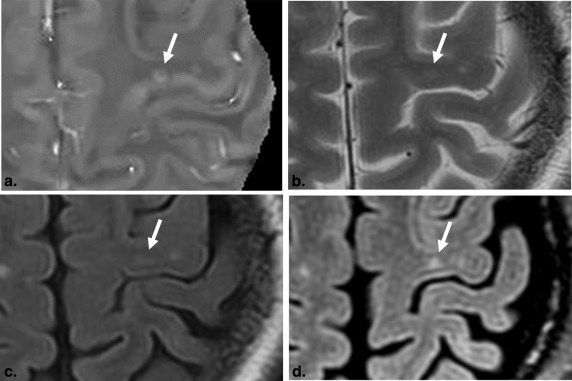
For radiologists 1 and 2, QSM images identified 6 (50.0%) and 7 (50.0%) additional lesions that were not seen in the conventional MR images, respectively. In a lesion-by-lesion analysis, the substantial fraction (20 [25.3%] of 79 at radiologist 1, 22 [29.7%] of 74 at radiologist 2) of juxtacortical white matter lesions on the conventional MR images were scored as mixed WM–GM lesions with QSM images.
Conclusions
Our preliminary results suggest that the MR imaging with QSM may increase the sensitivity in cortical lesion detection in the MS brain and improved distinction between juxtacortical and mixed WM–GM lesions.
Multiple sclerosis (MS) is an inflammatory demyelinating disease of the central nervous system that usually affects young adults and leads to chronic invalidism. Magnetic resonance imaging (MRI) has high sensitivity, revealing macroscopic tissue abnormalities in MS patients. Conventional MR sequences, such as T2-weighted imaging (T2WI), fluid-attenuated inversion recovery (FLAIR), and T1WI, both with and without administration of a gadolinium-based contrast agent, provide important pieces of information for diagnosing MS, understanding its natural history, and assessing treatment efficacy.
The results of histopathologic studies have shown that a substantial portion of the total cerebral lesion load in MS is located within the gray matter or at the border between the cortex and subcortical white matter . This acknowledgment of gray matter involvement in the disease has led to the incorporation of juxtacortical lesions in recently defined MS diagnostic criteria and interest in the role of diffuse damage in the normal-appearing gray matter in determining disability and cognition . In previous study, the MS lesions involving the U-fibers were classified into four patterns as 1) a lesion involving only the U-fibers, 2) a lesion involving the cortex and U-fibers, 3) a lesion involving the U-fibers and deep white matter, and 4) a lesion involving the cortex, U-fibers, and deep white matter . The acknowledgment of these particular anatomic distributions of plaque burden would be expected to allow for more precise correlation with neurologic impairment; however, on conventional MRI, it has not been well recognized that MS lesions may involve only the U-fibers and may extend to the cortex. Moreover, the cortical lesions are largely missed on conventional MRI.
Get Radiology Tree app to read full this article<
Get Radiology Tree app to read full this article<
Materials and methods
Patients
Get Radiology Tree app to read full this article<
MR Imaging
Get Radiology Tree app to read full this article<
Get Radiology Tree app to read full this article<
Image Analysis
Get Radiology Tree app to read full this article<
Get Radiology Tree app to read full this article<
Get Radiology Tree app to read full this article<
Statistical Analysis
Get Radiology Tree app to read full this article<
Results
Get Radiology Tree app to read full this article<
Table 1
Comparison of Lesion Detection with and without QSM Images
Locations of Lesions Radiologist 1 Radiologist 2 Without QSM (N = 116) With QSM (N = 129) Without QSM (N = 113) With QSM (N = 127) Intracortical lesions 6 (3) 12 (6) 7 (4) 14 (6) Mixed WM–GM lesions 31 (5) 52 (11) 32 (5) 54 (10) Juxtacortical WM lesions 79 (12) 65 (12) 74 (11) 59 (12)
QSM, quantitative susceptibility mapping; WM–GM, white matter–gray matter; WM, white matter.
Data are numbers of lesions; numbers in parentheses were the number of patients.
Get Radiology Tree app to read full this article<
Get Radiology Tree app to read full this article<
Table 2
Lesion Groups at Second Reading Sessions (Conventional MRI Plus QSM)
Region Category Lesion Groups A B C D Radiologist 1 Intracortical lesions (N = 12) 6 6 0 0 Mixed WM–GM lesions (N = 52) 31 1 20 ∗ 0 Juxtacortical WM lesions (N = 65) 59 6 0 0 Radiologist 2 Intracortical lesions (N = 14) 7 7 0 0 Mixed WM–GM lesions (N = 54) 32 0 22 ∗ 0 Juxtacortical WM lesions (N = 59) 52 7 0 0
MRI, magnetic resonance imaging; QSM, quantitative susceptibility mapping; WM–GM, white matter–gray matter; WM, white matter.
Lesion group A: a lesion in which diagnosis was not changed when the conventional MRI and QSM findings were compatible; group B: a new lesion detected by using the QSM; group C: a lesion in which the location category was changed by using the QSM; and group D: a false-positive lesion that was identified by QSM findings.
Get Radiology Tree app to read full this article<
Get Radiology Tree app to read full this article<
Get Radiology Tree app to read full this article<
Statistical Analysis
Get Radiology Tree app to read full this article<
Discussion
Get Radiology Tree app to read full this article<
Get Radiology Tree app to read full this article<
Get Radiology Tree app to read full this article<
Get Radiology Tree app to read full this article<
Get Radiology Tree app to read full this article<
Get Radiology Tree app to read full this article<
References
1. Barkhof F., Geurts J.J.: Laminar cortical damage in multiple sclerosis. Brain 2015; 138: pp. 828-829.
2. Kidd D., Barkhof F., McConnell R., et. al.: Cortical lesions in multiple sclerosis. Brain 1999; 122: pp. 17-26.
3. Brownell B., Hughes J.T.: The distribution of plaques in the cerebrum in multiple sclerosis. J Neurol Neurosurg Psychiatry 1962; 25: pp. 315-320.
4. Peterson J.W., Bo L., Mork S., et. al.: Transected neurites, apoptotic neurons, and reduced inflammation in cortical multiple sclerosis lesions. Ann Neurol 2001; 50: pp. 389-400.
5. Barkhof F., Filippi M., Miller D.H., et. al.: Comparison of MRI criteria at first presentation to predict conversion to clinically definite multiple sclerosis. Brain 1997; 120: pp. 2059-2069.
6. McDonald W.I., Compston A., Edan G., et. al.: Recommended diagnostic criteria for multiple sclerosis: guidelines from the International Panel on the diagnosis of multiple sclerosis. Ann Neurol 2001; 50: pp. 121-127.
7. Miller D.H., Thompson A.J., Filippi M.: Magnetic resonance studies of abnormalities in the normal appearing white matter and grey matter in multiple sclerosis. J Neurol 2003; 250: pp. 1407-1419.
8. Cercignani M., Bozzali M., Iannucci G., et. al.: Magnetisation transfer ratio and mean diffusivity of normal appearing white and grey matter from patients with multiple sclerosis. J Neurol Neurosurg Psychiatry 2001; 70: pp. 311-317.
9. Miki Y., Grossman R., Udupa J., et. al.: Isolated U-fiber involvement in MS preliminary observations. Neurology 1998; 50: pp. 1301-1306.
10. Hallgren B., Sourander P.: The non-haemin iron in the cerebral cortex in Alzheimer’s disease. J Neurochem 1960; 5: pp. 307-310.
11. Craelius W., Migdal M.W., Luessenhop C.P., et. al.: Iron deposits surrounding multiple sclerosis plaques. Arch Pathol Lab Med 1982; 106: pp. 397-399.
12. Bilgic B., Pfefferbaum A., Rohlfing T., et. al.: MRI estimates of brain iron concentration in normal aging using quantitative susceptibility mapping. Neuroimage 2012; 59: pp. 2625-2635.
13. Hammond K.E., Metcalf M., Carvajal L., et. al.: Quantitative in vivo magnetic resonance imaging of multiple sclerosis at 7 Tesla with sensitivity to iron. Ann Neurol 2008; 64: pp. 707-713.
14. Schweser F., Deistung A., Lehr B.W., et. al.: Differentiation between diamagnetic and paramagnetic cerebral lesions based on magnetic susceptibility mapping. Med Phys 2010; 37: pp. 5165-5178.
15. Liu T., Surapaneni K., Lou M., et. al.: Cerebral microbleeds: burden assessment by using quantitative susceptibility mapping. Radiology 2012; 262: pp. 269-278.
16. Schweser F., Deistung A., Lehr B.W., et. al.: Quantitative imaging of intrinsic magnetic tissue properties using MRI signal phase: an approach to in vivo brain iron metabolism?. Neuroimage 2011; 54: pp. 2789-2807.
17. Zivadinov R., Heininen-Brown M., Schirda C.V., et. al.: Abnormal subcortical deep-gray matter susceptibility-weighted imaging filtered phase measurements in patients with multiple sclerosis: a case-control study. Neuroimage 2012; 59: pp. 331-339.
18. Pitt D., Boster A., Pei W., et. al.: Imaging cortical lesions in multiple sclerosis with ultra-high-field magnetic resonance imaging. Arch Neurol 2010; 67: pp. 812-818.
19. Polman C.H., Reingold S.C., Edan G., et. al.: Diagnostic criteria for multiple sclerosis: 2005 revisions to the “McDonald Criteria”. Ann Neurol 2005; 58: pp. 840-846.
20. Liu J., Liu T., de Rochefort L., et. al.: Morphology enabled dipole inversion for quantitative susceptibility mapping using structural consistency between the magnitude image and the susceptibility map. Neuroimage 2012; 59: pp. 2560-2568.
21. de Rochefort L., Liu T., Kressler B., et. al.: Quantitative susceptibility map reconstruction from MR phase data using bayesian regularization: validation and application to brain imaging. Magnetic Resonance in Medicine 2010; 63: pp. 194-206.
22. Murakami Y., Kakeda S., Watanabe K., et. al.: Usefulness of quantitative susceptibility mapping for the diagnosis of Parkinson disease. American Journal of Neuroradiology 2015;
23. Filippi M., Rocca M.A.: MR imaging of multiple sclerosis. Radiology 2011; 259: pp. 659-681.
24. Ide S., Kakeda S., Ueda I., et. al.: Internal structures of the globus pallidus in patients with Parkinson’s disease: evaluation with quantitative susceptibility mapping (QSM). European radiology 2015; 25: pp. 710-718.
25. Langkammer C., Krebs N., Goessler W., et. al.: Susceptibility induced gray-white matter MRI contrast in the human brain. Neuroimage 2012; 59: pp. 1413-1419.
26. Geurts J.J., Pouwels P.J., Uitdehaag B.M., et. al.: Intracortical lesions in multiple sclerosis: improved detection with 3D double inversion-recovery MR imaging. Radiology 2005; 236: pp. 254-260.
27. Kakeda S., Korogi Y., Hiai Y., et. al.: Pitfalls of 3D FLAIR brain imaging: a prospective comparison with 2D FLAIR. Acad Radiol 2012; 19: pp. 1225-1232.