
Rationale and Objectives
To compare B-mode ultrasonography (US) alone with the combination of B-mode and contrast-enhanced (Sonazoid) late-phase pulse-inversion US for the detection of hepatic metastases by use of jackknife free-response receiver-operating characteristic (JAFROC) analysis.
Materials and Methods
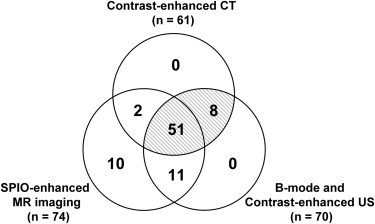
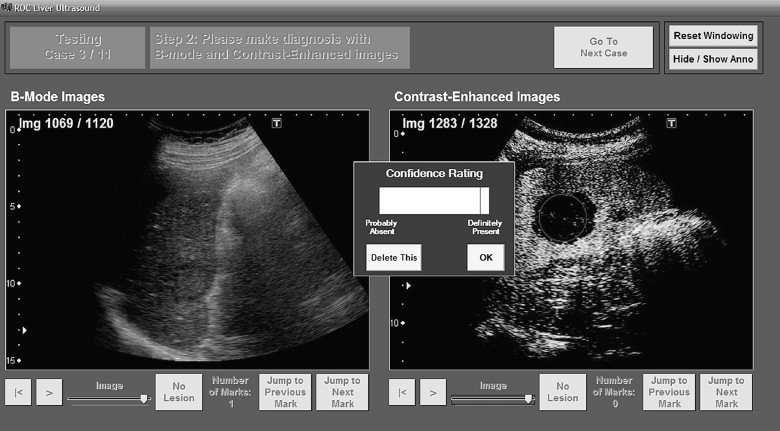
Twenty-seven patients with 57 hepatic metastases and 6 patients without hepatic metastases underwent B-mode and contrast-enhanced US. We used the diagnoses established by contrast-enhanced computed tomography and contrast-enhanced US as the standard of reference. All ultrasonographic scanning was performed by an experienced radiologist with a routine clinical procedure. All scanning data were archived with digital cine clips. A review system, which can display pairs of cine clips for B-mode and contrast-enhanced US side by side, was developed for off-site observer study. Seven radiologists interpreted each case individually first by B-mode US only, and then by the combination with contrast-enhanced US by identifying locations of possible candidates for hepatic metastasis with their confidence ratings. The figure-of-merit (FOM) values, sensitivity, and false-positives per case were estimated for B-mode US alone, and for the combination of B-mode and contrast-enhanced US.
Results
The sensitivities of the combined ultrasonographic imaging (mean, 72.2%) were clearly improved from that of B-mode US alone (mean, 41.6%) while reducing the average number of false positives from 1.1 to 0.5 per case. In the jackknife analysis, there was a statistically significant difference between mean FOM values for the combined imaging (0.76) and for B-mode US alone (0.44, P < .00001).
Conclusion
Evaluating cine clips of contrast-enhanced liver US together with B-mode US could improve physicians’ accuracy for detection of hepatic metastases.
The liver is one of the most common sites for metastases, and the detection of metastases is crucially important because of therapeutic and prognostic implications. Accurate staging is a prerequisite for successful surgery and for monitoring of chemotherapy. Because the sensitivity of conventional ultrasonography (US) for hepatic metastases was relatively poor (53%–77%) , contrast material-enhanced computed tomography (CT) and magnetic resonance (MR) imaging have been recommended for the detection of liver metastases.
It has been reported that the advent of the microbubble contrast agent SHU 508A (Levovist; Schering, Berlin, Germany) and the development of a gray-scale microbubble-specific ultrasonographic technique, which was called pulse- or phase-inversion harmonic contrast enhanced US, has remarkably improved the detection of liver metastases by use of US . However, contrast-enhanced US with SHU 508A is limited because prolonged evaluation of liver contrast enhancement cannot be performed due to a technical factor .
Get Radiology Tree app to read full this article<
Get Radiology Tree app to read full this article<
Get Radiology Tree app to read full this article<
Get Radiology Tree app to read full this article<
Materials and methods
Get Radiology Tree app to read full this article<
Patients and Reference Standards
Get Radiology Tree app to read full this article<
Get Radiology Tree app to read full this article<
Get Radiology Tree app to read full this article<
Get Radiology Tree app to read full this article<
Get Radiology Tree app to read full this article<
Get Radiology Tree app to read full this article<
Get Radiology Tree app to read full this article<
Get Radiology Tree app to read full this article<
Get Radiology Tree app to read full this article<
Get Radiology Tree app to read full this article<
Table 1
Sizes of 57 Hepatic Metastases
Diameter (mm) No. of Lesions Less than or equal to 5 10 (17.5 %) 6–10 18 (31.6 %) 11–20 16 (28.1 %) Greater than or equal to 21 13 (22.8 %)
Get Radiology Tree app to read full this article<
Ultrasonographic Examination Technique
Get Radiology Tree app to read full this article<
Get Radiology Tree app to read full this article<
Get Radiology Tree app to read full this article<
Other Examination Techniques
Get Radiology Tree app to read full this article<
Observer Performance Study
Get Radiology Tree app to read full this article<
Get Radiology Tree app to read full this article<
Get Radiology Tree app to read full this article<
Get Radiology Tree app to read full this article<
Get Radiology Tree app to read full this article<
Statistical Analysis
Get Radiology Tree app to read full this article<
Results
JAFROC Analysis
Get Radiology Tree app to read full this article<
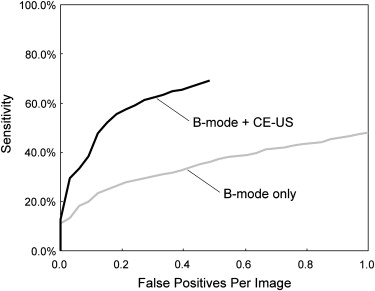
Table 2
Sensitivity, FPs/case, and FOM Values in Detection of Hepatic Metastases
B-mode US Alone Combined US Imaging Reader Sensitivity FP / Case FOM Sensitivity FP / Case FOM A 31.6 % (18/57) 0.24 (8/33) 0.33 57.9 % (33/57) 0.21 (7/33) 0.66 B 56.1 % (32/57) 1.97 (65/33) 0.55 79.0% (45/57) 0.45 (15/33) 0.82 C 38.6 % (22/57) 1.30 (43/33) 0.39 64.9 % (37/57) 0.64 (21/33) 0.66 D 36.8 % (21/57) 0.85 (28/33) 0.39 71.9 % (41/57) 0.52 (17/33) 0.78 E 50.9 % (29/57) 1.15 (38/33) 0.51 91.2 % (52/57) 0.55 (18/33) 0.93 F 38.6 % (22/57) 0.94 (31/33) 0.46 64.9 % (37/57) 0.33 (11/33) 0.74 G 38.6 % (22/57) 0.97 (32/33) 0.44 75.4 % (43/57) 0.52 (17/33) 0.76 Average 41.6 % (166/399) 1.06 (245/231) 0.44 72.2 % (288/399) ∗ 0.46 (106/231) † 0.76 ‡
Combined US imaging, combination of B-mode and contrast-enhanced US; FOM, figure of merit; FP, false-positive; US, ultrasonography.
Get Radiology Tree app to read full this article<
Get Radiology Tree app to read full this article<
Get Radiology Tree app to read full this article<
Get Radiology Tree app to read full this article<
False-positive Findings
Get Radiology Tree app to read full this article<
Table 3
Averaged Number of False-positive Lesions by Seven Readers
False-positive Lesions B-mode Combined US Imaging No. No. Fibrosis or sequelae 23.9 (167/7) 5.0 (35/7) Focal fatty sparing and focal fatty change 2.4 (17/7) 0 (0/7) Cyst 5.9 (41/7) 9.9 (69/7) Hemangioma 2.9 (20/7) 0.3 (2/7) Total 35.0 (245/7) 15.1 (106/7)
Data in parentheses are the numbers used for calculating the averaged number of false-positive lesions per reader.
Get Radiology Tree app to read full this article<
False-negative Findings
Get Radiology Tree app to read full this article<
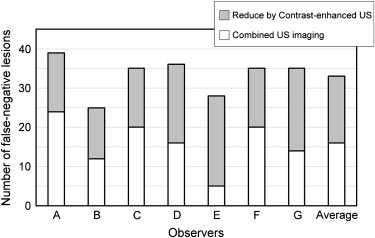
Get Radiology Tree app to read full this article<
Discussion
Get Radiology Tree app to read full this article<
Get Radiology Tree app to read full this article<
Get Radiology Tree app to read full this article<
Get Radiology Tree app to read full this article<
Get Radiology Tree app to read full this article<
Get Radiology Tree app to read full this article<
Get Radiology Tree app to read full this article<
Get Radiology Tree app to read full this article<
Get Radiology Tree app to read full this article<
Get Radiology Tree app to read full this article<
Acknowledgments
Get Radiology Tree app to read full this article<
References
1. Wernecke K., Rummeny E., Bongartz G., et. al.: Detection of hepatic masses in patients with carcinoma: comparative sensitivities of sonography, CT, and MR imaging. AJR Am J Rentogenol 1991; 157: pp. 731-739.
2. Clarke M.P., Kane R.A., Steele G., et. al.: Prospective comparison of prospective imaging and intraoperative ultrasonography in the detection of liver tumors. Surgery 1989; 106: pp. 849-855.
3. Ohlsson B., Tranberg K.G., Lundstedt C., et. al.: Detection of hepatic metastases in colorectal cancer: a prospective study of laboratory and imaging methods. Eur J Surg 1993; 159: pp. 275-281.
4. Frate D.C., Zuiani C., Viviana Londero V., et. al.: Comparing Levovist-Enhanced Pulse Inversion Harmonic Imaging and Ferumoxides-Enhanced MR Imaging of Hepatic Metastases. Am J Roentgenol 2003; 180: pp. 1339-1346.
5. Harvey C.J., Blomley M.J.K., Eckersley R.J., et. al.: Hepatic malignancies: improved detection with pulse-inversion US in late phase of enhancement with SH U 508A-early experience. Radiology 2000; 216: pp. 903-908.
6. Albrecht T., Hoffmann C.W., Schmitz S.A., et. al.: Phase-inversion sonography during the liver-specific late phase of contrast enhancement: improved detection of liver metastases. AJR 2001; 176: pp. 1191-1198.
7. Albrecht T., Blomley M.J.K., Burns P.N., et. al.: Improved detection of hepatic metastases with pulse-inversion US during the liver-specific phase of SH U 508A: multicenter study. Radiology 2003; 227: pp. 361-370.
8. Quaia E., Calliada F., Bertolotto M., et. al.: Characterization of focal liver lesions with contrast-specific US modes and a sulfur hexafluoride-filled microbubble contrast agents: diagnostic performance and confidence. Radiology 2004; 232: pp. 420-430.
9. Watanabe R., Matsumura M., Chen C.J., et. al.: Characterization of tumor imaging with microbubble-based ultrasound contrast agent, Sonazoid, in rabit liver. Biol Pharm Bull 2005; 28: pp. 972-977.
10. Watanabe R., Matsumura M., Chen C.J., et. al.: Gray-scale liver enhancement with Sonazoid (NC100100), a novel ultrasound contrast agent; detection of hepatic tumors in a rabbit model. Biol Pharm Bull 2003; 26: pp. 1272-1277.
11. Forsberg F., Piccoli C.W., Liu J.B., et. al.: Hepatic tumor detection: MR imaging and conventional US versus pulse-inversion harmonic US of NC100100 during its reticuloendothelial system–specific phase. Radiology 2002; 222: pp. 824-829.
12. Long J.A., Daanen V., Moreau-Gaudry A., Troccaz J., Rambeaud L.L., et. al.: Real-time four-dimensional (4D) ultrasound-guided prostatic biopsies a phantom. Comparative study versus 2D guidance. Prog Urol 2007; 17: pp. 1337-1342.
13. Chami L., Lassau N., Malka D., et. al.: Benefit of contrast-enhanced sonography for the detection of liver lesions: comparison with histologic findings. AJR 2008; 190: pp. 683-690.
14. Couinaud C.: Le foie: etsudes anatomiques et chirurgicales.1957.MassonParis, France 9–12
15. Bismuth H.: Surgical anatomy and anatomical surgery of the liver. World J Surg 1982; 6: pp. 3-8.
16. Mathieu D., Vilgrain V., Mahfouz A., et. al.: Benign liver tumors. Magn Reson Imaging Clin N Am 1997; 5: pp. 255-288.
17. Mortele K.J., Ros P.R.: Cystic focal liver lesions in the adult: differential CT and MR imaging features. RadioGraphics 2001; 21: pp. 895-910.
18. Horton K.M., Bluemke D.A., Hruban R.H., et. al.: CT and MR imaging of benign hepatic and biliary tumors. RadioGraphics 1999; 19: pp. 431-451.
19. Kim T., Federle M.P., Baron R.L., et. al.: Discrimination of small hepatic hemangiomas from hypervascular malignant tumors smaller than 3 cm with three-phase helical CT. Radiology 2001; 219: pp. 699-706.
20. Quaia E., Calliada F., Bertolotto M., et. al.: Characterization of focal liver lesions with contrast-specific US modes and a sulfur hexafluoride-filled microbubble contrast agent: diagnostic performance and confidence. Radiology 2004; 232: pp. 420-430.
21. Hirohashi S., Ueda K., Uchida H., et. al.: Nondiffuse fatty change of the liver: discerning pseudotumor on MR images enhanced with ferumoxides—initial observations. Radiology 2000; 217: pp. 415.
22. Kobayashi T., Xu X.W., MacMahon H., et. al.: Effect of a computer-sided diagnosis scheme on radiologists’ performance in detection of lung nodules on radiographs. Radiology 1996; 199: pp. 843-848.
23. MacMahon H., Engelman R., Behlen F.M., et. al.: Computer-aided diagnosis of pulmonary nodules: results of a large-scale observer test. Radiology 1999; 213: pp. 723.
24. Chakraborty D.P., Berbaum K.S.: Observer studies involving detection and localization: modeling, analysis, and validation. Med Phys 2004; 31: pp. 2313-2330.
25. Chakraborty D.P., Winter L.H.: Free-response methodology: alternate analysis and a new observer-performance experiment. Radiology 1990; 174: pp. 873-881.
26. Zheng B., Chakraborty D.P., Rockette H.E., et. al.: A comparison of two data analysis from two observer performance studies using jackknife ROC and JAFROC. Med Phys 2005; 32: pp. 1031-1034.
27. Chakraborty D.P.: Analysis of location specific observer performance data: validated extensions of the jackknife free-response (JAFROC) method. Acad Radiol 2006; 13: pp. 1187-1193.
28. Dorfman D.D., Berbaum K.S., Mets C.E.: Receiver operating characteristic rating analysis: generalization to the population of readers and patients with the Jackknife method. Invest Radiol 1992; 27: pp. 723-731.
29. Seneterre E., Taourel P., Bouvier Y., et. al.: Detection of hepatic metastases: ferumoxides-enhanced MR imaging versus unenhanced MR imaging and CT during arterial portography. Radiology 1996; 200: pp. 610-611.
30. Watanabe R., Matsumura M., Munemasa T., et. al.: Mechanism of hepatic parenchyma-specific contrast of microbubble-based contrast agent for ultrasonography: microscopic studies in rat liver. Invest Radiol 2007; 42: pp. 643-651.
31. Ward J., Naik K.S., Guthrie J.A., et. al.: Hepatic lesion detection: comparison of MR imaging after the administration of superparamagnetic iron oxide with dual-phase CT by using alternative-free response receiver operating characteristic analysis. Radiology 1999; 210: pp. 459-466.
32. Onishi H., Murakami T., Kim T., et. al.: Hepatic metastases: detection with multi-detector row CT, SPIO-enhanced MR imaging, and both techniques combined. Radiology 2006; 239: pp. 131-138.