
Rationale and Objectives
The objective of this work was to develop a quantitative method for improving lesion detection in dynamic contrast-enhanced magnetic resonance mammography (DCEMRM). For this purpose, we segmented and analyzed suspicious regions according to their contrast enhancement dynamics, generated a normalized maximum intensity–time ratio (nMITR) projection, and explored it to extract important features, to improve accuracy and reproducibility of detection.
Materials and Methods
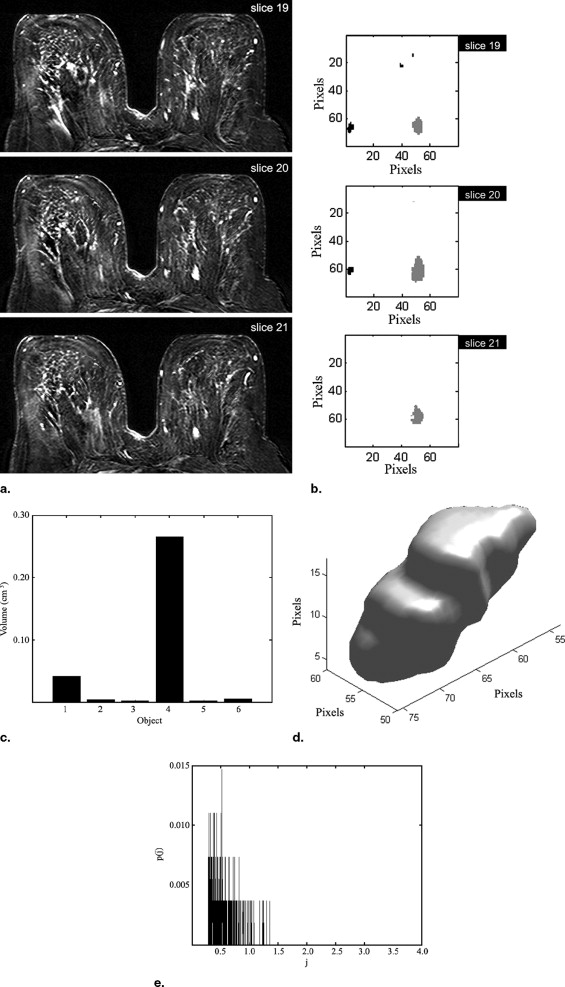
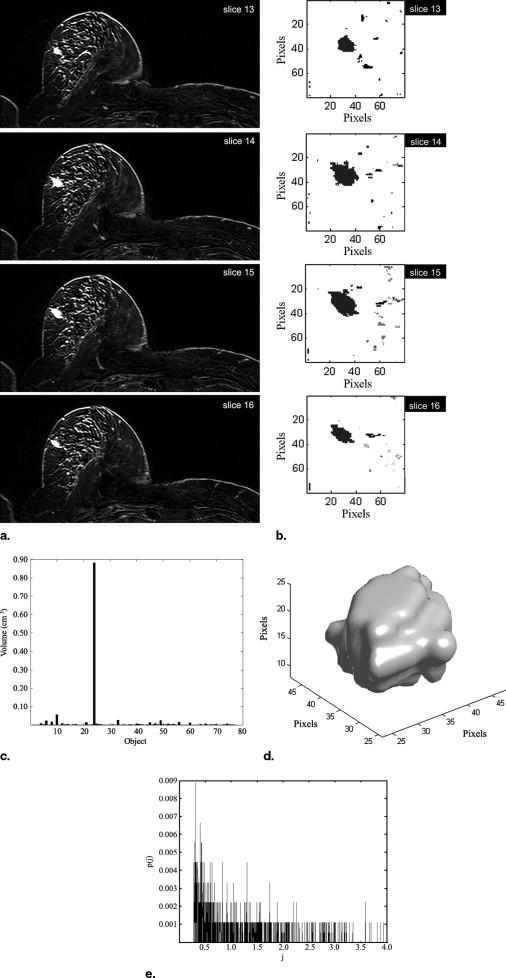
A novel automated method is introduced to segment and analyze lesions in three dimensions. It consists of four consecutive stages: volume of interest selection, nMITR projection generation using a voxel sampling method based on a moving 3 × 3 mask, three-dimensional lesion segmentation, and feature extraction. The nMITR projection of the detected lesion is used to extract six features: mean, maximum, standard deviation, kurtosis, skewness, and entropy, and their diagnostic significance is studied in detail. High-resolution MR images of 52 breast masses from 46 women are analyzed using the technique developed.
Results
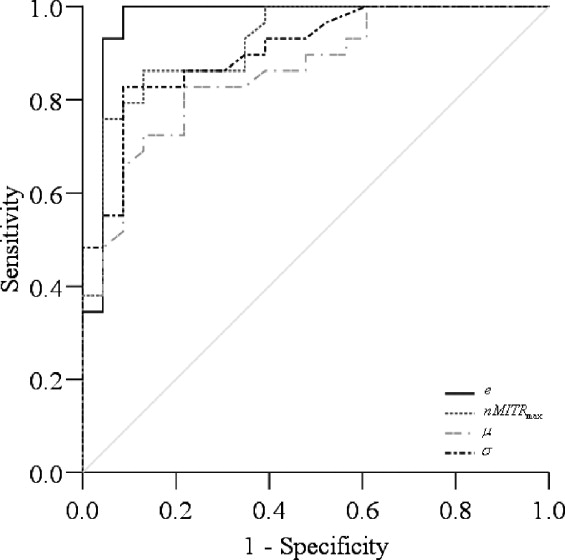
Entropy, standard deviation, and the maximum and mean value features were found to have high significance ( P < 0.001) and diagnostic accuracy (0.86–0.97). The kurtosis and skewness were not significant. Automated analysis of DCEMRM using nMITR was shown to be feasible.
Conclusion
The lesion detection method described is efficient and leads to improved, accurate, reproducible diagnoses. It is reliable in terms of observer variability and may allow for a better standardization of clinical evaluations. The findings demonstrate the usefulness of nMITR based features; nMITR-entropy shows the best performance for quantitative diagnosis.
Dynamic contrast-enhanced magnetic resonance mammography (DCEMRM) is gaining acceptance in mammographic evaluations. According to Pavic et al. ( ), only DCEMRM “has the sufficient potential for detection of lesions not seen by x-ray mammography and ultrasound, and for non-invasive characterization of breast lesions.” Although the resolution of DCEMRM is lower than that of x-ray mammography, its three-dimensional (3D) properties are invaluable in exact localization, visualization, and assessments of the aggressiveness and the multifocality of the lesions. An important advantage in favor of DCEMRM, beside absence of ionizing radiation, is that lesion-obscuring overlapping structures and summation shadows are much less pronounced in comparison with x-ray mammography because with MRM there is no need for excessive breast compression during imaging.
In DCEMRM, a contrast agent is injected and several precontrast and sequential postcontrast MR images are acquired. The concentration of the contrast agent at malignant lesions will be higher than those of the surrounding regions due to increased vascularity in these regions. Image subtraction and/or maximum intensity projection (MIP) are used to augment and detect enhancing regions. Once identified, a lesion is evaluated using various qualitative and quantitative techniques based on its morphologic and/or the enhancement properties.
Get Radiology Tree app to read full this article<
Table 1
Quantitative Measurement of nMITR from Manually Drawn ROIs †
Author Imaging Resolution No. of Cases Measurement Strategy Parameter Used to Discriminate Malignant and Benign Lesions_P_ -Value Diagnostic Accuracy Flickenger et al. (13) NA 23 (13 B, 10 M) Whole lesion ROI MITR NA Three of eight fibroadenomas indistinguishable from cancer. Liney et al. (14) NA 117 (36 B, 81 M) Whole lesion ROI nMITR 0.096 NA Nine-pixel ROI nMITR 0.023 NA 10% threshold ROI nMITR 0.001 NA Gibbs et al. (15) 256 × 128 79 (34 B, 45 M) Whole lesion ROI nMITR 0.130 0.620 Whole lesion ROI Patient age, lesion size, time to max. enhancement, and two textural parameters NA 0.920 Szabo et al. (16) 112 × 256 115 (35 B, 70 M) Whole lesion ROI The curve type, relative signal intensity decrease from the peak to the 7th and 5th postcontrast images, relative signal intensity decrease from the first to the 7th postcontrast image, nMITR, and time-to-peak features NA
Whole lesion ROI All the kinetic and the morphologic features (total of 14 features) NA
Gibbs et al. (17) 256 × 128 49 (17 B, 32 M) Whole lesion ROI nMITR 0.060 0.640 Nine-pixel ROI nMITR 0.023 0.650 Kneewshaw (18) 256 × 192 88 (68 B, 20 M) Whole lesion ROI nMITR 0.008 0.852 Nine-pixel ROI nMITR 0.019 0.795
M, malignant; B, benign; NA, not available.
Get Radiology Tree app to read full this article<
Get Radiology Tree app to read full this article<
Get Radiology Tree app to read full this article<
Get Radiology Tree app to read full this article<
Get Radiology Tree app to read full this article<
Get Radiology Tree app to read full this article<
Get Radiology Tree app to read full this article<
Get Radiology Tree app to read full this article<
Get Radiology Tree app to read full this article<
Get Radiology Tree app to read full this article<
Get Radiology Tree app to read full this article<
Get Radiology Tree app to read full this article<
Get Radiology Tree app to read full this article<
Get Radiology Tree app to read full this article<
Get Radiology Tree app to read full this article<
 Open full size image
Figure 1
Simplified flowchart of the lesion detection scheme.
Get Radiology Tree app to read full this article<
Materials and methods
Imaging Protocol
Get Radiology Tree app to read full this article<
Image Dataset
Get Radiology Tree app to read full this article<
Get Radiology Tree app to read full this article<
Written informed consent was obtained from each patient. The lesion volumes ranged from 0.07 cm 3 to 17.20 cm 3 (mean, 2.58 cm 3 ). All cases were proved either by histopathologic examination or by clinical follow-up and labeled as benign or malign. Dynamic 12-bit grayscale image sets that showed sufficient anatomical alignment were transferred from the MR scanner to a personnel computer in DICOM format for further analysis using Matlab 7.0 (The Mathworks, Inc.).
Get Radiology Tree app to read full this article<
VOI Selection
Get Radiology Tree app to read full this article<
nMITR Projection Generation
Get Radiology Tree app to read full this article<
ER(i)=IR(i)−IR(0)IR(0)×100 E
ℜ
(
i
)
=
I
ℜ
(
i
)
−
I
ℜ
(
0
)
I
ℜ
(
0
)
×
100
where i = 1,2, … 5 is a time index and represents the times at which postcontrast images are taken. I ℜ (0) is the average intensity of the precontrast image (at the reference time 0) within ℜ, I ℜ ( i ) is the average intensity of the postcontrast image at time t = 88 × i seconds within ℜ. E ℜ ( i ) represents the enhancement value of ℜ at time t = 88 × i . The nMITR values are computed using the following:
nMITRR=max{ER}Tmax n
M
I
T
R
ℜ
=
max
{
E
ℜ
}
T
max
In Equation 2 , T max denotes the time, in seconds, when the enhancement E ℜ reaches to its maximum. The above computations are repeated after moving ℜ to another voxel position within the VOI. When every voxel within the VOI is covered, a 3D nMITR projection dataset is generated. This dataset is basically used for the subsequent analyses, evaluations, and visualizations.
Get Radiology Tree app to read full this article<
3D Lesion Segmentation
Get Radiology Tree app to read full this article<
Feature Extraction
Get Radiology Tree app to read full this article<
μ=∑Nj=1p(j)×nMITR(j) μ
=
∑
j
=
1
N
p
(
j
)
×
n
M
I
T
R
(
j
)
σ=∑Nj=1p(j)×(nMITR(j)−μ)2 σ
=
∑
j
=
1
N
p
(
j
)
×
(
n
M
I
T
R
(
j
)
−
μ
)
2
k=∑Nj=1p(j)×(nMITR(j)−μ)4σ2−3 k
=
∑
j
=
1
N
p
(
j
)
×
(
n
M
I
T
R
(
j
)
−
μ
)
4
σ
2
−
3
s=∑Nj=1p(j)×(nMITR(j)−μ)3σ3 s
=
∑
j
=
1
N
p
(
j
)
×
(
n
M
I
T
R
(
j
)
−
μ
)
3
σ
3
e=−∑Nj=1p(j)×log(p(j)) e
=
−
∑
j
=
1
N
p
(
j
)
×
log
(
p
(
j
)
)
In these, μ is the average nMITR value and p(j) is the probability of the j th nMITR. N represents the number of distinct nMITR values (within 0.1% precision).
Get Radiology Tree app to read full this article<
Statistics
Get Radiology Tree app to read full this article<
Results
Get Radiology Tree app to read full this article<
Get Radiology Tree app to read full this article<
Get Radiology Tree app to read full this article<
Table 2
Significance of nMITR-Based Features
Feature Benign, Mean ± SD Malignant, Mean ± SD_t_ Value_P_ Value_nMITR_ max 1.56 ± 1.02 4.11 ± 1.54 −7.160 3.90 × 10 −9 μ 0.56 ± 0.23 1.05 ± 0.40 −5.546 1.39 × 10 −6 σ 0.24 ± 0.16 0.69 ± 0.32 −6.678 3.80 × 10 −8 s 1.20 ± 0.72 1.29 ± 0.57 −0.438 6.31 × 10 −1 k 2.07 ± 4.03 1.88 ± 2.62 0.198 8.44 × 10 −1 e 5.40 ± 0.58 6.77 ± 0.48 −9.327 1.59 × 10 −12
Table 3
Diagnostic Accuracy of nMITR-Based Features
Feature AUC SE 95% CI of AUC Lower Bound Upper Bound_nMITR_ max 0.92 0.04 0.85 0.99 μ 0.86 0.05 0.76 0.96 σ 0.90 0.04 0.82 0.98s 0.59 0.08 0.43 0.76k 0.55 0.08 0.39 0.71e 0.97 0.03 0.91 1.00
Get Radiology Tree app to read full this article<
Get Radiology Tree app to read full this article<
Discussion
Get Radiology Tree app to read full this article<
Get Radiology Tree app to read full this article<
Get Radiology Tree app to read full this article<
Get Radiology Tree app to read full this article<
Acknowledgments
Get Radiology Tree app to read full this article<
References
1. Pavic D., Koomen M.A., Kuzmiak C.M., et. al.: The role of magnetic resonance imaging in diagnosis and management of breast cancer. Technol Cancer Res Treat 2004; 3: pp. 527-541.
2. Kuhl C.K., Mielcareck P., Klaschik S., et. al.: Dynamic breast MR imaging: Are signal time course data useful for differential diagnosis of enhancing lesion?. Radiology 1999; 211: pp. 101-110.
3. Kinkel K., Helbich T.H., Essermam L.J., et. al.: Dynamic high-spatial-resolution MR imaging of suspicious breast lesions: Diagnostic criteria and interobserver variability. AJR Am J Roentgenol 2000; 175: pp. 35-43.
4. Nunes L.W., Schnall M.D., Orel S.G.: Update of breast MR imaging architectural interpretation model. Radiology 2001; 219: pp. 484-494.
5. Baum F., Fischer U., Vosshenrich R., et. al.: Classification of hypervascularized lesions in CE MR imaging of the breast. Eur Radiol 2002; 12: pp. 1087-1092.
6. Kelcz F., Santyr G.E., Cron G.O., et. al.: Application of a quantitative model to differentiate benign from malignant breast lesions detected by dynamic, gadolinium-enhanced MRI. J Magn Reson Imaging 1996; 6: pp. 743-752.
7. Mussurakis S., Buckley D.L., Horsman A.: Dynamic MRI of invasive breast cancer: Assessment of three region-of-interest analysis methods. J Comput Assist Tomogr 1997; 21: pp. 431-438.
8. Liu P.F., Debatin J.F., Caduff R.F., et. al.: Improved diagnostic ac curacy in dynamic contrast enhanced MRI of the breast by combined quantitative and qualitative analysis. Br J Radiol 1998; 71: pp. 501-509.
9. Helbich T.H., Roberts Timothy P.L., Grossmann A., et. al.: Quantitative gadopentetate-enhanced MRI of breast tumors: Testing of different analytic methods. Magn Reson Med 2000; 44: pp. 915-924.
10. Lucht Robert E.A., Knopp M.V., Brix G.: Classification of signal-time curves from dynamic MR mammography by neural networks. Magn Reson Imaging 2001; 19: pp. 51-57.
11. Gilhuijs K.G.A., Deurloo E.E., Muller S.H., et. al.: Breast MR imaging in women at increased lifetime risk of breast cancer: Clinical system for computerized assessment of breast lesions—Initial Results. Radiology 2002; 225: pp. 907-916.
12. Chen W., Giger M.L., Lan L., et. al.: Computerized interpretation of breast MRI: Investigation of enhancement-variance dynamics. Med Phys 2004; 31: pp. 1076-1082.
13. Flickenger F.W., Allison J.D., Sherry R.M., et. al.: Differentiation of benign from malignant breast masses by time intensity evaluation of contrast-enhanced MRI. Magn Reson Imaging 1993; 11: pp. 617-620.
14. Liney P.G., Gibbs P., Hayes C., et. al.: Dynamic contrast-enhanced MRI in the differentiation of breast tumors: User-defined versus semi-automated region of interest analysis. J Magn Reson Imaging 1999; 10: pp. 945-949.
15. Gibbs P., Turnbull L.W.: Textural analysis of contrast-enhanced MR images of the breast. Magn Reson Med 2003; 50: pp. 92-98.
16. Szabo B.K., Wiberg M.K., Bone B., et. al.: Application of artificial neural networks to the analysis of dynamic MR imaging features of the breast. Eur Radiol 2004; 14: pp. 1217-1225.
17. Gibbs P., Liney G.P., Lowy M., et. al.: Differentiation of benign and malignant sub-1 cm breast lesions using dynamic contrast enhanced MRI. Breast 2004; 13: pp. 115-121.
18. Kneeshaw P.J., Lowry M., Manton D., et. al.: Differentiation of benign from malignant breast disease associated with screening detected microcalcifications using dynamic contrast enhanced magnetic resonance imaging. Breast 2006; 15: pp. 29-38.
19. Parker G.J.M., Suckling J., Tanner S.F., et. al.: MRIW: Parametric analysis software for contrast-enhanced dynamic MR imaging in cancer. Radiographics 1998; 18: pp. 497-506.
20. Wiener J., Schiling K.J., Adami C., Obuchowski N.A.: Assessment of suspected breast cancer by MRI: A prospective clinical trial using a combined kinetic and morphologic analysis. AJR Am J Roentgenol 2005; 184: pp. 878-886.
21. Kelcz F., Furman-Haran E., Grobgeld D., Degani H.: Clinical testing of high-spatial resolution parametric contrast-enhanced MR imaging of the breast. AJR Am J Roentgenol 2002; 179: pp. 1485-1492.
22. Lehman C.D., Peacock S., DeMartini W.B., Chen X.: A new automated software system to evaluate breast MR examination: Improved specificity without decreased sensitivity. AJR Am J Roentgenol 2006; 187: pp. 51-56.
23. Kaiser W.A., Zeitker E.: MR imaging of the breast: Fast imaging sequences with and without Gd-DTPA. Radiology 1989; 170: 781–686
24. Obuchowski N.: Receiver operating characteristic curves and their use in radiology. Radiology 2003; 229: pp. 3-8.
25. Deurloo E.E., Muller S.H., Peterse J.L., et. al.: Clinically and mammographically occult breast lesions on MR images: Potential effect of computerized assessment on clinical reading. Radiology 2005; 234: pp. 693-701.
26. Tzacheva A.A., Najarian K., Breockway J.P.: Breast cancer detection in gadolinium-enhanced MR images by static region descriptors and neural networks. J Magn Reson Imaging 2003; 17: pp. 337-342.