
Rationale and Objectives
To investigate the effect of dual-bolus contrast media injection (dual-CM) on the accuracy of automated right ventricular (RV) segmentation on coronary computed tomography angiography (CCTA).
Materials and Methods
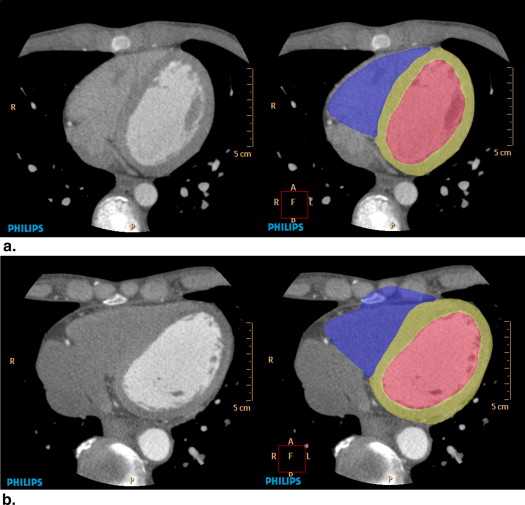
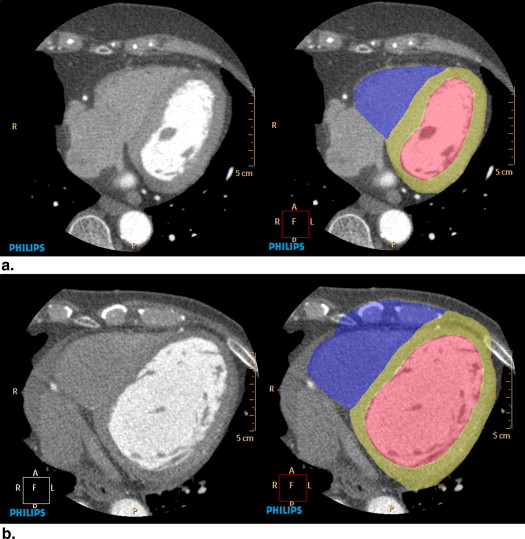
A total of 104 patients with suspected and known coronary artery disease underwent 256-slice CCTA with retrospective electrocardiographic (ECG) gating. The patients were divided into 51 patients who underwent single-bolus CM injection (single-CM) and 53 patients who underwent dual-CM. The dual-CM method consisted of an initial bolus of CM followed by an injection of dilute CM with saline (CM:saline, 1:9). Three-dimensional CCTA images were automatically segmented into the RV, left ventricle (LV), and myocardium using commercially available software (Comprehensive Cardiac Analysis; Philips Medical Systems, Cleveland, OH). Prevalence and locations of segmentation errors were compared between single-CM and dual-CM. Segmentation errors were defined as segment deviation of >1 cm from the actual ventricular margin.
Results
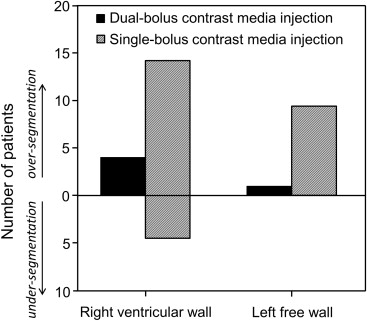
Prevalence of segmentation errors was significantly lower with dual-CM than with single-CM in the diastolic phase (4/41 vs. 20/41, respectively; P < .01), and there was no difference between the two methods in the systolic phase (2/12 vs. 2/10, respectively). With dual-CM and single-CM, the locations of segmentation errors were mostly the RV wall (4/53 and 18/51, respectively) and secondly the LV wall (2/53 and 9/51, respectively).
Conclusions
Dual-CM improved the accuracy of automated ventricular segmentation using diastolic data from 256-slice CCTA.
Since development of 64-slice computed tomography (CT), coronary CT angiography (CCTA) has been used clinically for assessment of coronary artery stenosis . In addition, because definition of large heart structures is accurate with CCTA , CCTA is useful for measurement of right ventricle (RV) volume , left ventricle (LV) volume , and LV mass . Previous studies have demonstrated that ventricular volume measurements provide useful evidence in assessment of various cardiac diseases.
Automated segmentation has been developed for ventricular segmentations of the right atrium, left atrium, RV, LV, and myocardium and can calculate the RV volume, LV volume, and myocardium volume in only about 2.5 minutes .
Get Radiology Tree app to read full this article<
Materials and methods
Patients
Get Radiology Tree app to read full this article<
Scans and Reconstruction
Get Radiology Tree app to read full this article<
Get Radiology Tree app to read full this article<
CM Injection
Get Radiology Tree app to read full this article<
Single-bolus CM injection
Get Radiology Tree app to read full this article<
Dual-bolus CM injection
Get Radiology Tree app to read full this article<
Automated Ventricular Segmentation
Get Radiology Tree app to read full this article<
Ventricular and Myocardial Enhancement
Get Radiology Tree app to read full this article<
Automatic Ventricular Segmentation Errors
Get Radiology Tree app to read full this article<
Get Radiology Tree app to read full this article<
Statistical Analysis
Get Radiology Tree app to read full this article<
Results
Patient Demographics and CM Injection
Get Radiology Tree app to read full this article<
Table 1
Patient Demographics and Scan Conditions
Dual-CM ( n = 53) Single-CM ( n = 51)P Value ∗ Demography Male-to-female † 39:14 32:19 NS Age (y) ‡ 61 ± 15 66 ± 15 NS Height (cm) ‡ 162 ± 9 161 ± 10 NS Weight (kg) ‡ 60 ± 9 60 ± 10 NS Heart rate (beats/min) ‡ 69 ± 13 67 ± 14 NS Prevalence of coronary artery disease † 12 12 NS Scan condition Diastolic phase–to–systolic phase † 41:12 41:10 NS Scan time (seconds) ‡ 6.3 ± 0.6 6.4 ± 0.5 NS Trigger of bolus tracking (seconds) ‡ 16.5 ± 3.1 16.6 ± 3.2 NS Dose–length product (mGy) ‡ 1155 ± 153 1174 ± 118 NS Contrast media volume (mL) ‡ 46 ± 7 41 ± 7 <.01 Contrast media injection rate (mL/s) ‡ 4.2 ± 0.6 4.1 ± 0.7 NS
Dual-CM, dual-bolus contrast media injection; Single-CM, single-bolus contrast media injection; NS, nonsignificant.
NS represents the P values >.05.
Get Radiology Tree app to read full this article<
Get Radiology Tree app to read full this article<
Get Radiology Tree app to read full this article<
Get Radiology Tree app to read full this article<
RV Cavity, LV Cavity, and Myocardium Attenuation
Get Radiology Tree app to read full this article<
Table 2
Attenuation in the Right Ventricle (RV), Left Ventricle (LV), and Left Ventricle Myocardium (LVM)
Cardiac Phase Location Attenuation (HU)P Value ∗ Dual-CM Single-CM Diastole RV 133 ± 4 106 ± 4 <.01 LV 336 ± 11 328 ± 11 .59 LVM 114 ± 2 113 ± 2 .60 Systole RV 120 ± 5 93 ± 4 <.01 LV 293 ± 20 313 ± 22 .20 LVM 96 ± 5 101 ± 5 .59
Dual-CM, dual-bolus contrast media injection; Single-CM, single-bolus contrast media injection.
Data are mean ± standard deviation.
Get Radiology Tree app to read full this article<
Get Radiology Tree app to read full this article<
Prevalence and Location of Segmentation Errors
Get Radiology Tree app to read full this article<
Table 3
Prevalence of Segmentation Errors
Observer Cardiac Phase Segmentation Error_P_ Value ∗ Dual-CM Single-CM 1 Diastole 4/41 (10) 20/41 (49) <.01 Systole 2/12 (16) 2/10 (20) .84 2 Diastole 4/41 (10) 19/41 (46) <.01 Systole 1/12 (8) 1/10 (10) .89
Dual-CM, dual-bolus contrast media injection; Single-CM, single-bolus contrast media injection.
Data in parentheses are percentages.
Get Radiology Tree app to read full this article<
Get Radiology Tree app to read full this article<
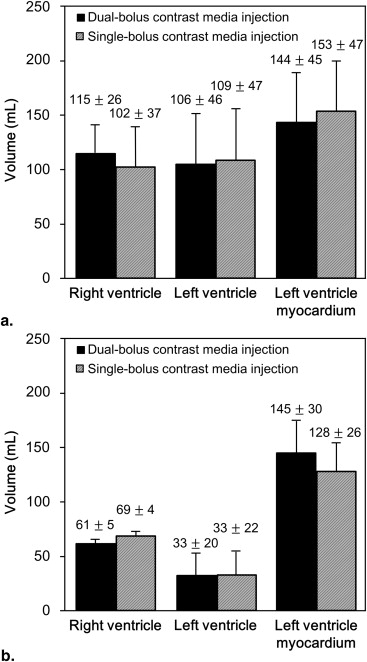
RV, LV, and Myocardium Volumes
Get Radiology Tree app to read full this article<
Get Radiology Tree app to read full this article<
Interobserver Variability
Get Radiology Tree app to read full this article<
Discussion
Get Radiology Tree app to read full this article<
Get Radiology Tree app to read full this article<
Get Radiology Tree app to read full this article<
Get Radiology Tree app to read full this article<
Get Radiology Tree app to read full this article<
Get Radiology Tree app to read full this article<
Get Radiology Tree app to read full this article<
Get Radiology Tree app to read full this article<
Acknowledgments
Get Radiology Tree app to read full this article<
Get Radiology Tree app to read full this article<
Get Radiology Tree app to read full this article<
References
1. Budoff M.J., Dowe D., Jollis J.G., et. al.: Diagnostic performance of 64-multidetector row coronary computed tomographic angiography for evaluation of coronary artery stenosis in individuals without known coronary artery disease: results from the prospective multicenter ACCURACY trial. J Am Coll Cardiol 2008; 52: pp. 1724-1732.
2. Janne d’Othée B., Siebert U., Cury R., et. al.: A systematic review on diagnostic accuracy of CT-based detection of significant coronary artery disease. Eur J Radiol 2008; 65: pp. 449-461.
3. Hausleiter J., Meyer T., Hadamitzky M., et. al.: Non-invasive coronary computed tomographic angiography for patients with suspected coronary artery disease: the CACTUS trial. Eur Heart J 2007; 28: pp. 3034-3041.
4. Stinn B., Stolzmann P., Fornaro J., et. al.: Technical principles of computed tomography in patients with congenital heart disease. Insights Imaging 2011; 2: pp. 349-356.
5. Lehnert T., Wrzesniak A., Bernhardt D., et. al.: Fully automated right ventricular volumetry from ECG-gated coronary CT angiography data: evaluation of prototype software. Int J Cardiovasc Imaging 2013; 29: pp. 489-496.
6. Juergens K.U., Fischbach R.: Left ventricular function studied with MDCT. Eur Radiol 2006; 16: pp. 342-357.
7. Jovin I.S., Ebisu K., Liu Y.H., et. al.: Left ventricular ejection fraction and left ventricular end-diastolic volume in patients with diastolic dysfunction. Congest Heart Fail 2013; 19: pp. 130-134.
8. Schwarz F., Takx R., Schoepf U.J., et. al.: Reproducibility of left and right ventricular mass measurements with cardiac CT. J Cardiovasc Comput Tomogr 2011; 5: pp. 317-324.
9. Kim H.J., Goo H.W., Park S.H., et. al.: Left ventricle volume measured by cardiac CT in an infant with a small left ventricle: a new and accurate method in determining uni- or biventricular repair. Pediatr Radiol 2013; 43: pp. 243-246.
10. Ecabert O., Peters J., Schramm H., et. al.: Automatic model-based segmentation of the heart in CT images. IEEE Trans Med Imaging 2008; 27: pp. 1189-1201.
11. Lorenz C., von Berg J.: A comprehensive shape model of the heart. Med Image Anal 2006; 10: pp. 657-670.
12. Abadi S., Roguin A., Engel A., et. al.: Feasibility of automatic assessment of four-chamber cardiac function with MDCT: initial clinical application and validation. Eur J Radiol 2010; 74: pp. 175-181.
13. Hurlock G.S., Higashino H., Mochizuki T.: History of cardiac computed tomography: single to 320-detector row multislice computed tomography. Int J Cardiovasc Imaging 2009; 25: pp. 31-42.
14. Law W.Y., Yang C.C., Chen L.K., et. al.: Retrospective gating vs. prospective triggering for noninvasive coronary angiography: assessment of image quality and radiation dose using a 256-slice CT scanner with 270 ms gantry rotation. Acad Radiol 2011; 18: pp. 31-39.
15. Nakaura T., Awai K., Yanaga Y., et. al.: Low-dose contrast protocol using the test bolus technique for 64-detector computed tomography coronary angiography. Jpn J Radiol 2011; 29: pp. 457-465.
16. Hein P.A., May J., Rogalla P., et. al.: Feasibility of contrast material volume reduction in coronary artery imaging using 320-slice volume CT. Eur Radiol 2010; 20: pp. 1337-1343.
17. Kerl J.M., Ravenel J.G., Nguyen S.A., et. al.: Right heart: split-bolus injection of diluted contrast medium for visualization at coronary CT angiography. Radiology 2008; 247: pp. 356-364.
18. Wuest W., Zunker C., Anders K., et. al.: Functional cardiac CT imaging: a new contrast application strategy for a better visualization of the cardiac chambers. Eur J Radiol 2008; 68: pp. 392-397.
19. Landis J.R., Koch G.G.: The measurement of observer agreement for categorical data. Biometrics 1977; 33: pp. 159-174.