
Rationale and Objectives
To conduct a preliminary evaluation of the use of two-dimensional (2D) enhanced multiecho T2*-weighted angiography (ESWAN) sequence for detection and quantification of siderotic nodules (SNs) in patients with liver disease.
Materials and Methods
Seventy-four patients with liver cirrhosis SNs confirmed by pathology were imaged using conventional T1-weighted imaging (T1WI), T2-weighted imaging (T2WI), T2*-weighted imaging (T2*WI), and 2D ESWAN. The signal intensity ratio (SIR) and the lesion-to-liver contrast-to-noise ratio (CNR) were calculated. The quality of SNs identification of the ESWAN images was evaluated.
Results
The SIR of SNs on ESWAN was lower than those in any other sequence, whereas the CNR of SNs on ESWAN was significantly greater than those in the other sequences ( P < .05). The conspicuity of SNs was shown to be significantly different between every pair of techniques ( P < .05). The nodules had the better conspicuity in ESWAN images than in the T1WI, T2WI, and T2*WI. Almost all (97.3%, 72 of 74) patients were considered to have excellent grade 3 conspicuity on ESWAN imaging, compared to 40.5% (30 of 74) for T2*WI. The signal intensity of small hepatic cancer on ESWAN was greater than those of SNs.
Conclusions
The detection and conspicuity of SNs is substantially improved using breath-hold 2D ESWAN. Therefore, 2D ESWAN imaging may be an alternative for the accurate detection of hepatic SNs in the future.
Hepatic iron deposition (siderosis) in patients plays an important role in the development of hepatic fibrosis, cirrhosis, and in the growth of hepatocellular carcinoma (HCC). In the process of chronic hepatic diseases, cirrhotic nodules are a reaction to chronic injury. Cirrhotic nodules, including in common, benign regenerative nodules and premalignant dysplastic nodules, are commonly characterized by iron overload. The accumulation of iron in the nodules increased the risk of malignant progression. Patients with cirrhosis unrelated to hemochromatosis may develop abnormal iron accumulation throughout the hepatic parenchyma as well as concentrated within the cirrhotic liver as regenerative or dysplastic nodules, which are called “siderotic nodules” (SNs) . SN may be markers for HCC and other chronic liver diseases, as demonstrated in research on hepatic iron deposition and the severity of hepatic disease . Active viral replication appears to play an important role in the development of SNs . Diagnosing hepatic siderosis or SNs is clinically important, especially in the care of patients with chronic viral hepatitis .
A variety of techniques have been used to detect and quantify hepatic iron content, because of its importance in the diagnosis and prognosis of related diseases, and in assessing treatment response . Magnetic resonance imaging (MRI) has emerged as a superior noninvasive method for detecting hepatic iron content. Magnetic resonance (MR) T2*-weighted imaging (T 2 *WI) is considered to be the most accurate technique for detecting iron-containing hepatic nodules . Adding phase information to T2* contrast with susceptibility-weighted imaging (SWI) provides a superior technique for the detection of iron content and hemorrhage in the brain . SWI with a multiecho approach offers a variety of advantages over the single-echo technique in the detection of small hemorrhages in brain .
Get Radiology Tree app to read full this article<
Get Radiology Tree app to read full this article<
Materials and methods
Materials
Get Radiology Tree app to read full this article<
MR Examination Method
Get Radiology Tree app to read full this article<
MR Image Postprocessing
Get Radiology Tree app to read full this article<
Imaging Evaluation
Get Radiology Tree app to read full this article<
Get Radiology Tree app to read full this article<
Get Radiology Tree app to read full this article<
Get Radiology Tree app to read full this article<
Statistical Analysis
Get Radiology Tree app to read full this article<
Results
Get Radiology Tree app to read full this article<
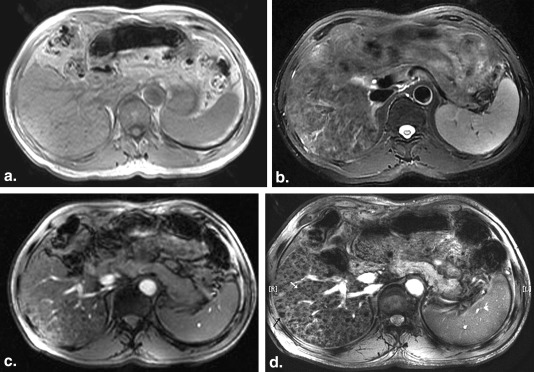
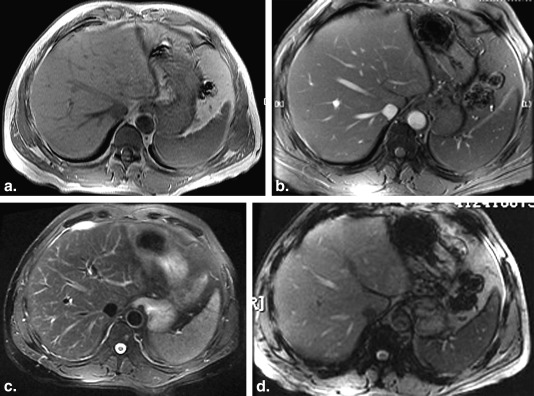
Table 1
The SNs Distribution with Different Sizes on T1WI, T2WI, T2*WI, and ESWAN
Diameters of SNs Sequences_P_ Value T1WI T2WI T2*WI ESWAN ≤0.5 cm 6 34 1806 5772 <.05 0.5–2.5 cm 188 994 1868 3666 <.05 2.5–3.5 cm 276 1358 2694 3388 <.05 >3.5 cm 374 894 1210 ∗ 1218 <.05∗
ESWAN, multiecho T2*-weighted angiography; SNs, siderotic nodules; T1WI, T1-weighted imaging; T2WI, T2-weighted imaging; T2*WI, T2*-weighted imaging.
Get Radiology Tree app to read full this article<
Table 2
The Total Number of SNs Detected by T1WI, T2WI, T2*WI, and ESWAN
Sequences_P_ Value T 1 WI T 2 WI T 2 *WI ESWAN Number of SNs 844 3280 7578 14,044 <.05 Detection rate (%) 6.0 23.4 54.0 100 <.05
ESWAN, multiecho T2*-weighted angiography; SNs, siderotic nodules; T1WI, T1-weighted imaging; T2WI, T2-weighted imaging; T2*WI, T2*-weighted imaging.
Table 3
The SIRs and CNRs of SN on Two-dimensional ESWAN, T 1 WI, T 2 WI, and T 2 *WI
Sequences_P_ Value T 1 WI T 2 WI T 2 *WI ESWAN SIRs 0.89 ± 0.18 0.60 ± 0.21 0.52 ± 0.23 0.33 ± 0.26 <.05 CNRs 8.0 ± 0.22 9.70 ± 0.19 10.10 ± 0.13 12.47 ± 0.32 <.05
CNR, contrast-to-noise ratio; ESWAN, multiecho T2*-weighted angiography; SIR, signal intensity ratio; T1WI, T1-weighted imaging; T2WI, T2-weighted imaging; T2*WI, T2*-weighted imaging.
Get Radiology Tree app to read full this article<
Get Radiology Tree app to read full this article<
Table 4
Conspicuity Grade of SNs in Each Magnetic Resonance Sequence
Grade T1WI ∗ ( N = 74) T2WI ( N = 74) T2*WI ( N = 74) ESWAN ( N = 74) 1 44 (59.5) 40 (54.1) 14 (18.9) 0 (0) 2 14 (18.9) 24 (32.4) 30 (40.5) 2 (2.7) 3 4 (5.4) 10 (13.5) 30 (40.5) 72 (97.3)
ESWAN, multiecho T2*-weighted angiography; T1WI, T1-weighted imaging; T2WI, T2-weighted imaging; T2*WI, T2*-weighted imaging.
Data are expressed as n (%).
Get Radiology Tree app to read full this article<
Get Radiology Tree app to read full this article<
Discussion
Get Radiology Tree app to read full this article<
Get Radiology Tree app to read full this article<
Get Radiology Tree app to read full this article<
Get Radiology Tree app to read full this article<
Get Radiology Tree app to read full this article<
Acknowledgment
Get Radiology Tree app to read full this article<
Get Radiology Tree app to read full this article<
References
1. Facchini F.S., Hua N.W., Stoohs R.A.: Effect of iron depletion in carbohydrate-intolerant patients with clinical evidence of nonalcoholic fatty liver disease. Gastroenterology 2002; 122: pp. 931-939.
2. Kowdley K.V.: Iron, hemochromatosis, and hepatocellular carcinoma. Gastroenterology 2004; 127: pp. S79-S86.
3. Kew M.C.: Hepatic iron overload and hepatocellular carcinoma. Cancer Letters 2009; 286: pp. 38-43.
4. Zhang J., Krinsky G.A.: Iron containing nodules of cirrhosis. NMR Biomed 2004; 17: pp. 459-464.
5. Chandarana H., Lim R.P., Jensen J.H., et. al.: Hepatic iron deposition in patients with liver disease: preliminary experience with breathhold multiecho T2*-weighted sequence. AJR Am J Roentgenol 2009; 193: pp. 1261-1267.
6. Nahon P., Ganne-Carrié N., Trinchet J.C., et. al.: Hepatic iron overload and risk of hepatocellular carcinoma in cirrhosis. Gastroenterol Clin Biol 2010; 34: pp. 1-7.
7. Ludwig J., Hashimoto E., Porayko M.K., et. al.: Hemosiderosis in cirrhosis: a study of 447 native livers. Gastroenterology 1997; 112: pp. 882-888.
8. Van Thiel D.H., Friedlander L., Fagiuoli S., et. al.: Response to interferon alpha therapy is influenced by the iron content of the liver. J Hepatol 1994; 20: pp. 410-415.
9. Barton A.L., Banner B.F., Cable E.E., et. al.: Distribution of iron in the liver predicts the response of chronic hepatitis C infection to interferon therapy. Am J Clin Pathol 1995; 103: pp. 419-424.
10. Szurowska E., Sikorska K., Izycka-Swieszewska E., et. al.: The role of MR imaging in detection of hepatic iron overload in patients with cirrhosis of different origins. BMC Gastroenterol 2010; 10: pp. 13.
11. Denk C., Rauscher A.: Susceptibility weighted imaging with multiple echoes. J Magn Reson Imaging 2010; 31: pp. 185-191.
12. Chen X., Zeng C., Luo T., et. al.: Iron deposition of the deep grey matter in patients with multiple sclerosis and neuromyelitis optica: a control quantitative study by 3D-enhanced susceptibility-weighted angiography (ESWAN). Eur J Radiol 2012; 81: pp. e633-e639.
13. Mittal S., Wu Z., Neelavalli J., et. al.: Susceptibility-weighted imaging: technical aspects and clinical applications, part 2. AJNR Am J Neuroradiol 2009; 30: pp. 232-252.
14. Haacke E.M., Mittal S., Wu Z., et. al.: Susceptibility-weighted imaging: technical aspects and clinical applications, part 1. AJNR Am J Neuroradiol 2009; 30: pp. 19-301.
15. Ide S., Kakeda S., Korogi Y., et. al.: Delineation of optic radiation and stria of Gennari on high-resolution phase difference enhanced imaging. Acad Radiol 2012; 19: pp. 1283-1289.
16. Ouyang H.Q., Gong Z.J., Zha Y.F., et. al.: Splenic siderotic nodules in patients with liver cirrhosis. Exp Ther Med 2013; 6: pp. 445-450.
17. Jing Z., Lang C., Chen-Yuan W., et. al.: Haemorrhagic shearing lesions associated with diffuse axonal injury: application of T2 star-weighted angiography sequence in the detection and clinical correlation. Br J Neurosurg 2011; 25: pp. 596-605.
18. Mie M.B., Nissen J.C., Zöllner F.G., et. al.: Susceptibility weighted imaging (SWI) of the kidney at 3T—initial results. Z Med Phys 2010; 20: pp. 143-150.
19. Boeckh-Behrens T., Lutz J., Lummel N., et. al.: Susceptibility-weighted angiography (SWAN) of cerebral veins and arteries compared to TOF-MRA. Eur J Radiol 2012; 81: pp. 1238-1245.
20. Liu L.X., Yi H.L., Han H.B., et. al.: Application of T2 measurement on gradient echo T2-weighted imaging in differential diagnosis of intracranial hemorrhage and calcification. Chin Med J (Engl) 2012; 125: pp. 2104-2108.
21. Guo L.F., Wang G., Zhu X.Y., et. al.: Comparison of ESWAN, SWI-SPGR, and 2D T2*-weighted GRE sequence for depicting cerebral microbleeds. Clin Neuroradiol 2013; 23: pp. 121-127.
22. Duyn J.H., van Gelderen P., Li T.Q., et. al.: High-field MRI of brain cortical substructure based on signal phase. Proc Natl Acad Sci USA 2007; 104: pp. 11796-11801.
23. Jenkinson M.: Fast, automated, N-dimensional phase-unwrapping algorithm. Magn Reson Med 2003; 49: pp. 193-197.
24. Wang Y., Yu Y., Li D., et. al.: Artery and vein separation using susceptibility-dependent phase in contrast-enhanced MRA. J Magn Reson Imaging 2000; 12: pp. 661-670.
25. Hirokawa Y., Isoda H., Maetani Y.S., et. al.: Hepatic lesions: improved image quality and detection with the periodically rotated overlapping parallel lines with enhanced reconstruction technique–evaluation of SPIO-enhanced T2-weighted MR images. Radiology 2009; 251: pp. 388-397.