
Rationale and Objectives
We aim to improve the image quality of coronary computed tomography angiography (CCTA) by using personalized weight and height-dependent scan trigger threshold.
Materials and Methods
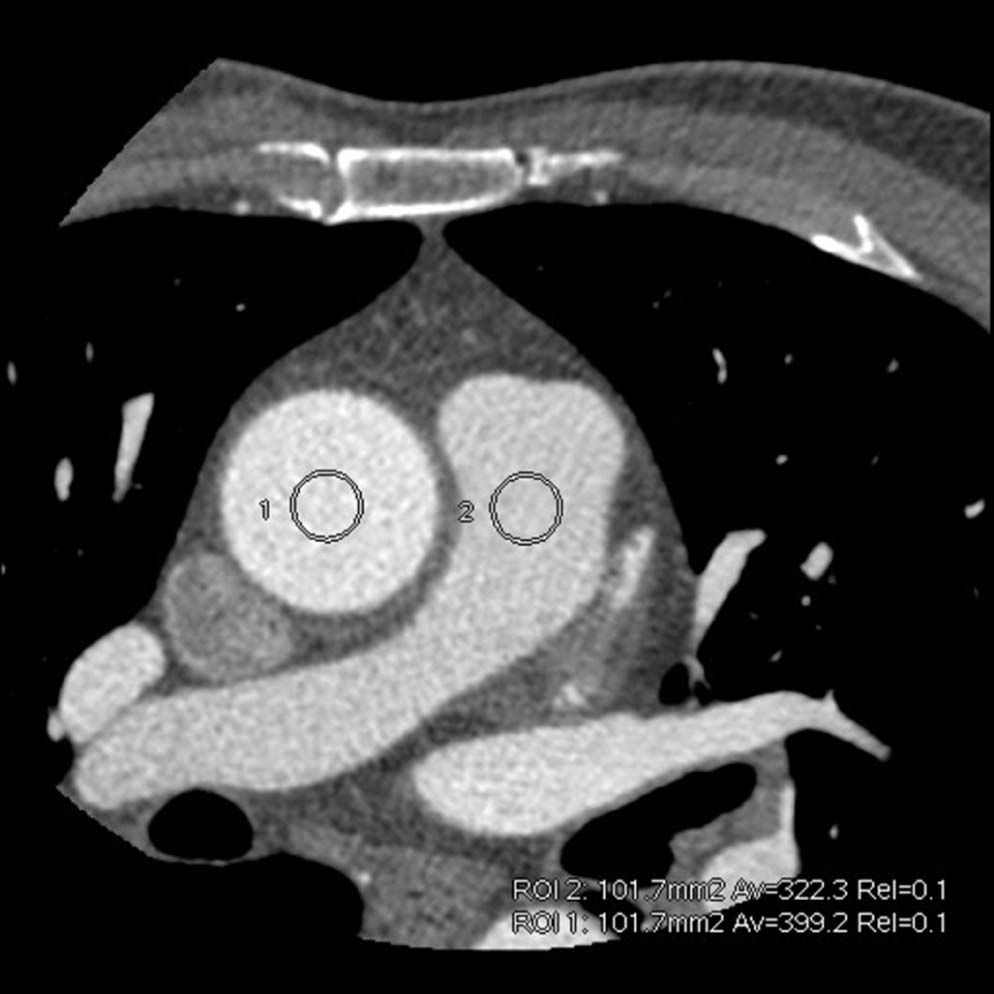
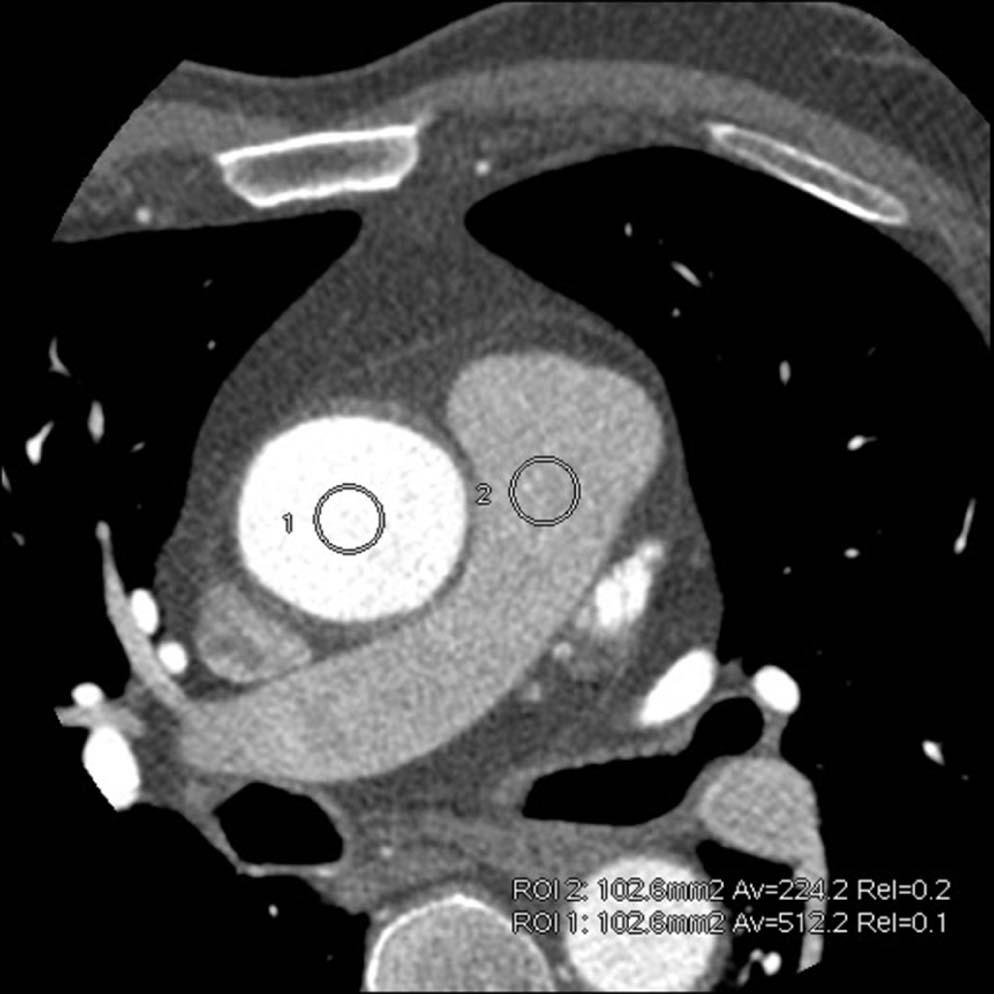
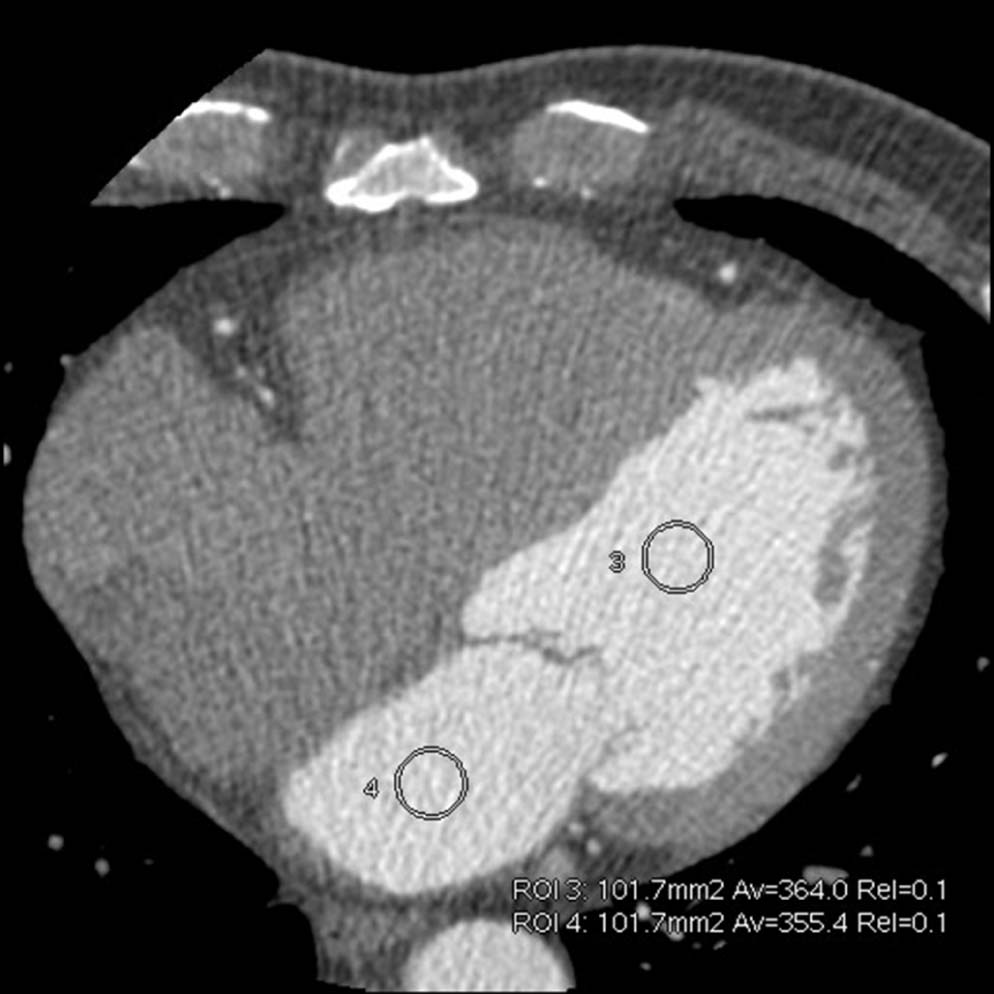
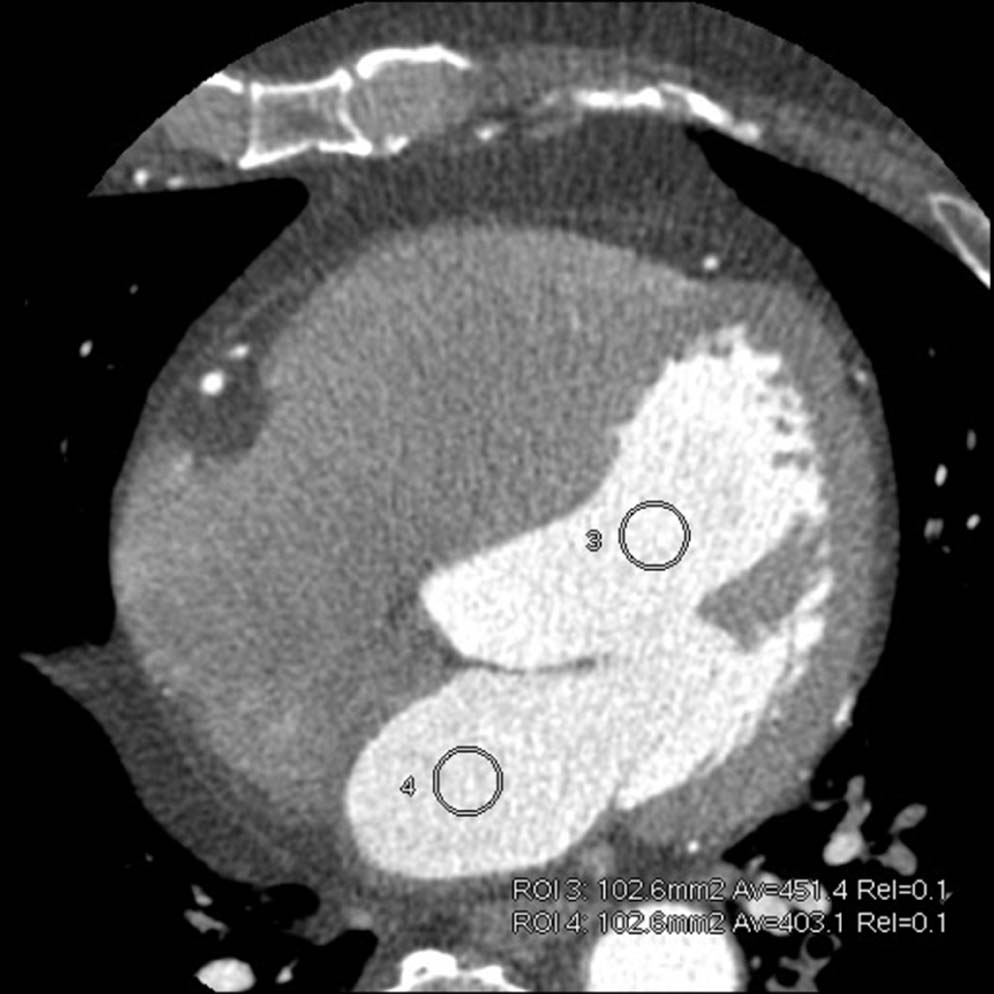
This study was divided into two parts. First, we performed and analyzed the 100 scheduled CCTA data, which were acquired by using body mass index-dependent Smart Prep sequence (trigger threshold ranged from 80 Hu to 250 Hu based on body mass index). By identifying the cases of high quality image, a linear regression equation was established to determine the correlation among the Smart Prep threshold, height, and body weight. Furthermore, a quick search table was generated for weight and height-dependent Smart Prep threshold in CCTA scan. Second, to evaluate the effectiveness of the new individual threshold method, an additional 100 consecutive patients were divided into two groups: individualized group ( n = 50) with weight and height-dependent threshold and control group ( n = 50) with the conventional constant threshold of 150 HU. Image quality was compared between the two groups by measuring the enhancement in coronary artery, aorta, left and right ventricle, and inferior vena cava. By visual inspection, image quality scores were performed to compare between the two groups.
Results
Regression equation between Smart Prep threshold (K, Hu), height (H, cm), and body weight (BW, kg) was K = 0.811 × H + 1.917 × BW − 99.341. When compared to the control group, the individualized group presented an average overall increase of 12.30% in enhancement in left main coronary artery, 12.94% in proximal right coronary artery, and 10.6% in aorta. Correspondingly, the contrast-to-noise ratios increased by 26.03%, 27.08%, and 23.17%, respectively, and by 633.1% in contrast between aorta and left ventricle. Meanwhile, the individualized group showed an average overall decrease of 22.7% in enhancement of right ventricle and 32.7% in inferior vena cava. There was no significant difference of the image noise between the two groups ( P > .05). By visual inspection, the image quality score of the individualized group was higher than that of the control group.
Conclusion
Using personalized weight and height-dependent Smart Prep threshold to adjust scan trigger time can significantly improve the image quality of CCTA.
Introduction
Coronary computed tomography angiography (CCTA) is noninvasive and provides high diagnostic efficacy of detecting cardiovascular diseases (CVD) relative to invasive catheter angiography (ICA) . In recent researches, as a gatekeeper, CCTA presented highly sensitive utility for exclusion of CVD because of its excellent negative predictive value (NPV) . In addition, CCTA, which is convenient and widely used in clinical CVD diagnosis , is associated with cost-effectiveness relative to ICA.
Image quality plays a vital role in CCTA for achieving accurate diagnostic results. In many parameters, the individual’s height and weight are important factors affecting the quality of the image in clinical examination . Therefore, different patients may need different scan protocols to achieve optimum image quality.
Get Radiology Tree app to read full this article<
Get Radiology Tree app to read full this article<
Materials and Methods
General Data
Get Radiology Tree app to read full this article<
Get Radiology Tree app to read full this article<
TABLE 1
Correlation Between Smart Prep Scan Threshold (HU) and BMI of Patients
BMI 15 16 17 18 19 20 21 22 23 24 25 26 27 28 29 30 31 32 HU 80 90 100 110 120 130 140 150 160 170 180 190 200 210 220 230 240 250
BMI, body mass index; HU, Hounsfield unit.
Get Radiology Tree app to read full this article<
Get Radiology Tree app to read full this article<
CCTA Acquisition
Get Radiology Tree app to read full this article<
Get Radiology Tree app to read full this article<
Image Quality Evaluation
Get Radiology Tree app to read full this article<
Get Radiology Tree app to read full this article<
Evaluation of Radiation Dose
Get Radiology Tree app to read full this article<
Statistical Analysis
Get Radiology Tree app to read full this article<
Results
Establishment of a Quick Search Table for Individualized Scan Threshold
Get Radiology Tree app to read full this article<
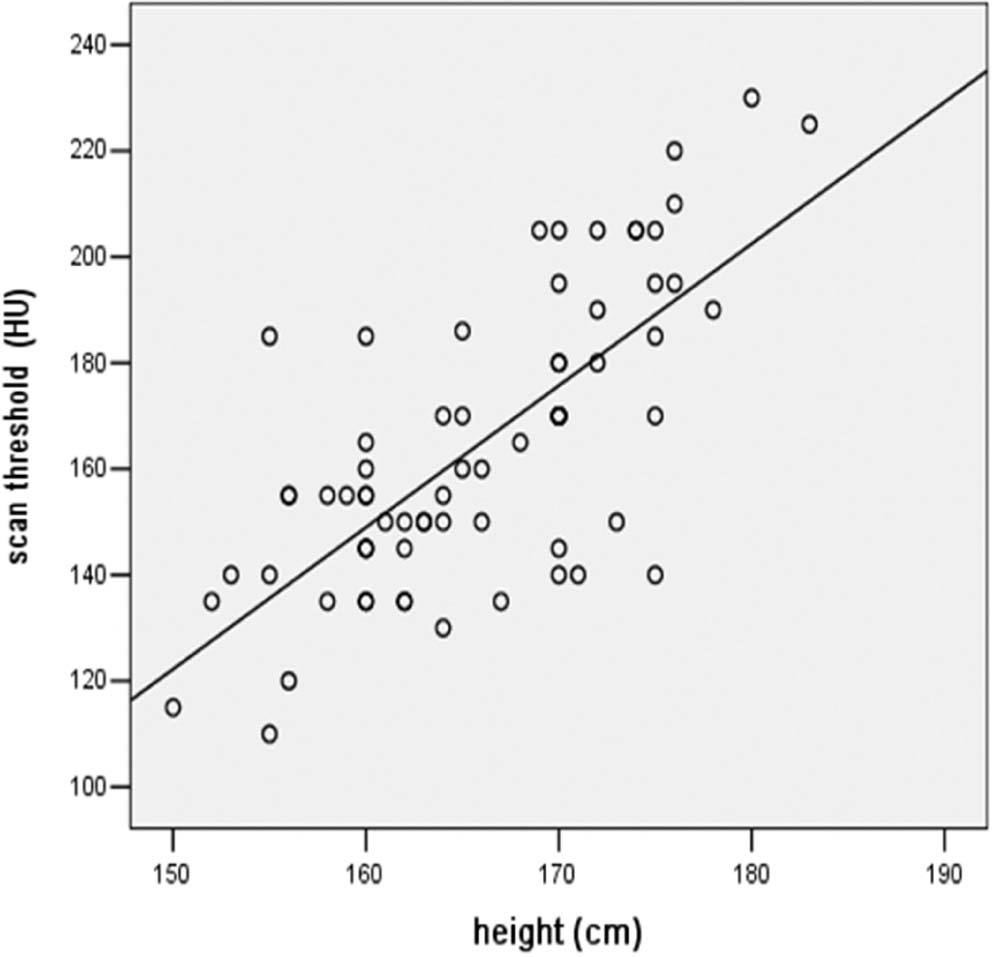
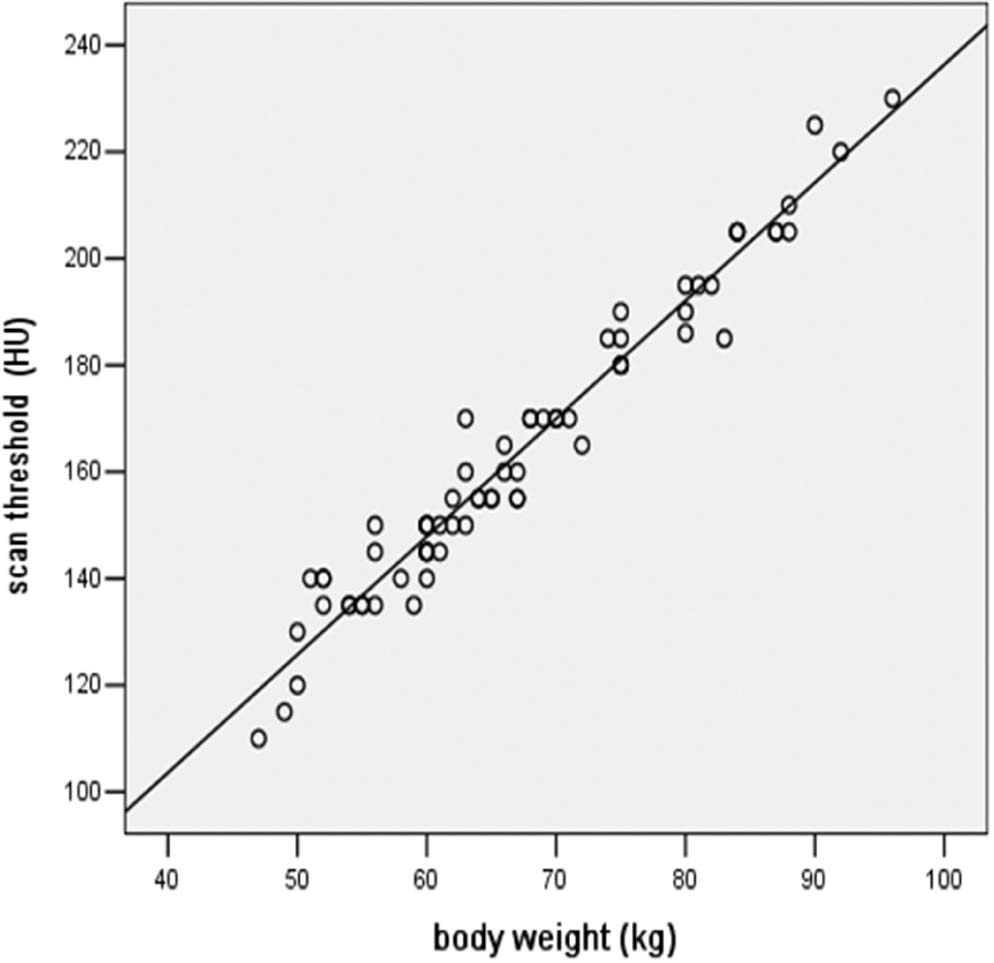
TABLE 2
A Quick Search Table of Height, Body Weight, and Individualized Scan Threshold
 Open full size image
BW, body weight; CM, contrast medium.
The CM usage was BW × 0.8 mL/kg in the light gray part and BW × 0.9 mL/kg in the deep gray part.
Get Radiology Tree app to read full this article<
Validation of the Patient Weight and Height-Dependent Scan Threshold
Get Radiology Tree app to read full this article<
TABLE 3
Patient Information, Contrast Medium, Radiation Dose, and Image Quality for the Different Groups ( n = 50 in Each Group)
Individualized Group Control Group_t_ Value_P_ Value Patient information Age (y) 58.12 ± 9.65 57.34 ± 11.69 0.36 .72 Heart rate (bpm) 69.12 ± 8.74 69.18 ± 8.40 −0.04 .97 Height (cm) 166.88 ± 6.29 168.84 ± 6.82 −1.49 .14 Body weight (kg) 69.78 ± 10.09 72.38 ± 12.44 −1.15 .25 BMI (kg/m 2 ) 25.03 ± 3.13 25.29 ± 3.37 −0.40 .69 Contrast medium Volume (mL) 55.40 ± 9.03 57.50 ± 10.80 −1.06 .29 Inject speed (mL/s) 5.0 ml/s 5.0 ml/s Scan threshold Trigger (HU) 152.60 ± 28.42 150.00 ± 0.00 0.65 .52 Radiation dose ED (mSv) 2.80 ± 0.48 2.85 ± 0.51 −0.47 .64 Exposure time (s) 1.31 ± 0.22 1.33 ± 0.23 −0.45 .65 Image quality CT value of left main coronary artery 521.54 ± 44.34 464.42 ± 52.46 5.88 .00 CNR of left main coronary artery 18.06 ± 3.10 14.33 ± 2.93 6.18 .00 CT value of proximal right coronary artery 514.66 ± 47.27 455.70 ± 56.37 5.67 .00 CNR of proximal right coronary artery 17.74 ± 2.89 13.96 ± 2.92 6.51 .00 CT value of aorta 533.76 ± 38.06 482.54 ± 42.75 6.33 .00 CNR of aorta 18.50 ± 2.78 15.02 ± 2.71 6.34 .00 CT value of right ventricle 99.40 ± 20.22 128.58 ± 64.53 −3.05 .03 CT value of inferior vena cava 62.34 ± 12.13 92.64 ± 33.61 −6.00 .00 Difference between aorta and left ventricle 92.22 ± 26.09 12.58 ± 17.36 2.97 .04 Image noise 25.80 ± 2.67 26.28 ± 2.80 −0.88 .38
BMI, body mas index; CT, computed tomography; CNR, contrast-to-noise ratio; ED, effective dose; HU, Hounsfield unit;
P < .05 indicates significant difference.
Get Radiology Tree app to read full this article<
Get Radiology Tree app to read full this article<
Get Radiology Tree app to read full this article<
Discussion
Effects of Scan Threshold on Scan Time Window in 64-Row CT Coronary Angiography
Get Radiology Tree app to read full this article<
Get Radiology Tree app to read full this article<
Application Value of the Individualized Scan Threshold Classification in Improving the Scan Effect
Get Radiology Tree app to read full this article<
Innovation and Application of the Study Results
Get Radiology Tree app to read full this article<
Advantages and Disadvantages of the Study
Get Radiology Tree app to read full this article<
Get Radiology Tree app to read full this article<
Acknowledgments
Get Radiology Tree app to read full this article<
References
1. Menke J., Kowalski J.: Diagnostic accuracy and utility of coronary CT angiography with consideration of unevaluable results: a systematic review and multivariate Bayesian random-effects meta-analysis with intention to diagnose. Eur Radiol 2016; 26: pp. 451-458.
2. Iyengar S.S., Morgan-Hughes G., Ukoumunne O., et. al.: Diagnostic accuracy of high-definition CT coronary angiography in high-risk patients. Clin Radiol 2016; 71: pp. 151-158.
3. Doris M., Newby D.E.: Coronary CT angiography as a diagnostic and prognostic tool: perspectives from the SCOT-HEART Trial. Curr Cardiol Rep 2016; 18: pp. 18.
4. Thomas D.M., Branch K.R., Cury R.C.: PROMISE of coronary CT angiography: precise and accurate diagnosis and prognosis in coronary artery disease. South Med J 2016; 109: pp. 242-247.
5. Abidov A., Gallagher M.J., Chinnaiyan K.M., et. al.: Clinical effectiveness of coronary computed tomographic angiography in the triage of patients to cardiac catheterization and revascularization after inconclusive stress testing: results of a 2-year prospective trial. J Nucl Cardiol 2009; 16: pp. 701-713.
6. Dewey M., Rief M., Martus P., et. al.: Evaluation of computed tomography in patients with atypical angina or chest pain clinically referred for invasive coronary angiography: randomised controlled trial. BMJ 2016; 355: pp. i5441.
7. Moss A.J., Newby D.E.: CT coronary angiographic evaluation of suspected anginal chest pain. Heart 2016; 102: pp. 263-268.
8. Mahdavi A., Mohammadzadeh A., Joodi G., et. al.: Diagnostic accuracy of dual-source computerized tomography coronary angiography in symptomatic patients presenting to a referral cardiovascular center during daily clinical practice. Iran J Radiol 2016; 13: pp. e24350.
9. Zeb I., Abbas N., Nasir K., et. al.: Coronary computed tomography as a cost-effective test strategy for coronary artery disease assessment—a systematic review. Atherosclerosis 2014; 234: pp. 426-435.
10. Kühl J.T., Hove J.D., Kristensen T.S., et. al.: Coronary CT angiography in clinical triage of patients at high risk of coronary artery disease. Scand Cardiovasc J 2016; Epub 9 Aug 2016
11. Mangold S., Wichmann J.L., Schoepf U.J., et. al.: Diagnostic accuracy of coronary CT angiography using 3rd-generation dual-source CT and automated tube voltage selection: clinical application in a non-obese and obese patient population. Eur Radiol 2016; Epub 28 Sep 2016
12. Burgers L.T., Redekop W.K., Al M.J., et. al.: Cost-effectiveness analysis of new generation coronary CT scanners for difficult-to-image patients. Eur J Health Econ 2016; Epub 20 Sep 2016
13. MacLachlan H., Thomas R., Langtree J., et. al.: Is there a role for a local inpatient CT coronary angiography service in selected patients with acute coronary syndrome? A cohort analysis of inpatient tertiary centre referrals for invasive coronary angiography. Open Heart 2016; 3: pp. e000389.
14. Cademartiri F., Maffei E., Palumbo A.A., et. al.: Influence of intra-coronary enhancement on diagnostic accuracy with 64-slice CT coronary angiography. Eur Radiol 2008; 18: pp. 576-583.
15. Utsunomiya D., Tanaka R., Yoshioka K., et. al.: Relationship between diverse patient body size- and image acquisition-related factors, and quantitative and qualitative image quality in coronary computed tomography angiography: a multicenter observational study. Jpn J Radiol 2016; 34: pp. 548-555.
16. Zhu X., Zhu Y., Liu W., et. al.: Improved image-quality consistency in coronary CT angiography using a test-bolus-based individually tailored contrast medium injection protocol. Clin Radiol 2016; 71: pp. 1113-1119.
17. Mihl C., Kok M., Altintas S., et. al.: Evaluation of individually body weight adapted contrast media injection in coronary CT-angiography. Eur J Radiol 2016; 85: pp. 830-836.
18. Svensson A., Cederlund K., Aspelin P., et. al.: The effect of arm positioning on timing and enhancement of intravenous contrast media at coronarycomputed tomography angiography. Acta Radiol 2016; 57: pp. 1049-1055.
19. Beeres M., Loch M., Schulz B., et. al.: Bolus timing in high-pitch CT angiography of the aorta. Eur J Radiol 2013; 82: pp. 1028-1033.
20. Adibi A., Shahbazi A.: Automatic bolus tracking versus fixed time-delay technique in biphasic multidetector computed tomography of the abdomen. Iran J Radiol 2014; 11: pp. e4617.
21. Hsieh J., Londt J., Vass M., et. al.: Step-and-shoot data acquisition and reconstruction for cardiac X-ray computed tomography. Med Phys 2006; 33: pp. 4236-4248.
22. Kessler R., Hegenscheid K., Fleck S., et. al.: Patient body weight-tailored contrast medium injection protocol for the craniocervical vessels: a prospective computed tomography study. PLoS ONE 2014; 9: pp. e88867.
23. Malayeri A.A., Zimmerman S.L., Lake S.T., et. al.: 128-Slice dual source coronary CTA: defining optimal arterial enhancement levels. Emerg Radiol 2014; 21: pp. 499-504.
24. Takumi K., Fukukura Y., Shindo T., et. al.: Feasibility of a fixed scan delay technique using a previous bolus tracking technique data for dynamic hepatic CT. Eur J Radiol 2012; 81: pp. 2996-3001.
25. Erdoğan C., Savci G.: Effect of different threshold levels and injection rates on hepatic enhancement by using bolus tracking technique in helical CT. Tani Girisim Radyol 2003; 9: pp. 207-212.
26. Stenzel F., Rief M., Zimmermann E., et. al.: Contrast agent bolus tracking with a fixed threshold or a manual fast start for coronary CT angiography. Eur Radiol 2014; 24: pp. 1229-1238.