
Rationale and Objectives
To implement a preprocedural checklist in gastrointestinal (GI)/genitourinary (GU) fluoroscopy suites to assist radiology residents in performing studies with optimal fluoroscopic technique with a goal to lower radiation dose delivered to patients and operators.
Materials and Methods
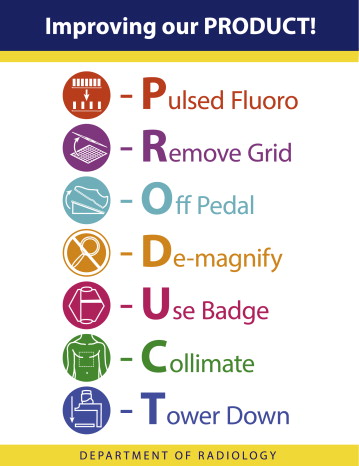
We introduced a preprocedural checklist in the form of a mnemonic to first-year resident fluoroscopy operators. The checklist was augmented by teaching sessions at the fluoroscopy tower. Fluoroscopy time (FT) was collected for GI/GU fluoroscopy studies performed by first-year residents who did not use the checklist (year 1) and compared with FT from first-year residents who used the checklist for one full academic year (year 2). Residents in both groups were surveyed to assess their knowledge of radiation safety at the end of their respective radiology 1 (R1) academic years.
Results
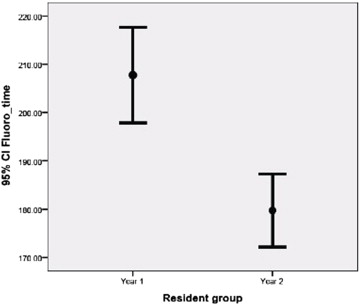
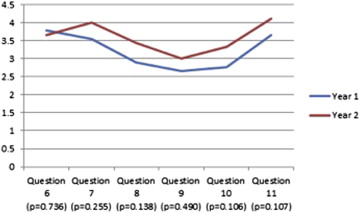
A total of 778 examinations were analyzed from year 1, and 941 total examinations from year 2. After implementation of the checklist, mean FT for all studies decreased by 41.1 seconds ( P < .0001) in year 2 residents. Multivariate linear regression confirmed that year of examination was the strongest independent predictor of FT when other covariates such as resident age, gender, and experience and patient age and gender were included. Radiation safety knowledge was similar in both groups but self-reported confidence in safe fluoroscopy tower operation increased slightly in year 2 ( P = .144).
Conclusions
A visual preprocedural radiation safety checklist in GI/GU fluoroscopy was associated with a reduction in mean FT and may contribute to a culture of radiation safety awareness.
Since the 1980s, the US population’s exposure to medical ionizing radiation has more than doubled . Increased use of computed tomography is the largest source of the increase with smaller contributions from nuclear medicine, interventional fluoroscopy, and conventional radiography and fluoroscopy . Although controversy exists over the degree of risk associated with medical radiation, there is a general consensus in the radiology community that steps should be taken to limit unnecessary exposure. Examples include advocating for the use of the ALARA principle urging radiologists to perform studies delivering a dose of radiation that is “as low as reasonably achievable,” and the development of the Image Wisely and Image Gently guidelines by the American College of Radiology and the Society of Pediatric Radiology, respectively .
Inspired by leaders in medical checklist development and following on from recent efforts to incorporate checklists within radiology departments , we designed a preprocedural checklist for fluoroscopy studies to optimize safe fluoroscopy tower operation with the goal of reducing radiation dose. Our hypothesis is that the use of the checklist will decrease radiation dose delivered to patients and operators (as measured by fluoroscopy time) and will promote the awareness of radiation safety in gastrointestinal (GI) and genitourinary (GU) radiology in our department. The purpose of this study was to operationalize the checklist, assess qualitative and quantitative changes in radiation dose awareness among first-year resident fluoroscopists, and track intraprocedural fluoroscopy times as a surrogate measure of radiation exposure for patients and operators.
Materials and methods
Study Design
Get Radiology Tree app to read full this article<
Checklist Development
Get Radiology Tree app to read full this article<
Get Radiology Tree app to read full this article<
Get Radiology Tree app to read full this article<
Get Radiology Tree app to read full this article<
Data Collection
Get Radiology Tree app to read full this article<
Get Radiology Tree app to read full this article<
Get Radiology Tree app to read full this article<
Get Radiology Tree app to read full this article<
Statistical Analysis
Get Radiology Tree app to read full this article<
Results
Resident Characteristics
Get Radiology Tree app to read full this article<
Table 1
Group Characteristics of First-Year Residents in the Two-Year Study
Year 1 (Baseline) Year 2 (Intervention) Difference 95% CI for Difference_P_ Value for Comparison Number of residents 11 11 — — — Number of female residents (%) 2 (18.18%) 2 (18.18%) 0% (−0.32, 0.32) 1.00 Age of residents in years, mean ± SD 27.9 ± 1.1 27.7 ± 2.2 0.2 years (−1.34, 1.71) .81 Number of examinations performed by each resident, mean ± SD (range) 70.7 ± 16.3 (46-93) 85.5 ± 22.7 (57-125) 14.8 examinations (−32.39, 2.75) .09
CI, confidence interval; SD, standard deviation.
95% CI for percentages are expressed in terms of frequencies.
Get Radiology Tree app to read full this article<
Fluoroscopy Time
Get Radiology Tree app to read full this article<
Table 2
Fluoroscopic Examination Types and Fluoroscopy Times During the 2-Year Study
Year 1 (Baseline) Year 2 (Intervention) Difference 95% CI for Difference_P_ Value for Comparison Age of patients in years, mean ± SD 56.9 ± 1.1 58.0 ± 2.2 1.1 year (−2.75, 0.38) .14 Number of female patients (%) 436 (56.1%) 534 (56.8%) 0.7% (−0.40, 0.05) .77 Number of fluoroscopy studies (% of studies that year) Esophagram 422 (54.2%) 596 (63.3%) 9.1% (0.04, 0.14) <.0001 Upper GI series 113 (14.5%) 122 (13.0%) 1.5% (−0.02, 0.05) .35 Feeding tube placement 141 (18.1%) 122 (13.0%) 5.1% (0.02, 0.08) .004 Small bowel follow-through 72 (9.3%) 76 (8.1%) 1.2% (0.02, 0.01) .38 Contrast enema 30 (3.9%) 25 (2.6%) 1.3% (−0.01, 0.02) .13 All studies 778 941 163 examinations Fluoroscopy time, mean ± SD in seconds Esophagram 207.7 ± 103.8 179.7 ± 94.2 28.0 seconds (15.74, 40.28) <.0001 Upper GI series 557.3 ± 545.9 463.9 ± 397.2 93.4 seconds (−28.63, 215.50) .13 Feeding tube placement 257.0 ± 173.5 274.9 ± 168.0 17.9 seconds (−59.54, 23.70) .40 Small bowel follow-through 502.2 ± 238.9 509.3 ± 247.5 7.1 seconds (−86.19, 71.99) .85 Contrast enema 470.3 ± 191.0 488.6 ± 220.2 18.3 seconds (−129.50, 92.89) .74 All studies 304.8 ± 283.3 263.7 ± 227.1 41.1 seconds (16.94, 65.23) <.001 Mean fluoroscopy time per resident per case in seconds ± SD (range) 306.2 ± 42.1 (188.5-331.9) 263.3 ± 45.8 (201.2-331.6) 42.9 seconds (3.75, 81.96) .03
CI, confidence interval; GI, gastrointestinal; SD, standard deviation.
95% CI for percentages are expressed in terms of frequencies.
Get Radiology Tree app to read full this article<
Get Radiology Tree app to read full this article<
Fluoroscopytime(sec)=641.80−20.08(interventionyear)−5.10(resident age)−6.60(femaleresident)−0.44(residentexperience)+0.19(patientage)+18.09(femalepatient)−281.11(esophagram)+36.15(tubeplacement)−211.35(upperGI)+29.85(SBFT) Fluoroscopy
time
(
sec
)
=
641
.80
−
20
.08
(
intervention
year
)
−
5
.10
(
resident age
)
−
6
.60
(
female
resident
)
−
0
.44
(
resident
experience
)
+
0
.19
(
patient
age
)
+
18
.09
(
female
patient
)
−
281
.11
(
esophagram
)
+
36
.15
(
tube
placement
)
−
211
.35
(
upper
GI
)
+
29
.85
(
SBFT
)
Get Radiology Tree app to read full this article<
Get Radiology Tree app to read full this article<
Table 3
Parameter Estimates for Multiple Linear Regression Analysis of all 1719 Fluoroscopic Studies
Variable Parameter Estimate Standard Error_P_ Value Intercept 641.80 102.62 <.0001 Examination year: intervention (0/1) −20.08 11.22 .07 Resident age, years −5.10 3.27 .11 Resident gender: female (0/1) −6.60 13.49 .63 Resident experience (number of studies performed) −0.44 0.27 .10 Patient age, years 0.19 0.33 .55 Patient gender: female (0/1) 18.09 10.70 .09 Esophagram (0/1) −281.11 30.21 <.0001 Feeding tube placement (0/1) 36.15 32.69 .27 Upper GI series (0/1) −211.35 32.42 <.0001 SBFT (0/1) 29.85 34.52 .39
CI, confidence interval; GI, gastrointestinal; SBFT, small bowel follow-through; SD, standard deviation.
Indicator variables are designated as (0/1).
Get Radiology Tree app to read full this article<
Get Radiology Tree app to read full this article<
Fluoroscopytime(sec)=333.30−18.86(interventionyear)−3.23(residentage)−21.54(femaleresident)−0.70(residentexperience)+0.19(patientage)+16.58(femalepatient) Fluoroscopy
time
(
sec
)
=
333
.30
−
18
.86
(
intervention
year
)
−
3
.23
(
resident
age
)
−
21
.54
(
female
resident
)
−
0
.70
(
resident
experience
)
+
0
.19
(
patient
age
)
+
16
.58
(
female
patient
)
Get Radiology Tree app to read full this article<
Get Radiology Tree app to read full this article<
Table 4
Parameter Estimates for Multiple Linear Regression, Subanalysis of 1018 esophagrams
Variable Parameter Estimate Standard Error_P_ Value Intercept 333.30 54.02 <.0001 Examination year: intervention (0/1) −18.86 6.53 .004 Resident age, years −3.23 1.81 .08 Resident gender: female (0/1) −21.54 7.65 .005 Resident experience (number of studies performed) −0.70 0.15 <.0001 Patient age, years 0.19 0.19 .29 Patient gender: female (0/1) 16.58 6.10 .007
Indicator variables are designated as (0/1).
Get Radiology Tree app to read full this article<
Checklist Implementation
Get Radiology Tree app to read full this article<
Knowledge and Perception Results
Get Radiology Tree app to read full this article<
Table 5
Percentage of Correct Resident Responses to Knowledge Assessment
Question Stems for Knowledge Assessment Year 1, % Correct Year 2, % Correct_P_ Value 1. Which of the following would be inappropriate fluoroscopic technique during placement of a feeding tube? 88.9 100 .332 2. What is the effect of lowering the fluoroscopy tower? 100 100 N/A 3. What is the effect of removing the grid during fluoroscopy? 77.8 88.9 .555 4. In the GI rooms, where is the x-ray tube located? 100 88.9 .332 5. Which of the following adjustments will decrease patient skin entrance dose? 88.9 88.9 1.0
GI, gastrointestinal.
Get Radiology Tree app to read full this article<
Get Radiology Tree app to read full this article<
Get Radiology Tree app to read full this article<
Discussion
Get Radiology Tree app to read full this article<
Get Radiology Tree app to read full this article<
Get Radiology Tree app to read full this article<
Get Radiology Tree app to read full this article<
Get Radiology Tree app to read full this article<
Get Radiology Tree app to read full this article<
Get Radiology Tree app to read full this article<
Get Radiology Tree app to read full this article<
Get Radiology Tree app to read full this article<
Get Radiology Tree app to read full this article<
Acknowledgments
Get Radiology Tree app to read full this article<
References
1. National Council on Radiation Protection and Measurements: Scientific Committee 6–2 on Radiation Exposure of the U.S. Population. Ionizing radiation exposure of the population of the United States : recommendations of the National Council on Radiation Protection and Measurements.2009.National Council on Radiation Protection and MeasurementsBethesda, Md
2. Mettler F.A., Bhargavan M., Faulkner K., et. al.: Radiologic and nuclear medicine studies in the United States and worldwide: frequency, radiation dose, and comparison with other radiation sources–1950-2007. Radiology 2009; 253: pp. 520-531.
3. Strauss K.J., Kaste S.C.: The ALARA (as low as reasonably achievable) concept in pediatric interventional and fluoroscopic imaging: striving to keep radiation doses as low as possible during fluoroscopy of pediatric patients–a white paper executive summary. Radiology 2006; 240: pp. 621-622.
4. Brink J.A., Amis E.S.: Image Wisely: a campaign to increase awareness about adult radiation protection. Radiology 2010; 257: pp. 601-602.
5. Sidhu M., Goske M.J., Connolly B., et. al.: Image Gently, Step Lightly: promoting radiation safety in pediatric interventional radiology. AJR Am J Roentgenol 2010; 195: pp. W299-W301.
6. Gawande A.: The checklist manifesto : how to get things right.1st ed.2010.Metropolitan BooksNew York
7. John S.D., Moore Q.T., Herrmann T., et. al.: The Image Gently pediatric digital radiography safety checklist: tools for improving pediatric radiography. J Am Coll Radiol 2013; 10: pp. 781-788.
8. Hernanz-Schulman M., Goske M.J., Bercha I.H., et. al.: Pause and pulse: ten steps that help manage radiation dose during pediatric fluoroscopy. AJR Am J Roentgenol 2011; 197: pp. 475-481.
9. Haynes A.B., Weiser T.G., Berry W.R., et. al.: Changes in safety attitude and relationship to decreased postoperative morbidity and mortality following implementation of a checklist-based surgical safety intervention. BMJ Qual Saf 2011; 20: pp. 102-107.
10. de Vries E.N., Hollmann M.W., Smorenburg S.M., et. al.: Development and validation of the SURgical PAtient Safety System (SURPASS) checklist. Qual Saf Health Care 2009; 18: pp. 121-126.
11. Baker DP, Gustafson S, Beaubien JM, et al. Medical Team Training Programs in Health Care Tools, and Products). 2005.
12. Sadigh G., Khan R., Kassin M.T., et. al.: Radiation Safety Knowledge and Perceptions among Residents: A Potential Improvement Opportunity for Graduate Medical Education in the United States. Acad Radiol 2014;
13. Kohn L.T., Corrigan J., Donaldson M.S.: To err is human : building a safer health system.2000.National Academy PressWashington, D.C.
14. Pronovost P., Needham D., Berenholtz S., et. al.: An intervention to decrease catheter-related bloodstream infections in the ICU. N Engl J Med 2006; 355: pp. 2725-2732.
15. Radiation risks of diagnostic imaging. Sentinel Event Alert 2011; pp. 1-4.
16. Koetser I.C., de Vries E.N., van Delden O.M., et. al.: A checklist to improve patient safety in interventional radiology. Cardiovasc Intervent Radiol 2013; 36: pp. 312-319.
17. Lee M.J., Fanelli F., Haage P., et. al.: Patient safety in interventional radiology: a CIRSE IR checklist. Cardiovasc Intervent Radiol 2012; 35: pp. 244-246.
18. Kokorowski P.J., Chow J.S., Strauss K.J., et. al.: Prospective systematic intervention to reduce patient exposure to radiation during pediatric ureteroscopy. J Urol 2013; 190: pp. 1474-1478.
19. Duncan J.R., Street M., Strother M., et. al.: Optimizing radiation use during fluoroscopic procedures: a quality and safety improvement project. J Am Coll Radiol 2013; 10: pp. 847-853.
20. Darling S., Sammer M., Chapman T., et. al.: Physician documentation of fluoroscopy time in voiding cystourethrography reports correlates with lower fluoroscopy times: a surrogate marker of patient radiation exposure. AJR Am J Roentgenol 2011; 196: pp. W777-W780.