
Rationale and Objectives
Global data–based and local instance–based machine-learning methods and classifiers have been widely used to optimize computer-aided detection and diagnosis (CAD) schemes to classify between true-positive and false-positive detections. In this study, the correlation between these two types of classifiers was investigated using a new independent testing data set, and the potential improvement of a CAD scheme’s performance by combining the results of the two classifiers in detecting breast masses was assessed.
Materials and Methods
The CAD scheme first used image filtering and a multilayer topographic region growth algorithm to detect and segment suspicious mass regions. The scheme then used an image feature–based classifier to classify these regions into true-positive and false-positive regions. Two classifiers were used in this study. One was a global data–based machine-learning classifier, an artificial neural network (ANN), and the other was a local instance–based machine-learning classifier, a k -nearest neighbor (KNN) algorithm. An independent image database including 400 mammographic examinations was used in this study. Of these, 200 were cancer cases and 200 were negative cases. The preoptimized CAD scheme was applied twice to the database using the two different classifiers. The correlation between the two sets of classification results was analyzed. Three sets of CAD performance results using the ANN, KNN, and average detection scores from both classifiers were assessed and compared using the free-response receiver-operating characteristic method.
Results
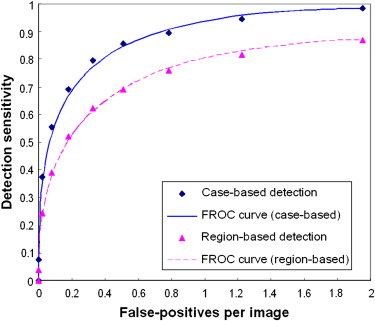
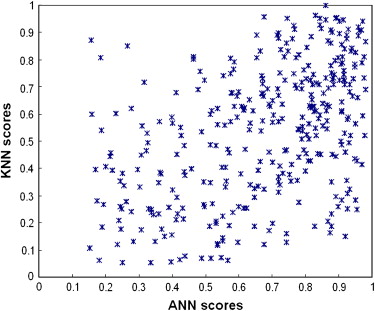
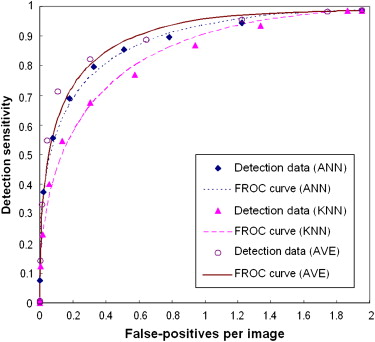
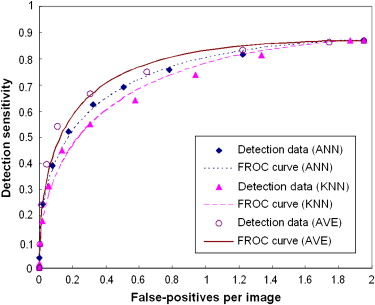
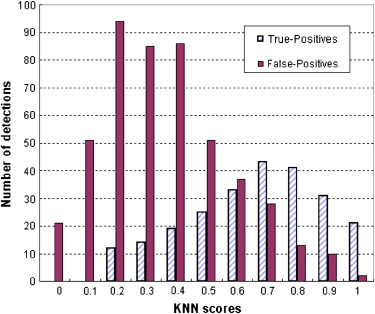
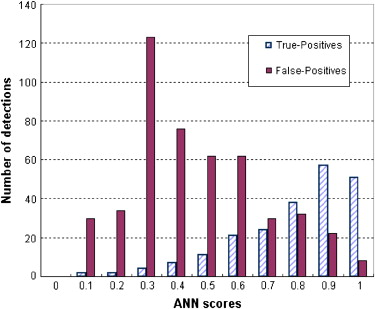
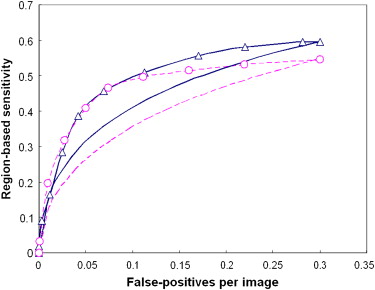
The results showed that the ANN achieved higher performance than the KNN algorithm, with a normalized area under the performance curve (AUC) of 0.891 versus 0.845. The correlation coefficients between the detection scores generated by the two classifiers were 0.436 and 0.161 for the true-positive and false-positive detections, respectively. The average detection scores of the two classifiers improved CAD performance and reliability by increasing the AUC to 0.912 and reducing the standard error of the estimated AUC by 14.4%. The detection sensitivity was also increased from 75.8% (ANN) and 65.9% (KNN) to 80.3% at a false-positive detection rate of 0.3 per image.
Conclusions
This study demonstrates that two global data–based and local data–based machine-learning classifiers (ANN and KNN) generated low correlated detection results and that combining the detection scores of these two classifiers significantly improved overall CAD performance ( P < .01) and reduced standard error in CAD performance assessment.
Computer-aided detection and diagnosis (CAD) has emerged as a rapidly developing and promising technology in assisting radiologists with reading and interpreting screening mammograms , as well as other medical images. Most CAD schemes for mammography typically involve three stages in an attempt to automatically detect suspicious beast lesions and classify their likelihood of being malignant. The first stage uses image filtering and threshold methods to detect initially suspicious pixels or areas. The second stage applies a region growth or segmentation algorithm to define the lesion areas and the boundary contours. From the segmented lesion area, a set of image features is then extracted and computed. The third stage uses a pretrained machine-learning classifier to classify between true-positive and false-positive detections. A large number of supervised machine-learning methods have been investigated and tested for this purpose, which include, but are not limited to, linear discriminant analysis , decision trees , artificial neural networks (ANNs) , Bayesian belief networks , support vector machines , rule-based expert systems , information-theoretic-based template matching , and k -nearest neighbor (KNN) algorithms . Although these classifiers use different machine-learning concepts and methods, they basically can be divided into two categories, namely, global data–based and local instance (data)–based machine-learning methods .
The object of a global data–based machine-learning method is to train a classifier that generates a “global” optimization function to cover the entire instance space. For example, an ANN is a typical classifier trained using the global data–based machine-learning method. The advantage of an ANN is that it provides a robust approach to approximate general and explicit target functions with potentially noisy or incomplete training data. A local data–based machine-learning method is an instance-based “lazy” learning method. Instead of estimating the global target function once for the entire instance space, a local-based machine-learning method estimates the target function locally and differently for each new queried instance to be classified. The KNN algorithm is one of the most widely used classifiers when using a local data–based machine-learning method. Similar to an adaptive approach, an important advantage of the KNN algorithm is that it provides an option of selecting a different hypothesis or local approximation to the target function for each unknown (or test) query.
Get Radiology Tree app to read full this article<
Get Radiology Tree app to read full this article<
Get Radiology Tree app to read full this article<
Materials and methods
CAD Scheme with Two Machine-Learning Classifiers
Get Radiology Tree app to read full this article<
Get Radiology Tree app to read full this article<
d(yT,xi)=∑14r=1[fr(yT)−fr(xi)]2−−−−−−−−−−−−−−−−−−−√. d
(
y
T
,
x
i
)
=
∑
r
=
1
14
[
f
r
(
y
T
)
−
f
r
(
x
i
)
]
2
.
The detailed definition and computing methods of these 14 selected features have previously been reported . A smaller distance indicates a higher degree of “similarity” between two compared regions. The KNN classifier then computes a detection score,
PTP=∑Ni=1wTPi∑Ni=1wTPi+∑Mj=1wFPj, P
TP
=
∑
i
=
1
N
w
i
TP
∑
i
=
1
N
w
i
TP
+
∑
j
=
1
M
w
j
FP
,
where wi=1d(yT,xi)2 w
i
=
1
d
(
y
T
,
x
i
)
2 (a distance weight); wTPi w
i
TP and wFPj w
j
FP are the distance weights for the true-positive ( i ) and false-positive ( j ) mass regions, respectively; N is the number of verified true-positive mass regions; M is the number of CAD-cued false-positive regions; and N + M = 15. Our current reference library includes 3553 regions of interest. Of these, 1792 depict malignant masses and 1761 depict CAD-cued false-positive mass regions .
Get Radiology Tree app to read full this article<
Testing Image Data Set
Get Radiology Tree app to read full this article<
Assessment of the Performance of Two Classifiers
Get Radiology Tree app to read full this article<
Get Radiology Tree app to read full this article<
Get Radiology Tree app to read full this article<
Get Radiology Tree app to read full this article<
Results
Get Radiology Tree app to read full this article<
Get Radiology Tree app to read full this article<
Get Radiology Tree app to read full this article<
Get Radiology Tree app to read full this article<
Get Radiology Tree app to read full this article<
Get Radiology Tree app to read full this article<
Get Radiology Tree app to read full this article<
Table 1
Comparison of Both Case-based and Region-based Detection Performance Levels (AUC Values) Using the Average, Maximum, and Minimum Scores of ANN and KNN Classifiers
Average Maximum Minimum Case-based 0.9115 ± 0.0107 0.8946 ± 0.0099 ( P = .374) 0.8713 ± 0.0118 ( P < .001) Region-based 0.8868 ± 0.0074 0.8671 ± 0.0091 ( P = .365) 0.8502 ± 0.0095 ( P = .006)
ANN, artificial neural network; AUC, area under the free-response receiver-operating characteristic curve; KNN, k -nearest neighbor.
The P values were computed between the average and the maximum or minimum detection scores.
Table 2
Comparison of Case-based Detection Performance Levels (AUC Values) Using the Average of ANN and KNN Detection Scores in Which the ANN Scores Are Weighted by Multiplying a Set of Ratios From 0.5 to 2.0
Weight 0.5 0.75 1.0 1.25 1.5 1.75 2.0 AUC 0.8967 0.9080 0.9115 0.9136 0.9125 0.9111 0.8946 Standard deviation 0.0107 0.0101 0.0107 0.0102 0.0105 0.0109 0.0101
ANN, artificial neural network; AUC, area under the free-response receiver-operating characteristic curve; KNN, k -nearest neighbor.
Get Radiology Tree app to read full this article<
Discussion
Get Radiology Tree app to read full this article<
Get Radiology Tree app to read full this article<
Get Radiology Tree app to read full this article<
Get Radiology Tree app to read full this article<
Get Radiology Tree app to read full this article<
References
1. Khoo L.A., Taylor P., Given-Wilson R.M.: Computer-aided detection in the United Kingdom National Breast Screening Programme: prospective study. Radiology 2005; 237: pp. 444-449.
2. Ko J.M., Nicholas M.J., Mendel J.B., Slanetz P.J.: Prospective assessment of computer-aided detection in interpretation of screening mammograms. AJR Am J Roentgenol 2006; 187: pp. 1483-1491.
3. Nishikawa R.M.: Current status and future directions of computer-aided diagnosis in mammography. Comput Med Imaging Graph 2007; 31: pp. 224-235.
4. Shi J., Sahiner B., Chan H.P., et. al.: Characterization of mammographic masses based on level set segmentation with new image features and patient information. Med Phys 2007; 34: pp. 280-290.
5. Rymon R., Zheng B., Chang Y.H., Gur D.: Incorporation of a set enumeration trees-based classifier into a hybrid computer-assisted diagnosis scheme for mass detection. Acad Radiol 1998; 5: pp. 181-187.
6. te Brake G., Karssemeijer N.: Segmentation of suspicious densities in digital mammograms. Med Phys 2001; 28: pp. 259-266.
7. Wang X.H., Zheng B., Good W.F., King J.L., Chang Y.H.: Computer-assisted diagnosis of breast cancer using a data-driven Bayesian belief network. Int J Med Informatics 1999; 54: pp. 115-126.
8. Wei L., Yang Y., Nishikawa R.M., Jiang Y.: A study on several machine learning methods for classification of malignant and benign clustered microcalcifications. IEEE Trans Med Imaging 2005; 24: pp. 371-380.
9. Li L., Zhang Y., Zheng L., Clark R.A.: False-positive reduction in CAD mass detection using a competitive classification strategy. Med Phys 2001; 28: pp. 250-258.
10. Tourassi G.D., Harrawood B., Singh S., Lo J.Y., Floyd C.E.: Evaluation of information-theoretic similarity measures for content-based retrieval and detection of masses in mammograms. Med Phys 2007; 34: pp. 140-150.
11. Zheng B., Mello-Thoms C., Wang X.H., et. al.: Interactive computer aided diagnosis of breast masses: computerized selection of visually similar image sets from a reference library. Acad Radiol 2007; 14: pp. 917-927.
12. Mitchell T.M.: Machine learning.1997.WCB/McGraw-HillBoston
13. Jesneck J.L., Noite L.W., Floyd C.E., Lo J.Y.: Optimized approach to decision fusion of heterogeneous data for breast cancer diagnosis. Med Phys 2006; 33: pp. 2945-2954.
14. Elter M., Schulz-Wendtland R., Wittenberg T.: The predication of breast cancer biopsy outcomes using two CAD approaches that emphasize an intelligible decision process. Med Phys 2007; 34: pp. 4164-4172.
15. Habas P.A., Zurada J.M., Elmaghraby A.S., Tourassi G.D.: Reliability analysis framework for computer-assisted medical decision systems. Med Phys 2007; 34: pp. 763-772.
16. Gur D., Stalder J., Hardesty L.A., et. al.: CAD performance on sequentially ascertained mammographic examinations of masses: an assessment. Radiology 2004; 233: pp. 418-423.
17. Zheng B., Lu A., Hardesty L.A., et. al.: A method to improve visual similarity of breast masses for an interactive computer-aided diagnosis environment. Med Phys 2006; 33: pp. 111-117.
18. Zheng B., Chang Y.H., Gur D.: Computerized detection of masses in digitized mammograms using single image segmentation and a multi-layer topographic feature analysis. Acad Radiol 1996; 2: pp. 959-966.
19. Zheng B., Sumkin J.H., Good W.F., et. al.: Applying computer-assisted detection schemes to digitized mammograms after JPEG data compression. Acad Radiol 2000; 7: pp. 595-602.
20. Eltonsy N.H., Tourassi G.D., Elmaghraby A.S.: A concentric morphology model for the detection of masses in mammography. IEEE Trans Med Imaging 2007; 26: pp. 880-889.
21. Park S.C., Sukthankar R., Mummert L., et. al.: Optimization of reference library used in content-based medical image retrieval scheme. Med Phys 2007; 34: pp. 4331-4339.
22. Zheng B., Leader J.K., Abrams G., et. al.: Computer-aided detection schemes: the effect of limiting the number of cued regions in each case. AJR Am J Roentgenol 2004; 182: pp. 579-582.
23. Zheng B., Shah R., Wallace L., et. al.: Computer-aided detection in mammography: an assessment of performance on current and prior images. Acad Radiol 2002; 9: pp. 1245-1250.
24. Metz CE. ROCFIT 0.9B Beta version. Available at: http://www.radiology.uchicago.edu/krl/ .
25. Bellotti R., De Carlo F., Tangaro S., et. al.: A completely automated CAD system for mass detection in a large mammographic database. Med Phys 2006; 33: pp. 3066-3077.
26. Yoon H.J., Zheng B., Sahiner B., Chakraborty D.P.: Evaluating computer-aided detection algorithms. Med Phys 2007; 34: pp. 2024-2038.
27. Swensson R.G., King J.L., Good W.F., Gur D.: Observer variation and the performance accuracy gained by averaging ratings of abnormality. Med Phys 2000; 27: pp. 1920-1933.
28. Liu B., Metz C.E., Jiang Y.: Effect of correlation on combining diagnostic information from two images of the same patient. Med Phys 2005; 32: pp. 3329-3338.
29. Nishikawa R.M., Kallergi K.: Computer-aided detection in its present form is not an effective aid for screening mammography. Med Phys 2006; 33: pp. 811-814.
30. Fenton J.J., Taplin S.H., Carney P.A., et. al.: Influence of computer-aided detection on performance of screening mammography. N Engl J Med 2007; 356: pp. 1399-1409.