
Rationale and Objectives
To identify and reduce reasons for delays in procedure start times, particularly the first cases of the day, within the interventional radiology (IR) divisions of the Department of Radiology using principles of continuous quality improvement.
Materials and Methods
An interdisciplinary team representative of the IR and preprocedure/postprocedure care area (PPCA) health care personnel, managers, and data analysts was formed. A standardized form was used to document both inpatient and outpatient progress through the PPCA and IR workflow in six rooms and to document reasons for delays. Data generated were used to identify key problems areas, implement improvement interventions, and monitor their effects. Project duration was 6 months.
Results
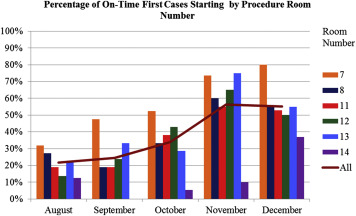
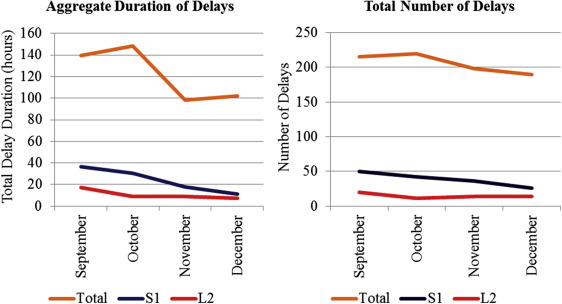
The average number of on-time starts for the first case of the day increased from 23% to 56% ( P value < .01). The average number of on-time, scheduled outpatients increased from 30% to 45% ( P value < .01). Patient wait time to arrive at treatment room once they were ready for their procedure was reduced on average by 10 minutes ( P value < .01). Patient care delay duration per 100 patients was reduced from 30.3 to 21.6 hours (29% reduction). Number of patient care delays per 100 patients was reduced from 46.6 to 40.1 (17% reduction). Top reasons for delay included waiting for consent (26% of delays duration) and laboratory tests (12%).
Conclusions
Many complex factors contribute to procedure start time delays within an IR practice. A data-driven and patient-centered, interdisciplinary team approach was effective in reducing delays in IR.
The focus on quality in radiology is expanding rapidly and includes quality control of equipment, quality assurance (QA) of our imaging and processes, and increasingly, continuous quality improvement (CQI or, in short, QI) . To perform QI, every step in a workflow process is mapped, measured, and analyzed with the goal of improving a process and reducing systems errors . Methods and principles of systems engineering have been widely recommended as a means to improve health care delivery, from staff planning and resource capacity allocation, to improving patient flow and reducing wait times and delays . Medical literature on the improvement of on-time starts and delay reduction is widely available but mostly limited to the hospital’s surgical department setting .
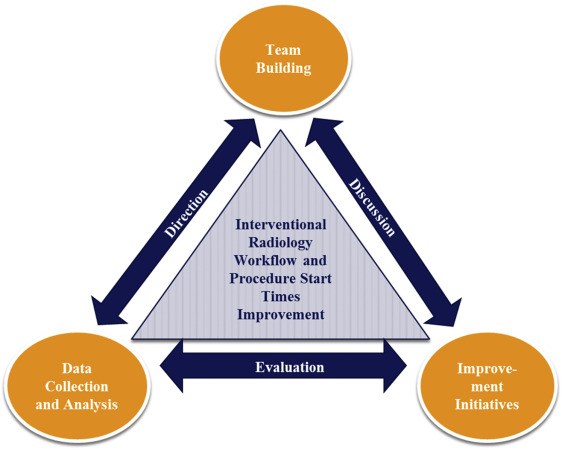
The Radiology Department implemented a quality strategic plan with the following goals: 1) to foster a culture of quality, 2) to enhance patient satisfaction, 3) to promote standardization of workflow processes, and 4) to improve clinical quality and safety outcomes. Multiple projects were initiated to achieve these four goals. For instance, each of the 11 divisions within the department assigned a radiologist as quality officer to led efforts to monitor QA metrics and to develop practice quality improvement projects appropriate for their division. Next, we describe the creation and work of a QI project team in the interventional radiology (IR) and neurointerventional (NIR) divisions (together called “IR”) that resulted from this strategic plan with the following objectives: 1) to improve on-time procedure start times and 2) to reduce delays in patient care (and thereby improve patient satisfaction). The purpose of this article was to describe the process of building the QI team, collecting and analyzing the data, selecting QI interventions, and evaluating for improvement changes.
Materials and methods
Get Radiology Tree app to read full this article<
Get Radiology Tree app to read full this article<
Initial Project Team and Team Building
Get Radiology Tree app to read full this article<
Get Radiology Tree app to read full this article<
Data Collection and Analysis
Get Radiology Tree app to read full this article<
Get Radiology Tree app to read full this article<
Get Radiology Tree app to read full this article<
Get Radiology Tree app to read full this article<
Get Radiology Tree app to read full this article<
Workflow Process Times Report
Get Radiology Tree app to read full this article<
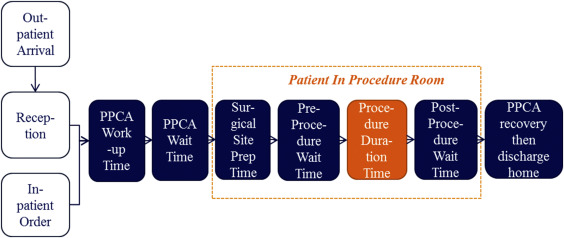
Table 1
Definitions of the Workflow Process Blocks
Process Block Definition Reception wait time Front desk check-in to PPCA arrival PPCA work-up time PPCA arrival to PPCA work-up complete PPCA wait time PPCA work-up complete to procedure room arrival Surgical site preparation time Treatment room arrival to completed prep of surgical site Preprocedure wait time Completed prep of surgical site to procedure start Procedure duration time Procedure start (puncture time) to procedure complete Postprocedure wait time Procedure complete to treatment room departure
PPCA, preprocedure/postprocedure care area.
Get Radiology Tree app to read full this article<
Room Utilization Report
Get Radiology Tree app to read full this article<
Delay Types and Duration Report
Get Radiology Tree app to read full this article<
Get Radiology Tree app to read full this article<
Improvement Initiatives and Interventions
Get Radiology Tree app to read full this article<
Table 2
Top 10 Delays in Patient Care by Aggregate Duration at Start of Project
Delay Reasons Time (%) Count (%) Physician needed for consent, presedation, or order clarification 26.2 23.3 Miscellaneous (eg, IR room not available) 19.0 18.6 Laboratory testing and results delay 12.4 9.3 Anesthesia delay in room, with patient 7.4 7.9 IR room nurse not available 6.6 5.6 PPCA nurse assessment incomplete 6.5 8.4 Physician not available for call to order or start 6.4 7.4 Laboratory values abnormal 3.8 0.9 Patient request to use restroom, see family, and so forth 2.0 6.0 Anesthesia delay in preoperative assessment 1.5 1.9
IR, interventional radiology; PPCA, preprocedure/postprocedure care area.
The percent count represents the frequency of these delays.
Table 3
Improvement Interventions Implemented by the Project Team
Improvement Intervention Target Impact Area Date Implemented Checklist for PPCA to treatment room handoff Procedure start time (decrease PPCA work-up time and miscommunication) October 1st Transport from PPCA to treatment room not limited to IR treatment nurse Procedure start time (decrease PPCA “ready time”) October 14th Blood drawn in PPCA instead of sending patient to hospital laboratory Delays due to laboratory testing October 14th All IR fellows perform consents rather than one “consult” fellow of the day Delays due to consent process November 1st Internet access to outside laboratory results by PPCA nurses Delays due to laboratory testing/retesting November 20th
IR, interventional radiology; PPCA, preprocedure/postprocedure care area.
Get Radiology Tree app to read full this article<
Preimprovement and Postimprovement Interventions Statistical Analysis
Get Radiology Tree app to read full this article<
Results
Get Radiology Tree app to read full this article<
Get Radiology Tree app to read full this article<
On-Time Room Starts
Get Radiology Tree app to read full this article<
Get Radiology Tree app to read full this article<
Room Turnover and Turnaround
Get Radiology Tree app to read full this article<
Patient Workflow Wait Times
Get Radiology Tree app to read full this article<
Table 4
Interventional Radiology Workflow Process Blocks’ Patient Time Duration Before and After Project Improvement Interventions Were Implemented (Preinterventions/Postinterventions)
Statistic Before/After Wait at Reception At PPCA Wait for Room Prepped Ready for Puncture Procedure Leave Room All cases N 357/336 743/708 743/706 934/926 925/923 927/926 931/925 Median 27/17.5 45/42 23/15 20/19.5 10/8 42/37 10/10 Mean 38.2/27.1 51.8/48.6 40.1/30.6 23.4/21.8 11.8/10.3 53.9/50.7 12.7/12.5 SD 40.7/37.2 34.4/29.6 44.0/39.3 13.5/15.7 11.6/8.41 41.6/43.7 9.6/9.5P value<.01.06<.01.02<.01 .10 .61 First case of the day N 100/77 190/180 189/180 248/233 243/231 246/233 246/233 Median 12/13 50/41.5 18/10 20/19 10/9 41.5/35 10/10 Average 17.6/20.9 54.6/46.5 26.2/16.6 26.1/22.6 11.6/11.2 55.6/55.1 12.6/12.8 SD 18.6/51.1 28.9/23.2 28.5/15.7 17.2/13.7 8.17/9.10 44.3/53.6 7.8/10.7P value .56<.01<.01.02 .64 .91.05
PPCA, preprocedure/postprocedure care area; SD, standard deviation.
N is the number of cases. The median, mean, and SD are given in minutes. Both the mean and median were reported to demonstrate the data skew. Note that many of the mean times were significantly reduced as shown by the P values in the Table. The P values in bold indicate significance of at least 6%.
The “wait at reception” time is given for outpatients who did not require anesthesia; therefore, there were fewer cases in this time block. Similarly, “at PPCA” and “wait for room” times are given for patients (inpatients or outpatients) who did not require anesthesia. The P values were calculated using the t -test of the means before and after improvement interventions.
Get Radiology Tree app to read full this article<
Delay Types and Duration
Get Radiology Tree app to read full this article<
Get Radiology Tree app to read full this article<
Get Radiology Tree app to read full this article<
Get Radiology Tree app to read full this article<
On-time OP Procedures and Average IP Order Cycle
Get Radiology Tree app to read full this article<
Discussion
Get Radiology Tree app to read full this article<
Get Radiology Tree app to read full this article<
Get Radiology Tree app to read full this article<
Get Radiology Tree app to read full this article<
Get Radiology Tree app to read full this article<
Get Radiology Tree app to read full this article<
Study Limitations
Get Radiology Tree app to read full this article<
Conclusions and Next Steps
Get Radiology Tree app to read full this article<
References
1. American College of Radiology: Practice Guidelines and Technical Standards.2008.American College of RadiologyVA, USA http://www.acr.org/Quality-Safety/Standards-Guidelines
2. Applegate K.E.: Continuous quality improvement for radiologists. Acad Radiol 2004; 11: pp. 155-161.
3. Johnson C.D., Swensen S.J., Applegate K.E., et. al.: Quality improvement in radiology: white paper report of the Sun Valley Group meeting. J Am Coll Radiol 2006; 3: pp. 544-549.
4. Lau L.S.: A continuum of quality in radiology. J Am Coll Radiol 2006; 3: pp. 233-239.
5. Moeslein F., Nagy P.: Performance quality improvement projects: suggestions for interventional radiologists. J Am Coll Radiol 2011; 8: pp. 585-587.
6. Steele J.R., Sidhu M.K., Swensen S.J., et. al.: Quality improvement in interventional radiology: an opportunity to demonstrate value and improve patient-centered care. J Vasc Interv Radiol 2012; 23: pp. 435-441. quiz 442
7. Steele J.R., Wallace M.J., Hovsepian D.M., et. al.: Guidelines for establishing a quality improvement program in interventional radiology. J Vasc Interv Radiol 2010; 21: pp. 617-625.
8. van den Heuvel J., Hendriks M.J., van Waes P.F.: An ISO-quality system in the radiology department: a benefit analysis. Acad Radiol 1998; 5: pp. S441-S445.
9. Caldwell B.S., Garrett S.K., Boustany K.C.: Healthcare team performance in time critical environments: coordinating events, foraging, and system processes. Journal of Healthcare Engineering 2010; 1: pp. 255-276.
10. Criswell M., Doebbeling B.N.: Applying systems engineering principles in improving health care delivery. J Gen Intern Med 2007; 22: pp. 431-437.
11. Kamath J.R., Osborn J.B., Roger V.L., et. al.: Highlights from the third annual Mayo Clinic conference on systems engineering and operations research in health care. Mayo Clinic Proceedings 2011; 86: pp. 781-786.
12. Kolker A.: Healthcare management engineering: its scope, fundamental principles and potential and what it means for operations research professionals: its scope, fundamental principles and potential and what it means for operations research professionals.2012.Analytics Magazinepp. 28-32.
13. Pickering B.W., Litell J.M., Herasevich V., et. al.: Clinical review: the hospital of the future-building intelligent environments to facilitate safe and effective acute care delivery. Critical Care 2012; 16: pp. 220.
14. Reid P.P.Compton W.D.Grossman J.H. et. al.Building a better delivery system: a new engineering/health care partnership.2005.National Academies PressWashington, D.C:
15. Ernst C., Szczesny A., Soderstrom N., et. al.: Success of commonly used operating room management tools in reducing tardiness of first case of the day starts: evidence from German hospitals. Anesth Analg 2012; 115: pp. 671-677.
16. Mazzei W.J.: Operating room start times and turnover times in a university hospital. J Clin Anesth 1994; 6: pp. 405-408.
17. Overdyk F.J., Harvey S.C., Fishman R.L., et. al.: Successful strategies for improving operating room efficiency at academic institutions. Anesth Analg 1998; 86: pp. 896-906.
18. Wachtel R.E., Dexter F.: Influence of the operating room schedule on tardiness from scheduled start times. Anesth Analg 2009; 108: pp. 1889-1901.
19. Wachtel R.E., Dexter F.: Reducing tardiness from scheduled start times by making adjustments to the operating room schedule. Anesth Analg 2009; 108: pp. 1902-1909.
20. Wright J.G., Roche A., Khoury A.E.: Improving on-time surgical starts in an operating room. Can J Surg 2010; 53: pp. 167-170.