
Objectives
Multi-atlas fusion is a promising approach for computer-assisted segmentation of anatomic structures. The purpose of this study was to evaluate the accuracy and time efficiency of multi-atlas segmentation for estimating spleen volumes on clinically acquired computed tomography (CT) scans.
Materials and Methods
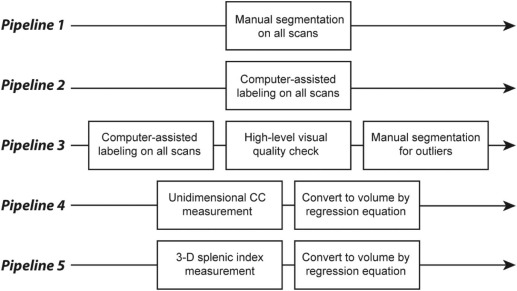
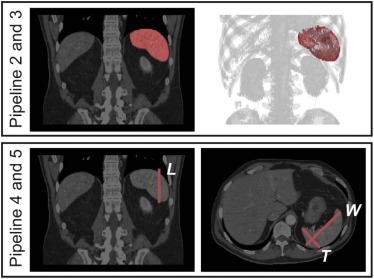
Under an institutional review board approval, we obtained 294 de-identified (Health Insurance Portability and Accountability Act-compliant) abdominal CT scans on 78 subjects from a recent clinical trial. We compared five pipelines for obtaining splenic volumes: Pipeline 1 – manual segmentation of all scans, Pipeline 2 – automated segmentation of all scans, Pipeline 3 – automated segmentation of all scans with manual segmentation for outliers on a rudimentary visual quality check, and Pipelines 4 and 5 – volumes derived from a unidimensional measurement of craniocaudal spleen length and three-dimensional splenic index measurements, respectively. Using Pipeline 1 results as ground truth, the accuracies of Pipelines 2–5 (Dice similarity coefficient, Pearson correlation, R-squared, and percent and absolute deviation of volume from ground truth) were compared for point estimates of splenic volume and for change in splenic volume over time. Time cost was also compared for Pipelines 1–5.
Results
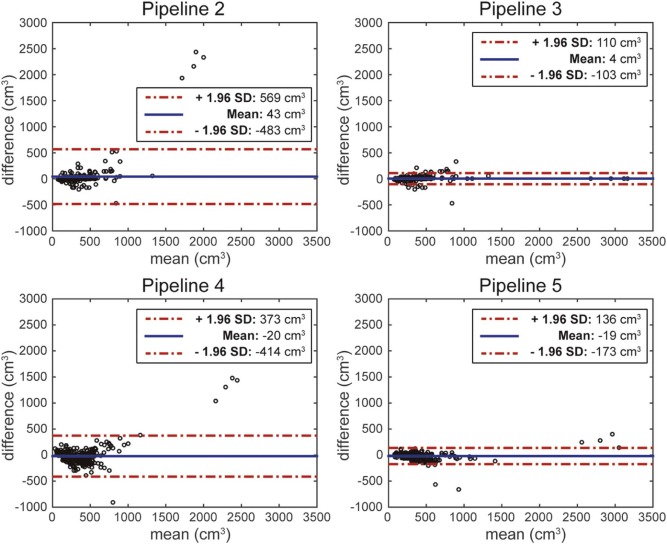
Pipeline 3 was dominant in terms of both accuracy and time cost. With a Pearson correlation coefficient of 0.99, average absolute volume deviation of 23.7 cm 3 , and time cost of 1 minute per scan, Pipeline 3 yielded the best results. The second-best approach was Pipeline 5, with a Pearson correlation coefficient of 0.98, absolute deviation of 46.92 cm 3 , and time cost of 1 minute 30 seconds per scan. Manual segmentation (Pipeline 1) required 11 minutes per scan.
Conclusion
A computer-automated segmentation approach with manual correction of outliers generated accurate splenic volumes with reasonable time efficiency.
Introduction
The clinical promise of computer-assisted content labeling lies in its potential to promote the extraction of quantitative morphometric information from imaging scans while minimizing time and resource requirements. The demand for such quantitative information is closely linked with the ascendency of evidence-based medicine, which depends heavily on the statistical correlation of quantitative results from different clinical datasets . In time, if computer-assisted image segmentation can enable extraction of morphometric information with sufficient accuracy and time efficiency, we may advance to the point of performing high-throughput “big data” analyses of large imaging databases. This can lead to the discovery of clinically relevant associations between imaging-based phenotypic markers and other clinical endpoints. This approach is currently applied to high-throughput genome-wide analyses in search of novel clinically relevant genetic biomarkers .
Among a wide range of potentially extractable morphometric biomarkers from imaging scans, lesion and organ size stand out as important targets due to the historical use of lesion and organ size information as markers of disease presence, severity, and response to treatment . Splenic volume is an intriguing biomarker to test computer-assisted segmentation techniques on because of its intersection with a wide array of disease states and the special methodological challenges associated with segmenting this particular organ. Quantitative estimates of spleen size have been of clinical interest for decades , but computer-assisted labeling of the spleen has been difficult because of a wide variation between subjects regarding splenic size, shape, and geometric orientation within the abdomen .
Get Radiology Tree app to read full this article<
Get Radiology Tree app to read full this article<
Get Radiology Tree app to read full this article<
Materials and Methods
Data Acquisition
Get Radiology Tree app to read full this article<
TABLE 1
Clinical Parameters for the Tested 78 Subjects
Parameter Range_N_ (%) Age <40 4(5) 40–49 14(18) 50–59 23(29) 60–69 23(29) 70–79 10(13) 80+ 4(5) Total 78(100) Gender Male 45(58) Female 33(42) Total 78(100) Body mass index <20 3(4) 20–24.9 24(31) 25–29.9 20(26) 30–34.9 19(24) 35+ 11(14) Not available 1(1) Total 78(100)
Get Radiology Tree app to read full this article<
Manual Segmentation (Pipeline 1)
Get Radiology Tree app to read full this article<
Get Radiology Tree app to read full this article<
Computer-assisted Segmentation (Pipeline 2)
Get Radiology Tree app to read full this article<
Get Radiology Tree app to read full this article<
Computer-assisted Segmentation with Manual Labeling for Outliers (Pipeline 3)
Get Radiology Tree app to read full this article<

Get Radiology Tree app to read full this article<
Get Radiology Tree app to read full this article<
Unidimensional and Splenic Index Measurements (Pipelines 4 and 5)
Get Radiology Tree app to read full this article<
Statistical Analysis
Get Radiology Tree app to read full this article<
Get Radiology Tree app to read full this article<
Get Radiology Tree app to read full this article<
IRB Approval
Get Radiology Tree app to read full this article<
Results
Inter-rater Reliability of Manual Segmentation
Get Radiology Tree app to read full this article<
TABLE 2
Accuracy and Time Results for Each Pipeline
Result Manual Segmentation (Pipeline 1) a Computer Segmentation for All Scans (Pipeline 2) Computer Segmentation with Manual Segmentation of Outliers (Pipeline 3) 1D Length (Pipeline 4) 3D Splenic Index (Pipeline 5) Accuracy (point estimates) Dice similarity coefficient 0.96 ± 0.01 0.90 ± 0.11 0.93 ± 0.07 \\ N/A N/A Pearson correlation 0.9997 0.7151 0.9888 0.8613 0.9765 R-squared 0.9993 0.5114 0.9778 0.7435 0.9535 Absolute deviation of volume from ground truth (cm 3 ) 7.25 ± 7.29 64.66 ± 263.93 23.70 ± 48.98 \\ 111.02 ± 168.48 46.92 ± 66.37 Accuracy (change from baseline) Pearson coefficient N/A 0.5556 0.8741 0.4839 0.8178 R-squared N/A 0.3087 0.7641 0.2717 0.7437 Absolute deviation of volume change from ground truth (cm 3 ) N/A 46.70 ± 84.86 28.24 ± 49.55 \\ 81.62 ± 107.82 38.11 ± 68.01 Accuracy (change from most recent prior) Pearson coefficient N/A 0.6532 0.8094 0.4825 0.7694 R-squared N/A 0.4267 0.6551 0.2590 0.6597 Absolute deviation of volume change from ground truth (cm 3 ) N/A 38.04 ± 67.07 26.33 ± 52.12 \\ 64.28 ± 81.64 33.95 ± 59.34 Time cost Manual interaction time (averaged per scan) 11 min 5 s 1 min \* 1 min 5 s 1 min 30 s
Get Radiology Tree app to read full this article<
Get Radiology Tree app to read full this article<
Get Radiology Tree app to read full this article<
Get Radiology Tree app to read full this article<
Point Estimates of Splenic Volume
Get Radiology Tree app to read full this article<
Get Radiology Tree app to read full this article<
Estimates of Change in Splenic Volume
Get Radiology Tree app to read full this article<
Time Costs
Get Radiology Tree app to read full this article<
Discussion
Main Contributions
Get Radiology Tree app to read full this article<
Get Radiology Tree app to read full this article<
Potential Improvement
Get Radiology Tree app to read full this article<
Get Radiology Tree app to read full this article<
Implication for Patient Care
Get Radiology Tree app to read full this article<
Summary
Get Radiology Tree app to read full this article<
Acknowledgments
Get Radiology Tree app to read full this article<
References
1. Sullivan D.C.: Imaging as a quantitative science. Radiology 2008; 248: pp. 328-332.
2. Parkinson H., Sarkans U., Kolesnikov N., et. al.: ArrayExpress update–an archive of microarray and high-throughput sequencing-based functional genomics experiments. Nucleic Acids Res 2011; 39: pp. D1002-D1004.
3. Barrett T., Troup D.B., Wilhite S.E., et. al.: NCBI GEO: archive for high-throughput functional genomic data. Nucleic Acids Res 2009; 37: pp. D885-D890.
4. Bourgon R., Lu S., Yan Y., et. al.: High-throughput detection of clinically relevant mutations in archived tumor samples by multiplexed PCR and next-generation sequencing. Clin Cancer Res 2014; 20: pp. 2080-2091.
5. Roychowdhury S., Iyer M.K., Robinson D.R., et. al.: Personalized oncology through integrative high-throughput sequencing: a pilot study. Sci Transl Med 2011; 3: pp. 111ra121.
6. Wolf A.D., Lavine J.E.: Hepatomegaly in neonates and children. Pediatr Rev 2000; 21: pp. 303-310.
7. O’Reilly R.A.: Splenomegaly in 2,505 patients at a large university medical center from 1913 to 1995. 1963 to 1995: 449 patients. West J Med 1998; 169: pp. 88-97.
8. Felker G.M., Thompson R.E., Hare J.M., et. al.: Underlying causes and long-term survival in patients with initially unexplained cardiomyopathy. N Engl J Med 2000; 342: pp. 1077-1084.
9. Eisenhauer E.A., Therasse P., Bogaerts J., et. al.: New response evaluation criteria in solid tumours: revised RECIST guideline (version 1.1). Eur J Cancer 2009; 45: pp. 228-247.
10. Dittrich M., Milde S., Dinkel E., et. al.: Sonographic biometry of liver and spleen size in childhood. Pediatr Radiol 1983; 13: pp. 206-211.
11. Linguraru M.G., Sandberg J.K., Li Z., et. al.: Automated segmentation and quantification of liver and spleen from CT images using normalized probabilistic atlases and enhancement estimation. Med Phys 2010; 37: pp. 771-783.
12. Xu Z., Asman A.J., Shanahan P.L., et. al.: SIMPLE is a good idea (and better with context learning).Golland PHata NBarillot C et. al.Medical image computing and computer-assisted intervention–MICCAI 2014.2014.Springer International PublishingSwitzerland:pp. 364-371.
13. Wolz R., Aljabar P., Hajnal J.V., et. al.: LEAP: learning embeddings for atlas propagation. Neuroimage 2010; 49: pp. 1316-1325.
14. Bezerra A.S., D’Ippolito G., Faintuch S., et. al.: Determination of splenomegaly by CT: is there a place for a single measurement?. AJR Am J Roentgenol 2005; 184: pp. 1510-1513.
15. Overman M.J., Maru D.M., Charnsangavej C., et. al.: Oxaliplatin-mediated increase in spleen size as a biomarker for the development of hepatic sinusoidal injury. J Clin Oncol 2010; 28: pp. 2549-2555.
16. Tefferi A., Cervantes F., Mesa R., et. al.: Revised response criteria for myelofibrosis: International Working Group-Myeloproliferative Neoplasms Research and Treatment (IWG-MRT) and European LeukemiaNet (ELN) consensus report. Blood 2013; 122: pp. 1395-1398.
17. Rorden C., Brett M.: Stereotaxic display of brain lesions. Behav Neurol 2000; 12: pp. 191-200.
18. Xu Z., Burke R.P., Lee C.P., et. al.: Efficient multi-atlas abdominal segmentation on clinically acquired CT with SIMPLE context learning. Med Image Anal 2015; 24: pp. 18-27.
19. Xu Z., Gertz A.L., Baucom R.B., et. al.: Improving Multi-Atlas Abdominal Organ Segmentation via Organ-Wise Normalization. MICCAI 2015 Workshop and Challenge: Multi-Atlas Labeling Beyond Cranial Vault2015.
20. McAuliffe M.J., Lalonde F.M., McGarry D., et. al.: Medical image processing, analysis and visualization in clinical research.Proceedings of the 14th IEEE Symposium on Computer-Based Medical Systems.2001.IEEEUSA:pp. 381-386.
21. Rueckert D., Sonoda L.I., Hayes C., et. al.: Nonrigid registration using free-form deformations: application to breast MR images. IEEE Trans Med Imaging 1999; 18: pp. 712-721.
22. Wang H., Suh J.W., Das S.R., et. al.: Multi-atlas segmentation with joint label fusion. IEEE Trans Pattern Anal Mach Intell 2013; 35: pp. 611-623.
23. Dice L.R.: Measures of the amount of ecologic association between species. Ecology 1945; 26: pp. 297-302.
24. Wolz R., Chu C., Misawa K., et. al.: Automated abdominal multi-organ segmentation with subject-specific atlas generation. IEEE Trans Med Imaging 2013; 32: pp. 1723-1730.
25. Okada T., Linguraru M.G., Hori M., et. al.: Abdominal multi-organ segmentation from CT images using conditional shape–location and unsupervised intensity priors. Med Image Anal 2015; 26: pp. 1-18.
26. Harrison C., Kiladjian J.J., Al-Ali H.K., et. al.: JAK inhibition with ruxolitinib versus best available therapy for myelofibrosis. N Engl J Med 2012; 366: pp. 787-798.