
Rationale and Objectives
Magnetic resonance imaging olfactory bulb (OB) volumetry (OBV) is already used as a complementary prognostic tool to assess olfactory disorders. However, a reference standard in imaging for OBV has not been established. The aim of this in vitro study was to compare volumetric results of different magnetic resonance sequences for OBV at 3 T to genuine OB volumes measured by water displacement.
Materials and Methods
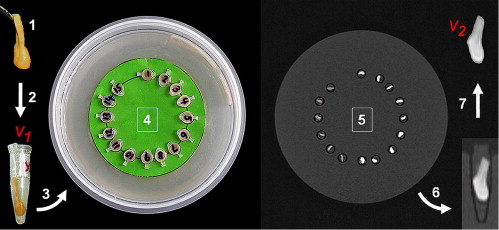
The volumes of 15 human cadaveric OBs were measured using the water displacement method in this institutional review board–approved prospective study. The magnetic resonance imaging protocol at 3 T included constructive interference in steady state (CISS), T2-weighted (T2w) three-dimensional (3D) sampling perfection with application-optimized contrasts using different flip-angle evolutions (SPACE), T2w two-dimensional (2D) turbo spin-echo (TSE), and T1-weighted (T1w) 3D fast low-angle shot (FLASH) sequences. Two blinded observers independently performed two OB volumetric assessments per bulbus and sequence. Intraobserver and interobserver reliabilities were assessed by intraclass correlation coefficients. Bland-Altman plots were analyzed to evaluate systematic biases and concordance correlation coefficients to assess reproducibility.
Results
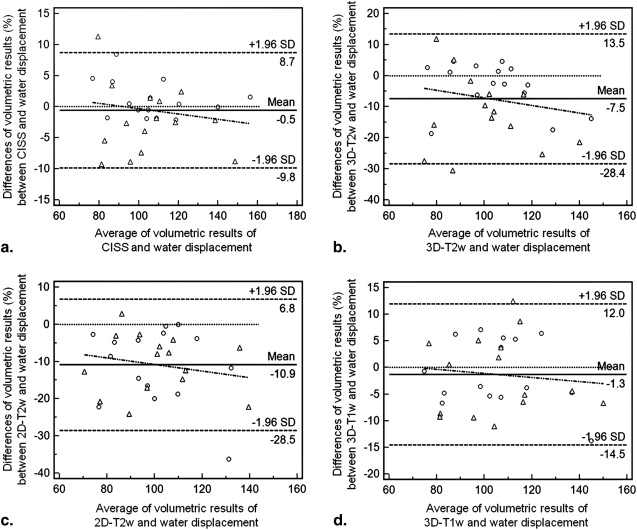
For both observers, intraclass correlation coefficient analysis yielded almost perfect results for intraobserver reliability (CISS, 0.94–0.98; T2w 3D SPACE, 0.93–0.98; T2w 2D TSE, 0.98–0.98; T1w 3D FLASH, 0.95–0.99). Interobserver reliability showed almost perfect agreement for all sequences (CISS, 0.98; T2w 3D SPACE, 0.89; T2w 2D TSE, 0.93; T1w 3D FLASH, 0.97). The CISS sequence yielded the highest mean concordance correlation coefficient (0.95) and the highest combination of precision (0.97) and accuracy (0.98) values. In comparison with the water displacement method, Bland-Altman analyses revealed the lowest systematic bias (−0.5%) for the CISS sequence, followed by T1w 3D FLASH (−1.3%), T2w 3D SPACE (–7.5%), and T2w 2D TSE (−10.9%) sequences.
Conclusions
Compared to the water displacement method, the CISS sequence is suited best to validly and reliably measure OB volumes because of its highest values for accuracy and precision and lowest systematic bias.
Olfactory bulb (OB) volumetry (OBV) has become a growing topic in the field of understanding olfactory dysfunction, for which studies have indicated a prevalence of about 20% in the Western world . OB volume decreases have been identified in all of the five most frequent etiologies of smelling disorders (ie, sinonasal disease , postinfectious , posttraumatic , neurodegenerative diseases , and idiopathic olfactory disorders ). However, volume increases have also been shown (eg, after successful olfactory rehabilitation in sinonasal diseases ), which exemplifies the reversibility of OB volume changes. These dynamic changes are most probably due to the fact that the human OB retained the ability of neuroneogenesis and therefore exhibits high structural plasticity, in which its volume is correlated to afferent neural activity transmitted by the olfactory receptor neurons . OBV has already been used as a complementary prognostic tool for radiologic diagnosis to predict outcomes in olfactory disorders .
In 1997, Yousem et al described magnetic resonance (MR) imaging (MRI) as a feasible method for OBV on the basis of T1-weighted (T1w) sequences at 1.5 T. Further development of MRI techniques and the use of MRI at higher field strength (ie, 3 T) could facilitate the quantification of volumetric results of this small paleocortical structure because the increased signal-to-noise ratio can be invested in better spatial resolution . Therefore, future studies dealing with the subject of high-resolution MR OBV should be based on standardized imaging, among other factors, for compatibility reasons. However, until now, a systematic radiologic comparison of various standardized sequences for OB volumetric purposes, which logically justifies a reference standard in imaging for upcoming studies, has not been finalized.
Get Radiology Tree app to read full this article<
Get Radiology Tree app to read full this article<
Materials and methods
Subject Recruitment, Sampling, and Experimental Design
Get Radiology Tree app to read full this article<
Get Radiology Tree app to read full this article<
Get Radiology Tree app to read full this article<
Get Radiology Tree app to read full this article<
Imaging Procedures
Get Radiology Tree app to read full this article<
Get Radiology Tree app to read full this article<
Imaging Data Analysis
Get Radiology Tree app to read full this article<
Get Radiology Tree app to read full this article<
![Figure 2, Comparison of sequences applied for in vitro olfactory bulb volumetry at 3 T. (a) Constructive interference in steady state sequence (repetition time [TR], 11.68 ms; echo time [TE], 5.84 ms; voxel size, 0.125mm 3 ); (b) T2-weighted (T2w) three-dimensional (3D) sampling perfection with application-optimized contrasts using different flip-angle evolutions sequence (TR, 1000 ms; TE, 132 ms; voxel size, 0.125mm 3 ); (c) two-dimensional T2w turbo spin-echo sequence (TR, 4800 ms; TE, 150 ms; voxel size, 0.32mm 3 ); (d) T1-weighted 3D fast low-angle shot sequence (TR, 20.0 ms; TE, 2.46 ms; voxel size, 0.216 mm 3 ). All images are in the sagittal plane and depict the same olfactory bulb.](https://storage.googleapis.com/dl.dentistrykey.com/clinical/InVitroComparisonofWaterDisplacementMethodand3TeslaMRIforMRVolumetryoftheOlfactoryBulb/1_1s20S1076633211003035.jpg)
Get Radiology Tree app to read full this article<
Get Radiology Tree app to read full this article<
Get Radiology Tree app to read full this article<
Get Radiology Tree app to read full this article<
Statistical Analysis
Get Radiology Tree app to read full this article<
Get Radiology Tree app to read full this article<
Get Radiology Tree app to read full this article<
Get Radiology Tree app to read full this article<
Get Radiology Tree app to read full this article<
Results
Get Radiology Tree app to read full this article<
Get Radiology Tree app to read full this article<
Get Radiology Tree app to read full this article<
Get Radiology Tree app to read full this article<
Get Radiology Tree app to read full this article<
Get Radiology Tree app to read full this article<
Table 1
CCCs, Interobserver Reliability, and Reproducibility ( n = 15)
Sequence CCC (ρ c ) 95% CI Pearson’s ρ (Precision) Bias Correction Factor c b (Accuracy) CISS First evaluation 0.92 0.80–0.97 0.95 0.97 Second evaluation 0.90 0.73–0.96 0.91 0.99 Average 0.95 0.88–0.98 0.97 0.98 T2w 3D SPACE First evaluation 0.70 0.41–0.86 0.84 0.83 Second evaluation 0.83 0.60–0.93 0.90 0.92 Average 0.80 0.57–0.91 0.91 0.88 T2w 2D TSE First evaluation 0.85 0.63–0.94 0.86 0.99 Second evaluation 0.83 0.58–0.94 0.84 0.99 Average 0.85 0.63–0.95 0.86 0.99 T1w 3D FLASH First evaluation 0.93 0.82–0.98 0.94 0.99 Second evaluation 0.89 0.70–0.96 0.89 0.99 Average 0.94 0.84–0.98 0.94 0.99
CCC, concordance correlation coefficient; CI, confidence interval; CISS, constructive interference in steady state; FLASH, fast low-angle shot; SPACE, sampling perfection with application-optimized contrasts using different flip-angle evolutions; 3D, three-dimensional; T1w, T1-weighted; TSE, turbo spin-echo; T2w, T2-weighted; 2D, two-dimensional.
Get Radiology Tree app to read full this article<
Get Radiology Tree app to read full this article<
Get Radiology Tree app to read full this article<
Discussion
Get Radiology Tree app to read full this article<
Get Radiology Tree app to read full this article<
Get Radiology Tree app to read full this article<
Get Radiology Tree app to read full this article<
Get Radiology Tree app to read full this article<
Get Radiology Tree app to read full this article<
Get Radiology Tree app to read full this article<
Get Radiology Tree app to read full this article<
Get Radiology Tree app to read full this article<
Get Radiology Tree app to read full this article<
Get Radiology Tree app to read full this article<
Get Radiology Tree app to read full this article<
Get Radiology Tree app to read full this article<
Conclusions
Get Radiology Tree app to read full this article<
Acknowledgments
Get Radiology Tree app to read full this article<
References
1. Duprez T.P., Rombaux P.: Imaging the olfactory tract (cranial nerve #1). Eur J Radiol 2010; 74: pp. 288-298.
2. Hoffman H.J., Cruickshanks K.J., Davis B.: Perspectives on population-based epidemiological studies of olfactory and taste impairment. Ann N Y Acad Sci 2009; 1170: pp. 514-530.
3. Vennemann M., Hummel T., Berger K.: The association between smoking and smell and taste impairment in the general population. J Neurol 2008; 255: pp. 1121-1126.
4. Hummel T.: Therapy of olfactory loss. [article in German] Laryngorhinootologie 2003; 82: pp. 552-554.
5. Rombaux P., Potier H., Bertrand B., et. al.: Olfactory bulb volume in patients with sinonasal disease. Am J Rhinol 2008; 22: pp. 598-601.
6. Mueller A., Rodewald A., Reden J., et. al.: Reduced olfactory bulb volume in post-traumatic and post-infectious olfactory dysfunction. Neuroreport 2005; 16: pp. 475-478.
7. Rombaux P., Duprez T., Hummel T.: Olfactory bulb volume in the clinical assessment of olfactory dysfunction. Rhinology 2009; 47: pp. 3-9.
8. Rombaux P., Potier H., Markessis E., et. al.: Olfactory bulb volume and depth of olfactory sulcus in patients with idiopathic olfactory loss. Eur Arch Otorhinolaryngol 2010; 267: pp. 1551-1556.
9. Gudziol V., Buschhuter D., Abolmaali N., et. al.: Increasing olfactory bulb volume due to treatment of chronic rhinosinusitis—a longitudinal study. Brain 2009; 132: pp. 3096-3101.
10. Bédard A., Parent A.: Evidence of newly generated neurons in the human olfactory bulb. Dev Brain Res 2004; 151: pp. 159-168.
11. Abolmaali N., Gudziol V., Hummel T.: Pathology of the olfactory nerve. Neuroimaging Clin North Am 2008; 18: pp. 233-242.
12. Yousem D.M., Geckle R.J., Doty R.L., et. al.: Reproducibility and reliability of volumetric measurements of olfactory eloquent structures. Acad Radiol 1997; 4: pp. 264-269.
13. Schmitt F., Grosu D., Mohr C., et. al.: 3 Tesla MRI: successful results with higher field strengths. [article in German] Radiologe 2004; 44: pp. 31-47.
14. Burmeister H.P., Baltzer P.A.T., Moslein C., et. al.: Visual grading characteristics (VGC) analysis of diagnostic image quality for high resolution 3 Tesla MRI volumetry of the olfactory bulb. Acad Radiol 2011; 18: pp. 634-639.
15. Burmeister H.P., Baltzer P.A.T., Moslein C., et. al.: Reproducibility and repeatability of volumetric measurements for olfactory bulb volumetry: which method is appropriate? An update using 3 tesla MRI. Acad Radiol 2011; 18: pp. 842-849.
16. Rombaux P., Grandin C., Duprez T.: How to measure olfactory bulb volume and olfactory sulcus depth?. B-ENT 2009; 5: pp. 53-60.
17. Rombaux P., Mouraux A., Bertrand B., et. al.: Olfactory function and olfactory bulb volume in patients with postinfectious olfactory loss. Laryngoscope 2006; 116: pp. 436-439.
18. Shrout P.E., Fleiss J.L.: Intraclass correlations: uses in assessing rater reliability. Psychol Bull 1979; 86: pp. 420-428.
19. Landis J.R., Koch G.G.: The measurement of observer agreement for categorical data. Biometrics 1977; 33: pp. 159-174.
20. Crawford S.B., Kosinski A.S., Lin H.-M., et. al.: Computer programs for the concordance correlation coefficient. Comput Methods Programs Biomed 2007; 88: pp. 62-74.
21. Lin L.I.: A concordance correlation coefficient to evaluate reproducibility. Biometrics 1989; 45: pp. 255-268.
22. Bland J.M., Altman D.G.: Statistical methods for assessing agreement between two methods of clinical measurement. Lancet 1986; 1: pp. 307-310.
23. Aickin M., Gensler H.: Adjusting for multiple testing when reporting research results: the Bonferroni vs Holm methods. Am J Public Health 1996; 86: pp. 726-728.
24. Shepherd T.M., Thelwall P.E., Stanisz G.J., et. al.: Aldehyde fixative solutions alter the water relaxation and diffusion properties of nervous tissue. Magn Reson Med 2009; 62: pp. 26-34.
25. Dietrich O., Reiser M.F., Schoenberg S.O.: Artifacts in 3-T MRI: physical background and reduction strategies. Eur J Radiol 2008; 65: pp. 29-35.
26. Kendi T.K., Arikan O.K., Koc C.: Volume of components of labyrinth: magnetic resonance imaging study. Otol Neurotol 2005; 26: pp. 778-781.
27. Melhem E.R., Shakir H., Bakthavachalam S., et. al.: Inner ear volumetric measurements using high-resolution 3D T2-weighted fast spin-echo MR imaging: initial experience in healthy subjects. AJNR Am J Neuroradiol 1998; 19: pp. 1819-1822.
28. Blatter D.D., Bigler E.D., Gale S.D., et. al.: Quantitative volumetric analysis of brain MR: normative database spanning 5 decades of life. AJNR Am J Neuroradiol 1995; 16: pp. 241-251.
29. Bitter T., Bruderle J., Gudziol H., et. al.: Gray and white matter reduction in hyposmic subjects—a voxel-based morphometry study. Brain Res 2010; 1347: pp. 42-47.
30. Bitter T., Gudziol H., Burmeister H.P., et. al.: Anosmia leads to a loss of gray matter in cortical brain areas. Chem Senses 2010; 35: pp. 407-415.
31. Bhatnagar K.P., Kennedy R.C., Baron G., et. al.: Number of mitral cells and the bulb volume in the aging human olfactory bulb: a quantitative morphological study. Anat Rec 1987; 218: pp. 73-87.
32. Yousem D.M., Geckle R.J., Bilker W.B., et. al.: Olfactory bulb and tract and temporal lobe volumes. Normative data across decades. Ann N Y Acad Sci 1998; 855: pp. 546-555.
33. Negoias S., Croy I., Gerber J., et. al.: Reduced olfactory bulb volume and olfactory sensitivity in patients with acute major depression. Neuroscience 2010; 169: pp. 415-421.