
Rationale and Objectives
In this study, we compared the effect of focused ultrasound with the effect of thermal stress on the induction of a heat inducible promoter in an in vitro model using three tumor cell lines (M21, SCCVII, and NIH3T3).
Materials and Methods
We used a reporter construct that was generated using the stress-inducible promoter from the gene encoding a murine 70-kilodalton heat shock protein (Hsp70A.1) and a luciferase ( luc ) reporter plasmid. High-intensity focused ultrasound (HIFU) was applied in two different modes. In the first mode, an increasing voltage at constant pulse duration and in the second mode a constant voltage at increasing pulse duration was applied. HIFU or thermal stress was delivered over a range of temperatures (36–52°C) for 5 minutes, and resulting luciferase activity was measured in live cells using a cooled charge-coupled device camera as a measure of reporter gene transcription. Luciferase activity was measured at set time intervals for a total of 108 hours post-stress.
Results
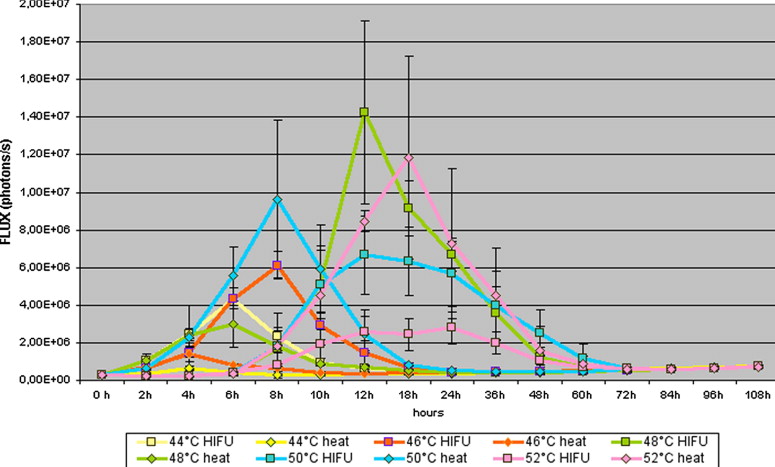
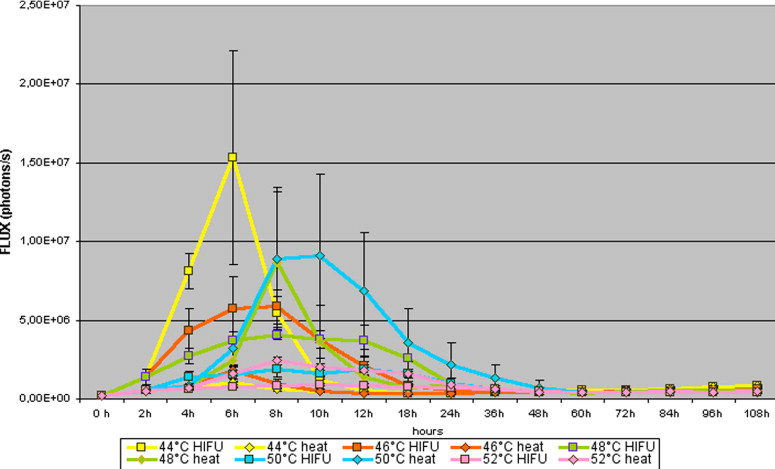
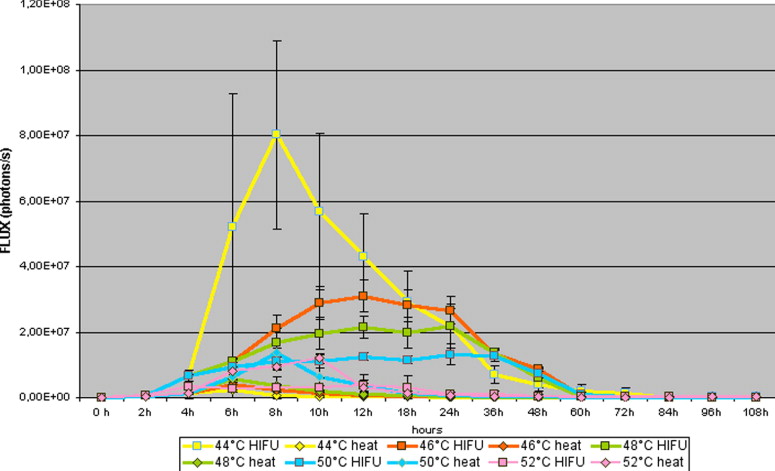
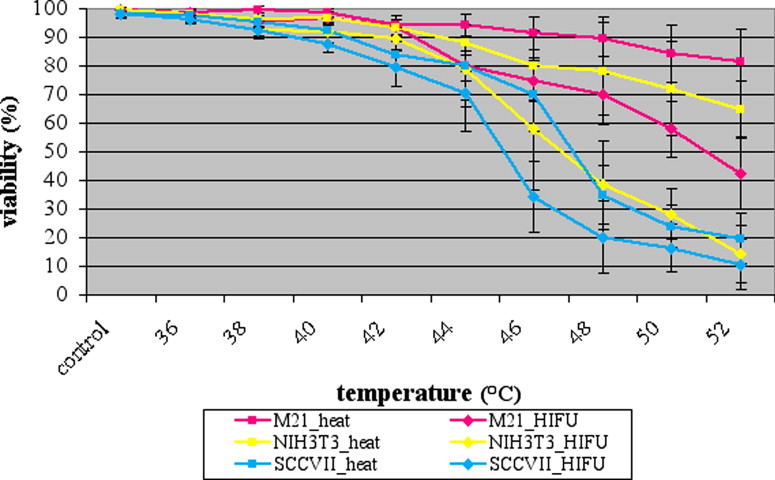
Both methods induced the hsp70 promoter; however, the luciferase activity under the influence of HIFU, independent of the applied mode, and thermal stress differs despite the fact that the temperature was the same. In the M21 tumor cell line, the maximum luciferase activity after focused ultrasound application was 4818 ± 1521% at a temperature of 48°C and after thermal stress 4468.2 ± 1890.2% at a temperature of 52°C with a viability of 72.3 ± 5.2% and 85 ± 3.4%, respectively. In the SCC tumor cell line, the maximum luciferase activity after focused ultrasound application was 6743.0 ± 3281.4% and after only thermal stress exposure was 3910.6 ± 2189.0% at a temperature of 44°C and 50°C, respectively. At the highest luciferase activity, the portion of vital cells was 72.5 ± 8.4% and 72.5 ± 5.9% respectively. In the NIH3T3 tumor cell line the highest luciferase activity of 428510.6 ± 26526.8% was seen at a temperature of 42°C applying focused ultrasound. Under thermal stress it was 29221.3 ± 7205.0% at a temperature of 50°C. At the highest luciferase activity, the viability analysis showed 75.3 ± 9.2% and 72.3 ± 7.9% viable cells, respectively.
Conclusions
Focused ultrasound induces hsp70 expression like thermal stress alone; however, HIFU is capable of inducing expression at lower temperatures than heat stress alone, indicating that nonthermal effects also play a role on the induction of hsp70 .
High-intensity focused ultrasound (HIFU) has been used clinically for thermal ablation of tumors ( ) and has promising potential as a therapeutic modality and for drug and gene delivery. So far, ultrasound has been used to permeabilize cell membranes for protein transport ( ), to enhance reporter gene expression in benign and malignant cell types both in culture and in vivo ( ), and to induce apoptosis in cell culture ( ) as well as in vivo in rabbit brain ( ) and human breast cancer ( ). HIFU causes physical changes in tissues both through physical alteration, primarily thought to be indirectly caused by either the sonochemical or sonomechanical effects of acoustic cavitation on the cells ( ), and through energy deposition leading to localized heating.
The ability of ultrasound to induce localized heating could be exploited by using HIFU in conjunction with a heat inducible promoter. It has been demonstrated that the promoter for the heat-shock protein (HSP) can activate gene expression in response to hyperthermia ( ). HSP are highly conserved and found in nearly all subcellular compartments ( ), where they perform a variety of chaperoning functions, including antigen presentation ( ) and folding/unfolding processes of nascent polypeptides and proteins ( ). These functions of the HSPs may be important in the expression of thermotolerance ( ). HSPs are not only induced by stress, but they are also associated with physiologic processes such as the cell cycle, cell proliferation, and differentiation ( ). The induced synthesis of HSPs is, at the molecular level, the cellular response to a wide range of threatening stimuli such as heat shock, heavy metals, oxidative stress, fever, inflammation, ethanol, amino acid analogs, anoxia, and agents capable of perturbing protein structure ( ).
Get Radiology Tree app to read full this article<
Get Radiology Tree app to read full this article<
Materials and methods
Reporter Construct
Get Radiology Tree app to read full this article<
Cell Culture and Transfection
Get Radiology Tree app to read full this article<
Get Radiology Tree app to read full this article<
Application of Heat Stress
Get Radiology Tree app to read full this article<
Application of HIFU
Get Radiology Tree app to read full this article<
Get Radiology Tree app to read full this article<
Table 1
Focused Ultrasound Parameter
Temp (°C) mV Pulse Duration (Milliseconds) Frequency (Hz) Intensity (W/cm 2 ) Total Energy (W/cm 2 ) P (kPa) TAP (W) Increasing voltage constant pulse duration 36 70 50 1 28.0 8,404.0 289.8 8.3 38 80 50 1 40.0 12,030.2 346.4 11.9 40 90 50 1 54.1 16,238.5 402.8 16.1 42 100 50 1 70.1 21,029.3 458.5 20.8 44 110 50 1 88.0 26,402.1 513.8 26.2 46 120 50 1 107.8 32,357.4 568.6 32.1 48 130 50 1 129.6 38,894.8 623.5 38.6 50 140 50 1 153.3 46,014.4 678.1 45.7 52 150 50 1 179.0 53,716.5 732.8 53.4 Constant voltage increasing pulse duration 36 100 20 1 28.0 8,411.0 289.8 20.8 38 100 29 1 40.0 12,107.0 346.4 20.8 40 100 39 1 54.6 16,402.8 404.7 20.8 42 100 50 1 70.1 21,029.3 458.5 20.8 44 100 63 1 88.3 26,496.8 514.6 20.8 46 100 77 1 107.8 32,385.0 568.6 20.8 48 100 92 1 128.9 38,693.8 621.8 20.8 50 100 110 1 154.2 46,264.3 680.1 20.8 52 100 128 1 179.4 53,834.8 733.6 20.8
High-intensity focused ultrasound was applied in a pulsed mode with increasing voltage and constant pulse duration and with constant voltage and increasing pulse duration achieving nearly the same intensity and the same temperatures in the conical thin-walled thermocycler tubes as measured by placing a temperature probe into the small tube.
Get Radiology Tree app to read full this article<
Imaging of Luciferase Activity
Get Radiology Tree app to read full this article<
Viability Assays and Normalization
Get Radiology Tree app to read full this article<
Statistical Analysis
Get Radiology Tree app to read full this article<
Results
Imaging of Luciferase Activity
Get Radiology Tree app to read full this article<
Table 2
Comparison of Luciferase Activity After Application of HIFU and Thermal Stress in the M21-HSP70-Luc Tumor Cell Line
M21_HSP70_Luc HIFU (Flux − Photons/Second) Increasing Voltage Constant Pulse Duration HIFU (Flux − Photons/Second) Constant Voltage Increasing Pulse Duration Thermal Stress (Flux − Photons/Second) Comparison HIFU Increase Voltage − Constant Voltage Comparison HIFU Increase Voltage − Thermal Stress Comparison HIFU Constant Voltage − Thermal Stress_n_ = 50 Mean ± SD Mean ± SD Mean ± SD_t_ -test_t_ -test_t_ -test Control 421,418 ± 173,991 434,681 ± 121,231 426,664 ± 133,896 0.431 0.831 0.561 36°C 421,906 ± 170,488 445,617 ± 151,211 414,779 ± 174,227 0.594 0.794 0.622 38°C 429,606 ± 169,231 431,114 ± 124,236 455,916 ± 178,908 0.641 0.340 0.452 40°C 551,918 ± 235,590 567,541 ± 241,210 435,181 ± 169,626 0.421 <0.001 0.003 42°C 718,143 ± 561,433 731,515 ± 512,341 446,993 ± 167,036 0.561 <0.001 0.001 44°C 1,053,806 ± 1,086,360 1,145,115 ± 913,413 458,181 ± 159,640 0.625 <0.001 <0.001 46°C 1,401,019 ± 1,651,575 1,346,131 ± 1,314,263 583,893 ± 283,335 0.551 <0.001 <0.001 48°C 2,886,344 ± 4,131,662 2,416,211 ± 5,242,421 927,062 ± 849,297 0.421 <0.001 <0.001 50°C 2,321,466 ± 2,528,159 2,145,124 ± 5,135,316 2,011,609 ± 2,900,564 0.623 0.472 0.621 52°C 1,141,216 ± 972,667 1,716,271 ± 311,523 2,779,119 ± 3,908,967 0.723 <0.001 <0.001
HIFU: high-intensity focused ultrasound; SD: standard deviation.
Table 3
Comparison of Luciferase Activity After Application of HIFU and Thermal Stress in the SCC-HSP70-Luc Tumor Cell Line
SCC_HSP70_Luc HIFU (Flux − Photons/Second) Increasing Voltage Constant Pulse Duration HIFU (Flux − Photons/Second) Constant Voltage Increasing Pulse Duration Thermal Stress (Flux − Photons/Second) Comparison HIFU Increase Voltage − Constant Voltage Comparison HIFU Increase Voltage − Thermal Stress Comparison HIFU Constant Voltage − Thermal stress_n_ = 50 Mean ± SD Mean ± SD Mean ± SD_t_ -test_t_ -test_t_ -test Control 424,675 ± 217,638 431,415 ± 225,632 412,925 ± 211,250 0.352 0.729 0.621 36°C 467,625 ± 185,618 441,223 ± 145,712 407,866 ± 191,376 0.645 0.046 0.031 38°C 511,938 ± 227,591 561,231 ± 256,448 393,014 ± 172,130 0.643 <0.001 <0.001 40°C 603,588 ± 408,266 653,482 ± 421,461 395,226 ± 162,483 0.534 <0.001 <0.001 42°C 1,144,500 ± 1,775,573 1,244,501 ± 1,275,321 479,101 ± 15,801 0.451 0.001 <0.001 44°C 2,331,000 ± 4,284,601 2,431,020 ± 4,414,641 555,601 ± 222,601 0.432 <0.001 <0.001 46°C 1,773,338 ± 2,056,824 1,972,321 ± 2,455,225 584,581 ± 391,753 0.342 <0.001 0.001 48°C 1,649,375 ± 1,511,220 1,949,241 ± 1,311,921 1,437,239 ± 2,417,385 0.443 0.506 0.406 50°C 928,415 ± 646,355 948,426 ± 316,325 2,476,126 ± 3,545,785 0.621 <0.001 <0.001 52°C 593,578 ± 202,190 653,271 ± 212,112 946,500 ± 719,872 0.564 <0.001 <0.001
HIFU: high-intensity focused ultrasound; SD: standard deviation.
Table 4
Comparison of Luciferase Activity After Application of HIFU and Thermal Stress in the NIH3T3-HSP70-Luc Tumor Cell Line
NIH3T3_HSP70_Luc HIFU (Flux − Photons/Second) Increasing Voltage Constant Pulse Duration HIFU (Flux − Photons/Second) Constant Voltage Increasing Pulse Duration Thermal stress (Flux − Photons/Second) Comparison HIFU Increase Voltage − Constant Voltage Comparison HIFU Increase Voltage − Thermal Stress Comparison HIFU Constant Voltage − Thermal Stress_n_ = 50 Mean ± SD Mean ± SD Mean ± SD_t_ -test_t_ -test_t_ -test Control 89,308 ± 13,244 93301 ± 52151 81308 ± 15466 0.446 0.450 0.421 36°C 340,100 ± 88,669 361103 ± 432051 89949 ± 15034 0.412 < .001 <0.001 38°C 1,788,038 ± 558,251 1928031 ± 441665 80795 ± 14381 0.643 <0.001 <0.001 40°C 24,939,438 ± 10,979,380 26137431 ± 12153151 95583 ± 19097 0.453 <0.001 <0.001 42°C 41,946,200 ± 13,729,074 44156101 ± 19351315 372036 ± 97891 0.553 0.001 <0.001 44°C 19,110,763 ± 8,288,854 21170263 ± 7166261 456849 ± 127791 0.425 <0.001 <0.001 46°C 11,117,225 ± 1,722,295 18112269 ± 1218155 773999 ± 277775 0.557 <0.001 0.001 48°C 8,713,475 ± 1,894,318 8114411 ± 1224151 1005249 ± 228737 0.467 <0.001 <0.001 50°C 6,141,975 ± 1,203,724 6521271 ± 1281517 2241386 ± 573161 0.663 <0.001 <0.001 52°C 1,435,525 ± 1,350,411 1531472 ± 1121212 2470636 ± 494259 0.361 <0.001 <0.001
HIFU: high-intensity focused ultrasound; SD: standard deviation.

Get Radiology Tree app to read full this article<
Get Radiology Tree app to read full this article<
Get Radiology Tree app to read full this article<
Get Radiology Tree app to read full this article<
Get Radiology Tree app to read full this article<
Viability
Get Radiology Tree app to read full this article<
Get Radiology Tree app to read full this article<
Get Radiology Tree app to read full this article<
Get Radiology Tree app to read full this article<
Discussion
Get Radiology Tree app to read full this article<
Get Radiology Tree app to read full this article<
Get Radiology Tree app to read full this article<
Get Radiology Tree app to read full this article<
Get Radiology Tree app to read full this article<
Get Radiology Tree app to read full this article<
Get Radiology Tree app to read full this article<
Get Radiology Tree app to read full this article<
Get Radiology Tree app to read full this article<
References
1. Damianou C., Hynynen K.: The effect of various physical parameters on the size and shape of necrosed tissue volume during ultrasound surgery. J Acoust Soc Am 1994; 95: pp. 1641-1649.
2. McDannold N.J., Jolesz F.A., Hynynen K.H.: Determination of the optimal delay between sonications during focused ultrasound surgery in rabbits by using MR imaging to monitor thermal buildup in vivo. Radiology 1999; 211: pp. 419-426.
3. Mitragotri S., Blankschtein D., Langer R.: Ultrasound-mediated transdermal protein delivery. Science 1995; 269: pp. 850-853.
4. Huber P.E., Pfisterer P.: In vitro and in vivo transfection of plasmid DNA in the Dunning prostate tumor R3327-AT1 is enhanced by focused ultrasound. Gene Ther 2000; 7: pp. 1516-1525.
5. Huber P.E., Mann M.J., Melo L.G., et. al.: Focused ultrasound (HIFU) induces localized enhancement of reporter gene expression in rabbit carotid artery. Gene Ther 2003; 10: pp. 1600-1607.
6. Lagneaux L., de Meulenaer E.C., Delforge A., et. al.: Ultrasonic low-energy treatment: a novel approach to induce apoptosis in human leukemic cells. Exp Hematol 2002; 30: pp. 1293-1301.
7. Honda H., Zhao Q.L., Kondo T.: Effects of dissolved gases and an echo contrast agent on apoptosis induced by ultrasound and its mechanism via the mitochondria caspase pathway. Ultrasound Med Biol 2002; 28: pp. 673-682.
8. Vykhodtseva N., McDannold N., Martin H., et. al.: Apoptosis in ultrasound-produced threshold lesions in the rabbit brain. Ultrasound Med Biol 2001; 27: pp. 111-117.
9. Huber P.E., Jenne J.W., Rastert R., et. al.: A new noninvasive approach in breast cancer therapy using magnetic resonance imaging-guided focused ultrasound surgery. Cancer Res 2001; 61: pp. 8441-8447.
10. McDannold N., Vykhodtseva N., Hynynen K.: Targeted disruption of the blood-brain barrier with focused ultrasound: association with cavitation activity. Phys Med Biol 2006; 51: pp. 793-807.
11. Dreano M., Brochot J., Myers A., et. al.: High-level, heat-regulated synthesis of proteins in eukaryotic cells. Gene 1986; 49: pp. 1-8.
12. Guilhon E., Voison P., de Zwart J.A., et. al.: Spatial and temporal control of transgene expression in vivo using a heat-sensitive promoter and MRI-guided focused ultrasound. J Gene Med 2003; 5: pp. 333-342.
13. Altmeyer A., Maki R.G., Feldweg A.M., et. al.: Tumor-specific cell surface expression of the—KDEL containing, endoplasmic reticular heat shock protein gp96. Int J Cancer 1996; 69: pp. 340-349.
14. Arispe N., DeMaio A.: ATP and ADP modulate a cation channel formed by Hsp70 in acidic phospholipid membranes. J Biol Chem 2000; 275: pp. 30839-30843.
15. DeNagel D.C., Pierce S.K.: A case for chaperones in antigen processing. Immunol Today 1992; 3: pp. 86-89.
16. Hartl F.U.: Molecular chaperones in protein folding. Nature 1996; 381: pp. 571-580.
17. Hendrick J.P., Hartl F.U.: Molecular chaperone functions of heat-shock proteins. Annu Rev Biochem 1993; 62: pp. 349-384.
18. Milarski K.L., Morimoto R.I.: Expression of human HSP70 during the synthetic phase of the cell cycle. Proc Natl Acad Sci U S A 1986; 83: pp. 9517-9521.
19. Morimoto R.I., Tissieres A., Georgopoulos C.: The stress response, function of the proteins, and perspectives.Morimoto R.I.Tissieres A.Georgopoulos C.Stress proteins in biology and medicine.1990.Cold Spring Harbor Laboratory PressNew York, NY:pp. 1-36.
20. Hightower L.E.: Heat shock, stress proteins, chaperones, and proteotoxicity. Cell 1991; 66: pp. 191-197.
21. Contag C.H., Bachmann M.H.: Advances in in vivo bioluminescence imaging of gene expression. Annu Rev Biomed Eng 2002; 4: pp. 235-260.
22. Hooper C.E., Ansorge R.E., Rushbrooke J.G.: Low-light imaging technology in the life sciences. J Biolumin Chemilumin 1994; 9: pp. 113-122.
23. Contag C.H., Spilman S.D., Contag P.R., et. al.: Visualizing gene expression in living mammals using a bioluminescent reporter. Photochem Photobiol 1997; 66: pp. 523-531.
24. Contag P.R., Olomu I.N., Stevenson D.K., et. al.: Bioluminescent indicators in living mammals. Nat Med 1998; 4: pp. 245-247.
25. Guilhon E., Voisin P., de Zwart J.A., et. al.: Spatial and temporal control of transgene expression in vivo using a heat-sensitive promoter and MRI-guided focused ultrasound. J Gene Med 2003; 5: pp. 333-342.
26. Rome C., Couillaud F., Moonen C.T.W.: Spatial and temporal control of expression of therapeutic genes using heat shock protein promoters. Methods 2005; 35: pp. 188-198.
27. Abdollahi A., Domhan S., Jenne J.W., et. al.: Apoptosis signals in lymphoblasts induced by focused ultrasound. FASEB J 2004; 18: pp. 1413-1414.
28. Huber P.E., Debus J.: Tumor cytotoxicity in vivo and radical formation in vitro depend on the shock wave-induced cavitation dose. Radiat Res 2001; 156: pp. 301-309.
29. Debus J., Spoo J., Jenne J., et. al.: Sonochemically induced radicals generated by pulsed high-energy ultrasound in vitro and in vivo. Ultrasound Med Biol 1999; 25: pp. 301-306.
30. Suslick K.S., Flint E.B.: Sonoluminescence from non-aqueous liquids. Nature 1987; 330: pp. 553-555.
31. Simko M., Hartwig C., Lantowa M., et. al.: Hsp70 expression and free radical release after exposure to non-thermal radio-frequency electromagnetic fields and ultrafine particles in human Mono Mac 6 cells. Toxicol Lett 2006; 161: pp. 73-82.
32. Barnett S.B., ter Haar G.R., Ziskin M.C., et. al.: Current status of research on biophysical effects of ultrasound. Ultrasound Med Biol 1994; 20: pp. 205-218.
33. Huber P.E., Jenne J., Debus J., Wannenmacher M.F., Pfisterer P., et. al.: A comparision of shock wave and sinusoidal-focused ultrasound-induced localized transfection of HeLa cells. Ultrasound Med Biol 1999; 25: pp. 1451-1457.
34. Thuroff S., Chaussy C., Vallancien G., et. al.: High-intensity focused ultrasound and localized prostate cancer: efficacy results from the European multicentric study. J Endourol 2003; 17: pp. 673-677.
35. Wu F., Wang Z.B., Cao Y.D., et. al.: A randomised clinical trial of high-intensity focused ultrasound ablation for the treatment of patients with localised breast cancer. Br J Can 2003; 89: pp. 2227-2233.
36. Kennedy J.E., Wu F., ter Haar G.R., et. al.: High-intensity focused ultrasound for the treatment of liver tumours. Ultrasonics 2004; 42: pp. 931-935.
37. Huber P.E., Pfisterer P.: In vitro and in vivo transfection of plasmid DNA in the Dunning prostate tumor R3327-AT1 is enhanced by focused ultrasound. Gene Therapy 2000; 7: pp. 1516-1525.
38. Huber P.E., Jenne J., Debus J., et. al.: A comparison of shock wave ans sinusoidal-focused ultrasound induced localized transfection of HeLa Cells. Ultrasound Med Biol 1999; 25: pp. 1451-1457.
39. Frenkel V., Li K.C.: Potential role of pulsed-high intensity focused ultrasound in gene therapy. Future Oncol 2006; 2: pp. 111-119.
40. Vekris A., Maurange C., Moonen C., et. al.: Control of transgene expression using local hyperthermia in combination with a heat sensitive promoter. J Gene Med 2000; 2: pp. 89-96.
41. Lohr F., Hu K., Huang Q., et. al.: Enhancement of radiotherapy by hyperthermia-regulated gene therapy. Int J Radiat Oncol Biol Phys 2000; 48: pp. 1513-1518.
42. Huang Q., Hu J.K., Lohr F., et. al.: Heat-induced gene expression as a novel targeted cancer gene therapy strategy. Cancer Res 2000; 60: pp. 3435-3439.
43. Gething M.J., Sambrook J.: Protein folding in the cell. Nature 1992; 355: pp. 33-45.
44. Henle K.J., Nagle W.A.: Inhibition of heat shock protein synthesis and protein glycosylation by stepdown heating. Exp Cell Res 1991; 196: pp. 184-191.
45. O’Connell-Rodwell C.E., Shriver D., Simanovskii D., et. al.: A genetic reporter of thermal stress defines physiologic zones over a defined temperature range. FASEB J 2004; 18: pp. 264-271.