
Rationale and Objectives
1 H-magnetic resonance spectroscopy ( 1 H-MRS) has proved to be the sole in vivo technique able to measure intramyocellular lipids (IMCL) in both humans and animals. Mouse models are now widely used for physiologic studies and drug discovery. However, IMCL assessment using 1 H-MRS is hindered in this animal model by the small muscle size and strong contamination from the extramyocellular lipid (EMCL) signal. The objective of this study was to the use of 1 H-MRS for IMCL quantification in mice at different ages.
Materials and Methods
Noninvasive IMCL quantification was performed at 7 T in tibialis anterior (TA) muscles of healthy male C57/BL6 mice ( n = 9; age, 13.6 ± 1 months), db/db mice ( n = 4), and their C57BL/KSJ control littermates ( n = 4) at 7 and 17 weeks of age.
Results
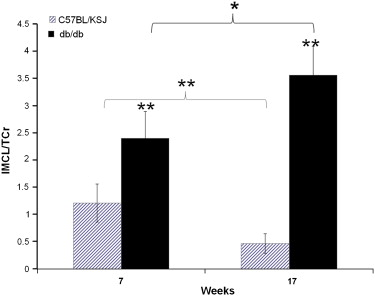
The IMCL content of diabetic mice TA was significantly higher than their littermates (2.41 ± 0.5 vs. 1.21 ± 0.35, P < .01). An age effect was observed, with TA IMCL levels being lower in older than younger control mice, but increasing between 7 and 17 weeks in the db/db mice.
Conclusions
The feasibility of 1 H-MRS spectroscopy was demonstrated in mice muscle, despite its small size, and used to assess IMCL content in db/db mice.
In skeletal muscle, lipids can be stored extramyocellularly within interstitial adipocytes or intracellularly within muscle cell cytoplasm as droplets in direct contact with mitochondria, serving as a source of energy . Quantifying intramyocellular lipids (IMCL) became important because of their contribution to such metabolic disorders as obesity, insulin resistance, and diabetes . Quantification can be performed invasively using biopsy specimens for biochemical analysis or electron morphometry . However, these methods are not suitable for repeated examination, especially in animal application because of the sacrifice of animals and are physically limited by the small size of the region of interest. In addition, IMCL levels quantified by biochemical analysis may be overestimated because of extramyocellular lipid (EMCL) contamination and therefore necessitate careful microdissection of the muscle to minimize this contamination .
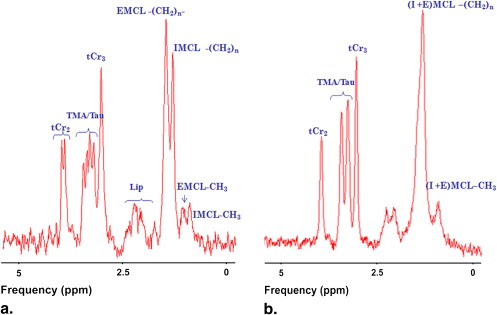
1 H-magnetic resonance spectroscopy ( 1 H-MRS) is the only method so far able to distinguish IMCL from EMCL in vivo. Unlike EMCL methylene group resonance, IMCL methylene group resonance at 1.3 parts per million (ppm) is independent of the angle between muscle fiber and the static magnetic field direction, because of the spherical form of the IMCL droplets within the muscle cell cytoplasm. Aligning muscle fiber parallel to the static magnetic field maximizes the chemical shift difference between the two lipid components , enabling IMCL and EMCL to be quantified separately. 1 H-MRS has been applied successfully in human , dog , rabbit , and rat muscle to investigate certain muscle lipid metabolism disorders, and to study drug, nutrition, and exercise effects . Previous 1 H-MRS studies have also shown that IMCL content depends on strain, age, sex, gender, and fiber type .
Get Radiology Tree app to read full this article<
Get Radiology Tree app to read full this article<
Materials and methods
Experimental Protocol
Get Radiology Tree app to read full this article<
Animal Preparation
Get Radiology Tree app to read full this article<
MRS Measurements
Get Radiology Tree app to read full this article<
Get Radiology Tree app to read full this article<
Data Processing and Statistical Evaluation
Get Radiology Tree app to read full this article<
Get Radiology Tree app to read full this article<
Get Radiology Tree app to read full this article<
Get Radiology Tree app to read full this article<
Get Radiology Tree app to read full this article<
Results
Get Radiology Tree app to read full this article<
Get Radiology Tree app to read full this article<
Get Radiology Tree app to read full this article<
Get Radiology Tree app to read full this article<
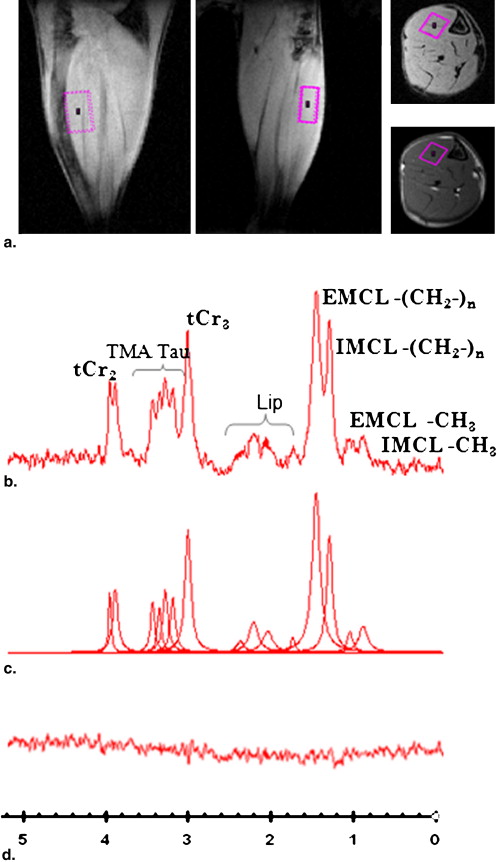
![Figure 2, (a) Spin echo transverse magnetic resonance image of db/db mouse hindleg and their littermate control mouse at 7 weeks of age (repetition time [TR]/echo time [TE] = 1000/10 ms, 97 × 117 μm 2 , thickness of 1 mm), (b) 1 H-magnetic resonance spectroscopy spectrum obtained from of tibialis anterior at 7 and 17 weeks (PRESS, TR/TE: 2000/18 ms, volume of interest: 2 μL, VAPOR, and SVD water suppression).](https://storage.googleapis.com/dl.dentistrykey.com/clinical/InVivoAssessmentofMouseHindlegIntramyocellularLipidsby1HMRSpectroscopy/1_1s20S1076633208007460.jpg)
Get Radiology Tree app to read full this article<
Get Radiology Tree app to read full this article<
Get Radiology Tree app to read full this article<
Get Radiology Tree app to read full this article<
Discussion
Get Radiology Tree app to read full this article<
Get Radiology Tree app to read full this article<
Get Radiology Tree app to read full this article<
Get Radiology Tree app to read full this article<
Get Radiology Tree app to read full this article<
Get Radiology Tree app to read full this article<
Get Radiology Tree app to read full this article<
References
1. Hoppeler H.: Exercise-induced ultrastructural changes in skeletal muscle. Int J Sports Med 1986; 7: pp. 187-204.
2. Pan D.A., Lillioja S., Kriketos A.D., et. al.: Skeletal muscle triglyceride levels are inversely related to insulin action. Diabetes 1997; 46: pp. 983-988.
3. Krssak M., Falk Petersen K., Dresner A., et. al.: Intramyocellular lipid concentrations are correlated with insulin sensitivity in humans: a 1H NMR spectroscopy study. Diabetologia 1999; 42: pp. 113-116.
4. Goodpaster B.H., Wolf D.: Skeletal muscle lipid accumulation in obesity, insulin resistance, and type 2 diabetes. Pediatr Diabetes 2004; 5: pp. 219-226.
5. Kelley D.E., Goodpaster B.H., Storlien L.: Muscle triglyceride and insulin resistance. Annu Rev Nutr 2002; 22: pp. 325-346.
6. Morgan T.E., Short F.A., Cobb L.A.: Effect of long-term exercise on skeletal muscle lipid composition. Am J Physiol 1969; 216: pp. 82-86.
7. Hoppeler H., Luthi P., Claassen H., et. al.: The ultrastructure of the normal human skeletal muscle. A morphometric analysis on untrained men, women and well-trained orienteers. Pflugers Arch 1973; 344: pp. 217-232.
8. Schrauwen-Hinderling V.B., Hesselink M.K., Schrauwen P., et. al.: Intramyocellular lipid content in human skeletal muscle. Obesity (Silver Spring) 2006; 14: pp. 357-367.
9. Machann J., Haring H., Schick F., et. al.: Intramyocellular lipids and insulin resistance. Diabetes Obes Metab 2004; 6: pp. 239-248.
10. Boesch C., Slotboom J., Hoppeler H., et. al.: In vivo determination of intra-myocellular lipids in human muscle by means of localized 1H-MR-spectroscopy. Magn Reson Med 1997; 37: pp. 484-493.
11. Goodpaster B.H., He J., Watkins S., et. al.: Skeletal muscle lipid content and insulin resistance: evidence for a paradox in endurance-trained athletes. J Clin Endocrinol Metab 2001; 86: pp. 5755-5761.
12. Thamer C., Machann J., Bachmann O., et. al.: Intramyocellular lipids: anthropometric determinants and relationships with maximal aerobic capacity and insulin sensitivity. J Clin Endocrinol Metab 2003; 88: pp. 1785-1791.
13. Rico-Sanz J., Moosavi M., Thomas E.L., et. al.: In vivo evaluation of the effects of continuous exercise on skeletal muscle triglycerides in trained humans. Lipids 2000; 35: pp. 1313-1318.
14. Stannard S.R., Thompson M.W., Fairbairn K., et. al.: Fasting for 72 h increases intramyocellular lipid content in nondiabetic, physically fit men. Am J Physiol Endocrinol Metab 2002; 283: pp. E1185-1191.
15. Szczepaniak L.S., Babcock E.E., Schick F., et. al.: Measurement of intracellular triglyceride stores by H spectroscopy: validation in vivo. Am J Physiol 1999; 276: pp. E977-E989.
16. Roy H., Bhardwaj S., Babu M., et. al.: VEGF-A, VEGF-D, VEGF receptor-1, VEGF receptor-2, NF-kappaB, and RAGE in atherosclerotic lesions of diabetic Watanabe heritable hyperlipidemic rabbits. FASEB J 2006; 20: pp. 2159-2161.
17. Neumann-Haefelin C., Kuhlmann J., Belz U., et. al.: Determinants of intramyocellular lipid concentrations in rat hindleg muscle. Magn Reson Med 2003; 50: pp. 242-248.
18. Kuhlmann J., Neumann-Haefelin C., Belz U., et. al.: Correlation between insulin resistance and intramyocellular lipid levels in rats. Magn Reson Med 2005; 53: pp. 1275-1282.
19. Kuhlmann J., Neumann-Haefelin C., Belz U., et. al.: Intramyocellular lipid and insulin resistance: a longitudinal in vivo 1H-spectroscopic study in Zucker diabetic fatty rats. Diabetes 2003; 52: pp. 138-144.
20. Boesch C., Decombaz J., Slotboom J., et. al.: Observation of intramyocellular lipids by means of 1H magnetic resonance spectroscopy. Proc Nutr Soc 1999; 58: pp. 841-850.
21. De Feyter H.M., Schaart G., Hesselink M.K., et. al.: Regional variations in intramyocellular lipid concentration correlate with muscle fiber type distribution in rat tibialis anterior muscle. Magn Reson Med 2006; 56: pp. 19-25.
22. Hwang J.H., Pan J.W., Heydari S., et. al.: Regional differences in intramyocellular lipids in humans observed by in vivo 1H-MR spectroscopic imaging. J Appl Physiol 2001; 90: pp. 1267-1274.
23. Bastie C.C., Zong H., Xu J., et. al.: Integrative metabolic regulation of peripheral tissue fatty acid oxidation by the SRC kinase family member Fyn. Cell Metab 2007; 5: pp. 371-381.
24. Liu L., Zhang Y., Chen N., et. al.: Upregulation of myocellular DGAT1 augments triglyceride synthesis in skeletal muscle and protects against fat-induced insulin resistance. J Clin Invest 2007; 117: pp. 1679-1689.
25. Conlon T.J., Walter G., Owen R., et. al.: Systemic correction of a fatty acid oxidation defect by intramuscular injection of a recombinant adeno-associated virus vector. Hum Gene Ther 2006; 17: pp. 71-80.
26. Han D.H., Nolte L.A., Ju J.S., et. al.: UCP-mediated energy depletion in skeletal muscle increases glucose transport despite lipid accumulation and mitochondrial dysfunction. Am J Physiol Endocrinol Metab 2004; 286: pp. E347-E353.
27. Fissoune R., Hiba B., Janier M., et. al.: In vivo quantification of intramyocellular lipid in Mouse hindleg muscle. Proc Intl Soc Mag Reson Med 2006; 14: pp. 1671.
28. Laurent D., Yerby B., Sari-Sarraf F., et. al.: Measurement of ectopic fat deposition in genetically modified mice fed a high fat diet. Proc Intl Soc Mag Reson Med 2006; 14: pp. 474.
29. Gounarides J.S., Korach-Andre M., Killary K., et. al.: Effect of dexamethasone on glucose tolerance and fat metabolism in a diet-induced obesity mouse model. Endocrinology 2008; 149: pp. 758-766.
30. Naressi A., Couturier C., Devos J.M., et. al.: Java-based graphical user interface for the MRUI quantitation package. Magma 2001; 12: pp. 141-152.
31. Vanhamme L., van den Boogaart A., Van Huffel S.: Improved method for accurate and efficient quantification of MRS data with use of prior knowledge. J Magn Reson 1997; 129: pp. 35-43.
32. Kreis R., Boesch C.: Liquid-crystal-like structures of human muscle demonstrated by in vivo observation of direct dipolar coupling in localized proton magnetic resonance spectroscopy. J Magn Reson B 1994; 104: pp. 189-192.
33. Asllani I., Shankland E., Pratum T., et. al.: Anisotropic orientation of lactate in skeletal muscle observed by dipolar coupling in (1)H NMR spectroscopy. J Magn Reson 1999; 139: pp. 213-224.
34. in ‘t Zandt H.J., Klomp D.W., Oerlemans F., et. al.: Proton MR spectroscopy of wild-type and creatine kinase deficient mouse skeletal muscle: dipole-dipole coupling effects and post-mortem changes. Magn Reson Med 2000; 43: pp. 517-524.
35. Heemskerk A.M., Strijkers G.J., Vilanova A., et. al.: Determination of mouse skeletal muscle architecture using three-dimensional diffusion tensor imaging. Magn Reson Med 2005; 53: pp. 1333-1340.
36. Boesch C., Machann J., Vermathen P., et. al.: Role of proton MR for the study of muscle lipid metabolism. NMR Biomed 2006; 19: pp. 968-988.
37. Boesch C., Kreis R.: Dipolar coupling and ordering effects observed in magnetic resonance spectra of skeletal muscle. NMR Biomed 2001; 14: pp. 140-148.
38. Ntziachristos V., Kreis R., Boesch C., et. al.: Dipolar resonance frequency shifts in 1H MR spectra of skeletal muscle: confirmation in rats at 4.7 T in vivo and observation of changes postmortem. Magn Reson Med 1997; 38: pp. 33-39.
39. Almond R.E., Cawthorne M.A., Enser M.: Muscles of diabetic (db/db) mice: fibre size, fibre type and the effects of a thermogenic, beta-adrenoceptor agonist. Int J Obes 1988; 12: pp. 81-91.
40. Kelley D.E., He J., Menshikova E.V., et. al.: Dysfunction of mitochondria in human skeletal muscle in type 2 diabetes. Diabetes 2002; 51: pp. 2944-2950.
41. Hojlund K., Wrzesinki K., Larsen P.: proteome analysis reveals phosphorylation of ATP synthase beta-subunit in human skeletal muscle and proteins with potential roles in type 2 diabetes. J Biol Chem 2004; 278: pp. 10436-10442.
42. Ritov V., Menshikova E., He J., et. al.: Deficiency of subsarcolemmal mitochondria in obesity and type 2 diabetes. Diabetes 2005; 54: pp. 8-14.
43. Choo H.J., Kim J.H., Kwon O.B., et. al.: Mitochondria are impaired in the adipocytes of type 2 diabetic mice. Diabetologia 2006; 49: pp. 784-791.