
Rationale and Objectives
Epicardial adipose tissue (EAT), pericardial adipose tissue (PAT), and subcutaneous adipose tissue (SAT) are mediators of metabolic risk and may be involved in the pathogenesis of coronary artery disease. The aim of this study was to investigate the association of visceral and subcutaneous fat depots with the presence and severity of coronary artery calcium (CAC) in asymptomatic individuals.
Materials and Methods
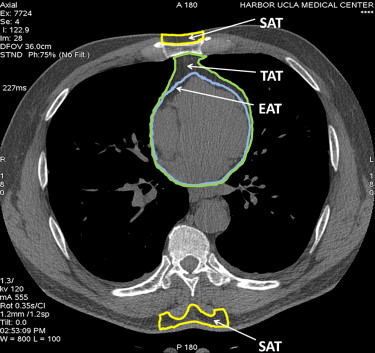
One hundred eleven consecutive subjects underwent CAC assessment, and their Framingham risk scores were measured. EAT, total thoracic adipose tissue, and SAT volumes were measured from slice level 15 mm above to 30 mm below the ostium of the left main coronary artery. PAT was calculated as thoracic adipose tissue − EAT. SAT was defined as the volume of fat depot anterior to the sternum and posterior to the vertebra. CAC was defined as 0, 1 to 100, 101 to 400, or ≥400. Relative risk regression analysis was used to assess the association between fat depots and CAC.
Results
There were modest correlations between EAT ( r = 0.58), PAT ( r = 0.47), SAT ( r = 0.34), and CAC ( P < .01). EAT, PAT, and SAT increased proportionally with the severity of CAC in both genders ( P < .05). After adjustment for cardiovascular risk factors and body mass index, the relative risks for each standard deviation increase in EAT, PAT, and SAT were 3.3 (95% confidence interval, 1.9–5.6), 2.7 (95% confidence interval, 1.6–3.9), and 2.6 (95% confidence interval, 1.5–4.4) for CAC ≥ 100 compared to CAC 0, respectively ( P < .05). The area under the receiver-operating characteristic curve to predict CAC ≥ 100 was higher in each fat depot compared to Framingham risk score, and addition of fat depots to Framingham risk score provided maximum prognostication value to detect CAC ≥ 100.
Conclusions
Increased EAT, PAT, and SAT are associated with the severity of CAC independent of risk factors.
Cardiovascular death has been reduced significantly because of improvements in detection and management of coronary artery disease (CAD) over the past few decades . However the recent increase in the rate of overweight and obesity, up to two thirds of the US population, may diminish the favorable effect of recent improvements in the diagnosis and treatment of CAD .
Adipocytes secrete numerous factors that could potentially modulate the development of vascular disease, including proinflammatory cytokines and adipokines, angiogenic molecules, and stem cell homing factors . Recent evidence indicates that adipose tissue is a functional component, exerting paracrine influences on blood vessel contractility .
Get Radiology Tree app to read full this article<
Get Radiology Tree app to read full this article<
Get Radiology Tree app to read full this article<
Materials and methods
Get Radiology Tree app to read full this article<
CAC Scanning
Get Radiology Tree app to read full this article<
Get Radiology Tree app to read full this article<
Get Radiology Tree app to read full this article<
PAT, Thoracic Adipose Tissue (TAT), and SAT Measurement
Get Radiology Tree app to read full this article<
Get Radiology Tree app to read full this article<
Get Radiology Tree app to read full this article<
Statistical Analysis
Get Radiology Tree app to read full this article<
Results
Get Radiology Tree app to read full this article<
Table 1
Cardiovascular Risk Factors, Adipose Tissue Volume, and Severity of CAC
CAC 0 CAC 1–100 CAC 101–400 CAC ≥ 400 Variable ( n = 33) ( n = 24) ( n = 20) ( n = 34)P Age (years) 56 ± 11 61 ± 10 64 ± 11 68 ± 11 .0001 Men 14 11 16 23 .01 Current smokers 0 13% 0 3% .10 Hypertension ∗ 30% 50% 40% 41% .50 Hypercholesterolemia † 42% 54% 70% 53% .30 Diabetes mellitus ‡ 6% 13% 5% 24% .10 Family history of CHD § 58% 46% 65% 62% .60 SBP (mm Hg) 125 ± 17 125 ± 18 133 ± 19 123 ± 16 .40 DBP (mm Hg) 77 ± 10 74 ± 8 77 ± 7 73 ± 8 .20 BMI (kg/m 2 ) 26.7 ± 3.4 26.9 ± 2.8 27.8 ± 3.8 28.2 ± 3.9 .20 Total cholesterol (mg/dL) 189 ± 31 190 ± 33 164 ± 34 173 ± 46 .50 HDL-C (mg/dL) 53 ± 18 56 ± 15 46 ± 9 46 ± 11 .30 LDL-C (mg/dL) 112 ± 40 103 ± 34 96 ± 28 94 ± 42 .60 Triglycerides (mg/dL) 119 ± 41 120 ± 44 114 ± 40 124 ± 47 .80 BMI (kg/m 2 ) 29.7 ± 4.1 30.3 ± 4.6 30.3 ± 4.6 30.4 ± 3.9 .30 FRS (%) 6.8 ± 3.9 9.5 ± 4.1 11.6 ± 4.3 14.7 ± 4.4 .001 EAT (cm 3 ) 68.3 ± 35.6 79.3 ± 38.5 102.1 ± 47.9 108.6 ± 38.8 .0001 PAT (cm 3 ) 57.3 ± 49.5 66.7 ± 46.1 83.7 ± 49.9 107.9 ± 49.3 .0001 SAT (cm 3 ) 53.9 ± 28.9 64.2 ± 32.1 83.4 ± 32.2 86.5 ± 40.1 .0001 Total TAT (cm 3 ) 125.6 ± 68.6 146.1 ± 59.1 185.7 ± 66.4 216.5 ± 65.5 .0001
Data are expressed as mean ± SD or as percentages.
BMI, body mass index; CAC, coronary artery calcium; CHD, coronary heart disease; DBP, diastolic blood pressure; EAT, epicardial adipose tissue; FRS, Framingham risk score; HDL-C, high-density lipoprotein cholesterol; LDL-C, high-density lipoprotein cholesterol; PAT, pericardial adipose tissue; SAT, subcutaneous adipose tissue; SBP, systolic blood pressure; TAT, thoracic adipose tissue.
CAC Coronary Artery Calcium Score; SBP Systolic Blood Pressure; DBP Diastolic Blood Pressure.
Get Radiology Tree app to read full this article<
Get Radiology Tree app to read full this article<
Get Radiology Tree app to read full this article<
Get Radiology Tree app to read full this article<
Get Radiology Tree app to read full this article<
Adipose Tissue and CAC
Get Radiology Tree app to read full this article<
Get Radiology Tree app to read full this article<
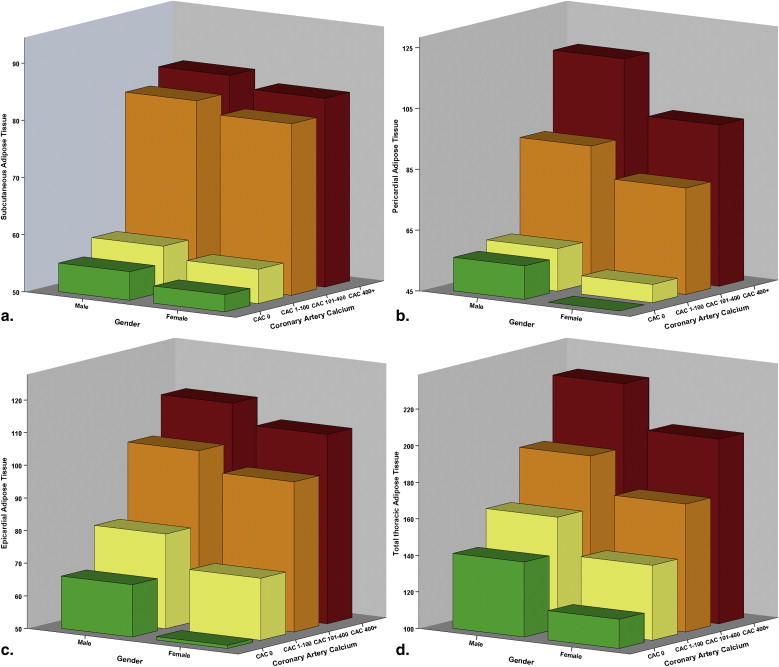
Table 2
Linear Regression Analysis of the Association Between Cardiovascular Risk Factors and CAC
Model_R__R_ 2 β 95% CI_P_ Single variables I: EAT 0.58 0.34 0.21 0.11 to 0.62 .0001 II: PAT 0.47 0.22 0.15 0.05 to 0.22 .0001 III: SAT 0.34 0.12 0.11 0.02 to 0.21 .0001 IV: TAT 0.51 0.27 0.19 0.07 to 0.32 .0001 V: BMI 0.17 0.03 0.02 −0.01 to 0.03 .10 Combination variables VI SAT 0.08 0.03 to 0.11 .01 + PAT 0.10 0.03 to 0.14 .001 + 0.65 0.45 EAT 0.16 0.08 to 0.23 .0001 + FRS 0.09 0.02 to 0.12 .03 VII SAT 0.06 0.01 to 0.11 .01 + PAT 0.08 0.02 to 0.15 .01 + EAT 0.13 0.03 to 0.32 .001 + Age 0.02 0.01 to 0.08 .001 + Gender (male) 0.15 0.02 to 0.35 .02 + 0.74 0.55 Hypercholesterolemia 0.12 −0.02 to 0.19 .10 + Diabetes mellitus 0.17 −0.01 to 0.21 .10 + Hypertension 0.08 −0.03 to 0.15 .30 + Smoking status 0.05 −0.02 to 0.11 .10 + Family history of CHD 0.03 −0.05 to 0.15 .50 + BMI 0.02 −0.01 to 0.06 .10
Dependent variable: CAC.
BMI, body mass index; CAC, coronary artery calcium; CHD, coronary heart disease; CI, confidence interval; EAT, epicardial adipose tissue; FRS, Framingham risk score; PAT, pericardial adipose tissue; SAT, subcutaneous adipose tissue; TAT, thoracic adipose tissue.
Table 3
Multivariate Relative Risk Regression Analysis of the Association Between Adipose Tissues and CAC
Model CAC 0 CAC ≥ 100P Unadjusted SAT 1 (reference) 1.76 (1.22–2.54) .003 PAT 1 (reference) 1.88 (1.22–7.92) .004 TAT 1 (reference) 2.25 (1.43–4.91) .0001 EAT 1 (reference) 2.98 (1.92–4.62) .0001 Adjusted for age and gender SAT 1 (reference) 1.95 (1.58–4.79) .0001 PAT 1 (reference) 2.16 (1.41–3.32) .0001 TAT 1 (reference) 2.69 (1.55–4.66) .0001 EAT 1 (reference) 3.04 (1.78–5.18) .0001 Adjusted for age, gender, and BMI SAT 1 (reference) 2.46 (1.49–4.15) .001 PAT 1 (reference) 2.50 (1.51–3.64) .0001 TAT 1 (reference) 2.94 (1.57–5.51) .0001 EAT 1 (reference) 3.17 (1.72–5.47) .0001 Adjusted for age, gender, hypertension, hypercholesterolemia, diabetes mellitus, family of history of CHD, smoking status, and BMI SAT 1 (reference) 2.57 (1.48–4.45) .001 PAT 1 (reference) 2.72 (1.64–3.94) .0001 TAT 1 (reference) 3.06 (1.87–5.03) .0001 EAT 1 (reference) 3.32 (1.95–5.62) .0001
Relative risk (95% confidence interval) of SAT, TAT, and PAT per standard deviation increase.
BMI, body mass index; CAC, coronary artery calcium; CHD, coronary heart disease; EAT, epicardial adipose tissue; PAT, pericardial adipose tissue; SAT, subcutaneous adipose tissue; TAT, thoracic adipose tissue.
Get Radiology Tree app to read full this article<
Get Radiology Tree app to read full this article<
Get Radiology Tree app to read full this article<
Get Radiology Tree app to read full this article<
Table 4
C Statistics to Assess the Diagnostic Accuracy of Regional Adipose Tissues and Clinical Variables for the Detection of Significant CAC
Variable AUC ± SE 95% CI_P_ Comparison P with FRS FRS 0.63 ± 0.04 0.58-0.73 .0001 — SAT 0.69 ± 0.03 0.58-0.81 .0001 .05 PAT 0.77 ± 0.03 0.65-0.83 .0001 .01 EAT 0.83 ± 0.02 0.67-0.87 .0001 .004 SAT + PAT + EAT 0.86 ± 0.02 0.78-0.92 .0001 .0001 SAT + PAT + EAT + FRS 0.88 ± 0.02 0.81-0.91 .0001 .0001
AUC, area under the receiver-operating characteristic curve; CAC, coronary artery calcium; CI, confidence interval; EAT, epicardial adipose tissue; FRS, Framingham risk score; PAT, pericardial adipose tissue; SAT, subcutaneous adipose tissue; SE, standard error.
Get Radiology Tree app to read full this article<
Discussion
Get Radiology Tree app to read full this article<
Pathophysiology
Get Radiology Tree app to read full this article<
Get Radiology Tree app to read full this article<
Get Radiology Tree app to read full this article<
Get Radiology Tree app to read full this article<
Get Radiology Tree app to read full this article<
Adipose Tissue and Coronary Atherosclerosis
Get Radiology Tree app to read full this article<
Get Radiology Tree app to read full this article<
Get Radiology Tree app to read full this article<
Implications
Get Radiology Tree app to read full this article<
Limitations
Get Radiology Tree app to read full this article<
Conclusions
Get Radiology Tree app to read full this article<
References
1. Thom T., Haase N., Rosamond W., et. al.: Heart disease and stroke statistics—2006 update: a report from the American Heart Association Statistics Committee and Stroke Statistics Subcommittee. Circulation 2006; pp. e85-e151.
2. Hu F.B., Stampfer M.J., Manson J.E., et. al.: Trends in the incidence of coronary heart disease and changes in diet and lifestyle in women. N Engl J Med 2000; 343: pp. 530-537.
3. Flegal K.M., Carroll M.D., Ogden C.L., et. al.: Prevalence and trends in obesity among US adults, 1999-2000. JAMA 2002; 288: pp. 1723-1727.
4. Ogden C.L., Carroll M.D., Curtin L.R., McDowell M.A., Tabak C.J., Flegal K.M.: Prevalence of overweight and obesity in the United States, 1999-2004. JAMA 2006; 295: pp. 1549-1555.
5. Jeong J.W., Jeong M.H., Yun K.H., et. al.: Echocardiographic epicardial fat thickness and coronary artery disease. Circ J 2007; 71: pp. 536-539.
6. Maurovich-Horvat P., Massaro J., Fox C.S., et. al.: Comparison of anthropometric, area- and volume-based assessment of abdominal subcutaneous and visceral adipose tissue volumes using multi-detector computed tomography. Int J Obes (Lond) 2007; 31: pp. 500-506.
7. Lohn M., Dubrovska G., Lauterbach B., et. al.: Periadventitial fat releases a vascular relaxing factor. FASEB J 2002; 16: pp. 1057-1063.
8. Verlohren S., Dubrovska G., Tsang S.Y., et. al.: Visceral periadventitial adipose tissue regulates arterial tone of mesenteric arteries. Hypertension 2004; 44: pp. 271-276.
9. Hamdy O., Porramatikul S., Al-Ozairi E.: Metabolic obesity: the paradox between visceral and subcutaneous fat. Curr Diabetes Rev 2006; 2: pp. 367-373.
10. Ding J., Hsu F.C., Harris T.B., et. al.: The association of pericardial fat with incident coronary heart disease: the Multi-Ethnic Study of Atherosclerosis (MESA). Am J Clin Nutr 2009; 90: pp. 499-504.
11. Taguchi R., Takasu J., Itani Y., et. al.: Pericardial fat accumulation in men as a risk factor for coronary artery disease. Atherosclerosis 2001; 157: pp. 203-209.
12. Third report of the National Cholesterol Education Program (NCEP) Expert Panel on Detection, Evaluation, and Treatment of High Blood Cholesterol in Adults (Adult Treatment Panel III) final report. Circulation 2002; 106: pp. 3143-3421.
13. Becker C.R., Knez A., Jakobs T.F., et. al.: Detection and quantification of coronary artery calcification with electron-beam and conventional CT. Eur Radiol 1999; 9: pp. 620-624.
14. DeLong E.R., DeLong D.M., Clarke-Pearson D.L.: Comparing the areas under two or more correlated receiver operating characteristic curves: a nonparametric approach. Biometrics 1988; 44: pp. 837-845.
15. Rocha V.Z., Libby P.: Obesity, inflammation, and atherosclerosis. Nat Rev Cardiol 2009; 6: pp. 399-409.
16. Rosito G.A., Massaro J.M., Hoffmann U., et. al.: Pericardial fat, visceral abdominal fat, cardiovascular disease risk factors, and vascular calcification in a community-based sample: the Framingham Heart Study. Circulation 2008; 117: pp. 605-613.
17. Arner P.: Differences in lipolysis between human subcutaneous and omental adipose tissues. Ann Med 1995; 27: pp. 435-438.
18. Hellmér J., Marcus C., Sonnenfeld T., et. al.: Mechanisms for differences in lipolysis between human subcutaneous and omental fat cells. J Clin Endocrinol Metab 1992; 75: pp. 15-20.
19. Fried S.K., Leibel R.L., Edens N.K., et. al.: Lipolysis in intraabdominal adipose tissues of obese women and men. Obes Res 1993; 1: pp. 443-448.
20. Chatterjee T.K., Stoll L.L., Denning G.M., et. al.: Proinflammatory phenotype of perivascular adipocytes: influence of high-fat feeding. Circ Res 2009; 104: pp. 541-549.
21. Berg A.H., Scherer P.E.: Adipose tissue, inflammation, and cardiovascular disease. Circ Res 2005; 96: pp. 939-949.
22. Ho E., Shimada Y.: Formation of the epicardium studied with the scanning electron microscope. Dev Biol 1978; 66: pp. 579-585.
23. Tadros T.M., Massaro J.M., Rosito G.A., et. al.: Pericardial fat volume correlates with inflammatory markers: the Framingham Heart Study. Obesity (Silver Spring) 2010; 18: pp. 1039-1045.
24. Bruun J.M., Lihn A.S., Madan A.K., et. al.: Higher production of IL-8 in visceral vs. subcutaneous adipose tissue. Implication of nonadipose cells in adipose tissue. Am J Physiol Endocrinol Metab 2004; 286: pp. E8-E13.
25. Bruun J.M., Lihn A.S., Pedersen S.B., et. al.: Monocyte chemoattractant protein-1 release is higher in visceral than subcutaneous human adipose tissue (AT): implication of macrophages resident in the AT. J Clin Endocrinol Metab 2005; 90: pp. 2282-2289.
26. Curat C.A., Wegner V., Sengenes C., et. al.: Macrophages in human visceral adipose tissue: increased accumulation in obesity and a source of resistin and visfatin. Diabetologia 2006; 49: pp. 744-747.
27. Suganami T., Nishida J., Ogawa Y.: A paracrine loop between adipocytes and macrophages aggravates inflammatory changes: role of free fatty acids and tumor necrosis factor alpha. Arterioscler Thromb Vasc Biol 2005; 25: pp. 2062-2068.
28. Bourlier V., Zakaroff-Girard A., Miranville A., et. al.: Remodeling phenotype of human subcutaneous adipose tissue macrophages. Circulation 2008; 117: pp. 806-815.
29. Fox C.S., Massaro J.M., Hoffmann U., et. al.: Abdominal visceral and subcutaneous adipose tissue compartments: association with metabolic risk factors in the Framingham Heart Study. Circulation 2007; 116: pp. 39-48.
30. Mahabadi A.A., Massaro J.M., Rosito G.A., et. al.: Association of pericardial fat, intrathoracic fat, and visceral abdominal fat with cardiovascular disease burden: the Framingham Heart Study. Eur Heart J 2009; 30: pp. 850-856.
31. Sarin S., Wenger C., Marwaha A., et. al.: Clinical significance of epicardial fat measured using cardiac multislice computed tomography. Am J Cardiol 2008; 102: pp. 767-771.
32. Nakamura T., Nagasaka S., Ishikawa S., et. al.: Clinical implication of serial leptin measurement in subjects with type 2 diabetes mellitus. Endocr J 2001; 48: pp. 87-94.
33. Kim M.K., Tanaka K., Kim M.J., et. al.: Comparison of epicardial, abdominal and regional fat compartments in response to weight loss. Nutr Metab Cardiovasc Dis 2009; 19: pp. 760-766.