
Rationale and Objectives
The aim of this study was to evaluate increased sampling intervals on cerebral dynamic perfusion computed tomographic (PCT) imaging calculated using software relying on the maximum slope model.
Materials and Methods
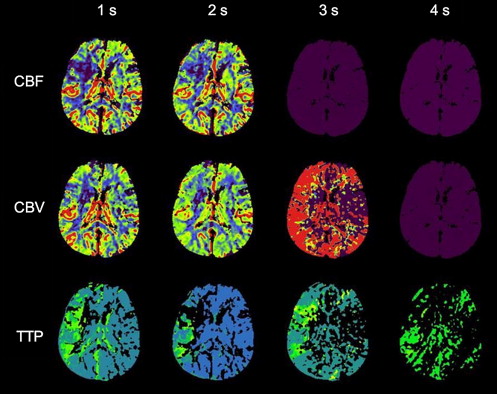
PCT data sets from 32 patients with suspected acute stroke were acquired with a sampling interval of 1 image/s. The PCT data sets were modified to simulate sampling intervals of 2, 3, and 4 seconds. Maps of cerebral blood flow (CBF), cerebral blood volume, and time to peak (TTP) were calculated using software relying on the maximum slope model. Parenchymal and vascular peak enhancement; absolute values of CBF, cerebral blood volume, and TTP in the nonischemic hemisphere; and ischemic area in the different perfusion maps were measured.
Results
Parenchymal peak enhancement of the nonischemic hemisphere was statistically significantly decreased in all simulated data sets with >1-second sampling intervals ( P < .001). Absolute CBF and TTP values in the nonischemic hemisphere were increased in all simulated data sets with >1-second sampling intervals ( P = .044–.001 and P = .008–.001, respectively). The ischemic area was significantly underestimated for CBF and TTP in all simulated data sets with >1-second sampling intervals ( P = .022–.005 and P = .019–.005, respectively).
Conclusions
Sampling intervals of >1 second on PCT imaging calculated using software relying on the maximum slope model significantly alter absolute CBF and TTP values and the size of ischemia in CBF and TTP. Thus, increasing the sampling interval on dynamic PCT imaging cannot be recommended in combination with this algorithm.
Computed tomographic (CT) imaging is still the method most widely available for imaging of acute stroke. In the past few years, perfusion CT (PCT) imaging has been increasingly used for the assessment of cerebral hemodynamics and has been implemented in multimodal CT stroke protocols .
On the basis of the calculation of different perfusion parameters from the dynamic data, PCT imaging enables the differentiation of tissue at risk from irreversibly damaged tissue and hence identifies the portion of potentially salvageable brain tissue . Thus, PCT imaging might be applicable for image-based therapy management in the future .
Get Radiology Tree app to read full this article<
Get Radiology Tree app to read full this article<
Materials and methods
Overview
Get Radiology Tree app to read full this article<
PCT Protocol
Get Radiology Tree app to read full this article<
Simulation of Increased Sampling Intervals
Get Radiology Tree app to read full this article<
PCT Postprocessing
Get Radiology Tree app to read full this article<
Qualitative Evaluation
Get Radiology Tree app to read full this article<
Quantitative Evaluation
Get Radiology Tree app to read full this article<
Get Radiology Tree app to read full this article<
Get Radiology Tree app to read full this article<
Get Radiology Tree app to read full this article<
Statistical Analysis
Get Radiology Tree app to read full this article<
Results
Qualitative Analysis
Get Radiology Tree app to read full this article<
Get Radiology Tree app to read full this article<
Quantitative Analysis
Get Radiology Tree app to read full this article<
Table 1
Parenchymal and Vascular Peak Enhancement for Different Sampling Intervals
Sampling Interval (s) Parameter 1 2 3 4 Peak enhancement, nonischemic hemisphere (HU) Mean ± SD 46.2 ± 2.8 43.7 ± 2.3 43.8 ± 2.3 42.7 ± 2.5 Median (range) 46.3 (37.9–51.5) 43.8 (37.6–49.5) 43.8 (38.1–49.9) 43.2 (37.1–48.5)P <.001 ∗ <.001 ∗ <.001 ∗ Peak enhancement, superior sagittal sinus (HU) Mean ± SD 542.0 ± 121.3 533.6 ± 134.8 536.7 ± 135.0 536.5 ± 134.3 Median (range) 557.6 (295.9–740.2) 548.2 (245.5–776.0) 542.5 (254.2–758.5) 552.5 (282.1–750.7)P .073 .379 .822
HU, Hounsfield units; SD, standard deviation.
Get Radiology Tree app to read full this article<
Get Radiology Tree app to read full this article<
Get Radiology Tree app to read full this article<
Table 2
Absolute Perfusion Values of the Nonischemic Hemisphere for Different Sampling Intervals
Sampling Interval (s) Perfusion Parameter 1 2 3 4 CBF (mL · 100 g −1 · min −1 )n 32 32 30 23 Mean ± SD 56.8 ± 4.3 58.3 ± 6.4 57.9 ± 6.5 60.4 ± 5.3 Median (range) 56.3 (49.4–73.7) 58.0 (38.4–76.9) 58.4 (29.7–70.4) 59.6 (51.7–73.3)P .030 ∗ .044 ∗ .001 ∗ CBV (mL · 100 g −1 )n 32 32 30 23 Mean ± SD 3.40 ± 0.25 3.47 ± 0.27 3.43 ± 0.47 3.73 ± 0.59 Median (range) 3.38 (3.01–4.36) 3.44 (2.97–4.29) 3.47 (1.37–4.38) 3.66 (2.49–5.80)P .089 .140 <.001 ∗ TTP (s)n 32 32 30 23 Mean ± SD 9.5 ± 2.4 10.3 ± 2.8 10.8 ± 2.8 12.8 ± 3.5 Median (range) 8.8 (6.6–16.6) 9.8 (6.7–19.6) 9.9 (6.0–18.3) 12.2 (4.0–24.0)P .008 ∗ .002 ∗ <.001 ∗
CBF, cerebral blood flow; CBV, cerebral blood volume; SD, standard deviation; TTP, time to peak.
Get Radiology Tree app to read full this article<
Get Radiology Tree app to read full this article<
Get Radiology Tree app to read full this article<
Table 3
Threshold-Based Ischemic Area for Different Sampling Intervals in Patients with Proven Cerebral Infarctions
Paired Sampling Intervals CBF < 25 mL · 100 g −1 · min −1 (cm 2 ) CBV < 2.0 mL · 100 g −1 (cm 2 ) TTP (Visual) (cm 2 )n 15 15 15 1 s Mean ± SD 21.7 ± 10.8 17.7 ± 10.4 32.2 ± 14.2 Median (range) 18.3 (9.1–41.5) 15.1 (5.0–39.3) 35.2 (7.9–54.9) 2 s Mean ± SD 19.4 ± 11.6 17.1 ± 10.7 28.4 ± 12.3 Median (range) 15.6 (6.4–46.8) 13.1 (5.4–41.1) 32.5 (7.8–43.3)P .022 ∗ .733 .005 ∗ n 14 14 13 1 s Mean ± SD 22.3 ± 11.0 18.0 ± 10.7 32.2 ± 13.8 Median (range) 18.7 (9.1–41.5) 16.7 (5.0 –39.3) 18.3 (6.5–36.1) 3 s Mean ± SD 18.9 ± 10.7 17.5 ± 10.9 25.4 ± 12.0 Median (range) 16.1 (6.5–40.7) 13.7 (6.1–40.8) 17.9 (6.6–32.6)P .005 ∗ .550 .019 ∗ n 8 10 7 1 s Mean ± SD 25.1 ± 10.2 18.4 ± 9.4 33.1 ± 11.3 Median (range) 26.4 (11.2–39.2) 35.2 (7.9–54.9) 32.8 (14.2–50.4) 4 s Mean ± SD 20.9 ± 8.4 18.6 ± 9.6 19.3 ± 4.5 Median (range) 21.2 (9.7–32.9) 27.3 (6.8–42.8) 18.5 (11.9–24.8)P .012 ∗ .959 .018 ∗
CBF, cerebral blood flow; CBV, cerebral blood volume; SD, standard deviation; TTP, time to peak.
Get Radiology Tree app to read full this article<
Get Radiology Tree app to read full this article<
Discussion
Get Radiology Tree app to read full this article<
Get Radiology Tree app to read full this article<
Impact of Sampling Interval on Visual Perfusion Map Quality
Get Radiology Tree app to read full this article<
Impact of Sampling Interval on Peak Enhancement and Absolute Perfusion Values
Get Radiology Tree app to read full this article<
Impact of Sampling Interval on the Size of the Ischemic Area
Get Radiology Tree app to read full this article<
Limitations of This Study
Get Radiology Tree app to read full this article<
Conclusions
Get Radiology Tree app to read full this article<
References
1. Srinivasan A., Goyal M., Al Azri F., et. al.: State-of-the-art imaging of acute stroke. Radiographics 2006; 26: pp. S75-S95.
2. Lovblad K.O., Baird A.E.: Actual diagnostic approach to the acute stroke patient. Eur Radiol 2006; 16: pp. 1253-1269.
3. Scharf J., Brockmann M.A., Daffertshofer M., et. al.: Improvement of sensitivity and interrater reliability to detect acute stroke by dynamic perfusion computed tomography and computed tomography angiography. J Comput Assist Tomogr 2006; 30: pp. 105-110.
4. Kloska S.P., Nabavi D.G., Gaus C., et. al.: Acute stroke assessment with CT: do we need multimodal evaluation?. Radiology 2004; 233: pp. 79-86.
5. Wintermark M., Flanders A.E., Velthuis B., et. al.: Perfusion-CT assessment of infarct core and penumbra: receiver operating characteristic curve analysis in 130 patients suspected of acute hemispheric stroke. Stroke 2006; 37: pp. 979-985.
6. Murphy B.D., Fox A.J., Lee D.H., et. al.: Identification of penumbra and infarct in acute ischemic stroke using computed tomography perfusion-derived blood flow and blood volume measurements. Stroke 2006; 37: pp. 1771-1777.
7. Sims J., Schwamm L.H.: The evolving role of acute stroke imaging in intravenous thrombolytic therapy: patient selection and outcomes assessment. Neuroimaging Clin N Am 2005; 15: pp. 421-440.
8. Schellinger P.D., Fiebach J.B., Hacke W.: Imaging-based decision making in thrombolytic therapy for ischemic stroke: present status. Stroke 2003; 34: pp. 575-583.
9. Brenner D.J., Hall E.J.: Computed tomography—an increasing source of radiation exposure. N Engl J Med 2007; 357: pp. 2277-2284.
10. Wintermark M., Maeder P., Verdun F.R., et. al.: Using 80 kVp versus 120 kVp in perfusion CT measurement of regional cerebral blood flow. AJNR Am J Neuroradiol 2000; 21: pp. 1881-1884.
11. Cohnen M., Wittsack H.J., Assadi S., et. al.: Radiation exposure of patients in comprehensive computed tomography of the head in acute stroke. AJNR Am J Neuroradiol 2006; 27: pp. 1741-1745.
12. Imanishi Y., Fukui A., Niimi H., et. al.: Radiation-induced temporary hair loss as a radiation damage only occurring in patients who had the combination of MDCT and DSA. Eur Radiol 2005; 15: pp. 41-46.
13. Wintermark M., Smith W.S., Ko N.U., et. al.: Dynamic perfusion CT: optimizing the temporal resolution and contrast volume for calculation of perfusion CT parameters in stroke patients. AJNR Am J Neuroradiol 2004; 25: pp. 720-729.
14. Wiesmann M., Berg S., Bohner G., et. al.: Dose reduction in dynamic perfusion CT of the brain: effects of the scan frequency on measurements of cerebral blood flow, cerebral blood volume, and mean transit time. Eur Radiol 2008; 18: pp. 2967-2974.
15. Kämena A., Streitparth F., Grieser C., et. al.: Dynamic perfusion CT: optimizing the temporal resolution for the calculation of perfusion CT parameters in stroke patients. Eur J Radiol 2007; 64: pp. 111-118.
16. Wintermark M., Maeder P., Thiran J.P., et. al.: Quantitative assessment of regional cerebral blood flows by perfusion CT studies at low injection rates: a critical review of the underlying theoretical models. Eur Radiol 2001; 11: pp. 1220-1230.
17. Klotz E., König M.: Perfusion measurements of the brain: using dynamic CT for the quantitative assessment of cerebral ischemia in acute stroke. Eur J Radiol 1999; 30: pp. 170-184.
18. Wintermark M., Sesay M., Barbier E., et. al.: Comparative overview of brain perfusion imaging techniques. Stroke 2005; 36: pp. 83-99.
19. König M., Klotz E., Luka B., et. al.: Perfusion CT of the brain: diagnostic approach for early detection of ischemic stroke. Radiology 1998; 209: pp. 85-93.
20. Schaefer P.W., Roccatagliata L., Ledezma C., et. al.: First-pass quantitative CT perfusion identifies thresholds for salvageable penumbra in acute stroke patients treated with intra-arterial therapy. AJNR Am J Neuroradiol 2006; 27: pp. 20-25.
21. Kloska S.P., Fischer T., Nabavi D.G., et. al.: Comparison of different iodine concentration contrast media in perfusion computed tomography of the brain: is high iodine concentration useful?. Invest Radiol 2007; 42: pp. 564-568.