
Rationale and Objectives
We aimed to investigate the incremental prognostic value of apparent diffusion coefficient (ADC) histogram analysis in patients with head and neck squamous cell carcinoma (HNSCC) and integrate it into a multivariate prognostic model.
Materials and Methods
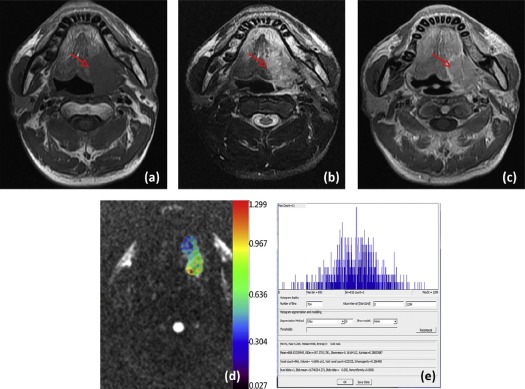
A retrospective review of magnetic resonance imaging findings was conducted in patients with pathologically confirmed HNSCC between June 2012 and December 2015. For each tumor, six histogram parameters were derived: the 10th, 50th, and 90th percentiles of ADC (ADC 10 , ADC 50 , and ADC 90 ); mean ADC values (ADC mean ); kurtosis; and skewness. The clinical variables included age, sex, smoking status, tumor volume, and tumor node metastasis stage. The association of these histogram and clinical variables with overall survival (OS) was determined. Further validation of the histogram parameters as independent biomarkers was performed using multivariate Cox proportional hazard models combined with clinical variables, which was compared to the clinical model. Models were assessed with C index and receiver operating characteristic curve analyses for the 12- and 36-month OS.
Results
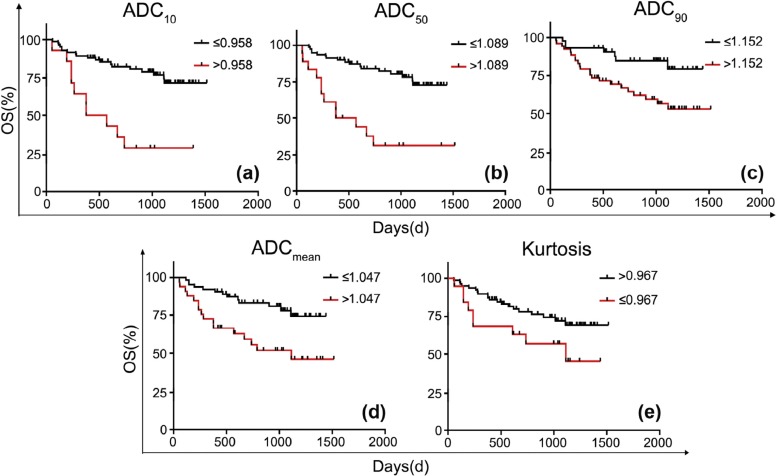
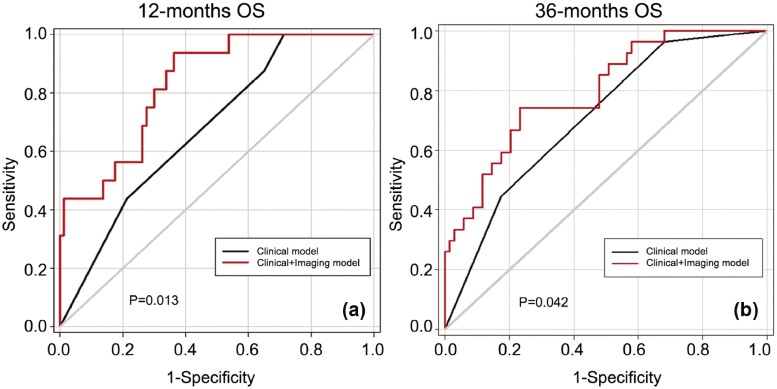
Ninety-six patients were eligible for analysis. Median follow-up was 877 days (range, 54–1516 days). A total of 29 patients died during follow-up (30%). Patients with higher ADC values (ADC 10 > 0.958 × 10 −3 mm 2 /s, ADC 50 > 1.089 × 10 −3 mm 2 /s, ADC 90 > 1.152 × 10 −3 mm 2 /s, ADC mean > 1.047 × 10 −3 mm 2 /s) and lower kurtosis (≤0.967) were significant predictors of poor OS ( P < .100 for all). After adjusting for sex and tumor node metastasis stage, the ADC 90 and kurtosis are both significant predictors of OS with hazard ratios = 1.00 (95% confidence interval: 1.001–1.004) and 0.58 (95% confidence interval: 0.37–0.90), respectively. By adding the ADC parameters into the clinical model, the C index and diagnostic accuracies for the 12- and 36-month OS showed significant improvement.
Conclusions
ADC histogram analysis has incremental prognostic value in patients with HNSCC and increases the performance of a multivariable prognostic model in addition to clinical variables.
Introduction
Head and neck squamous cell carcinomas (HNSCC) represent over 90% of malignant head and neck tumors in adults . In general, tumor node metastasis (TNM) stage is the most important prognostic factor. However, there is substantial evidence to show that HNSCCs with the same stage have vastly different responses to chemoradiotherapy (CRT) and postoperative survival. These differences can be explained by biological and molecular variations and genetic predispositions . In addition, the presence of human papilloma virus (HPV) has been identified as a prognostic factor in HNSCC. In the oropharynx, HPV- and/or p16-positive (HPV+) HNSCC has a better prognosis than HPV- and/or p16-negative (HPV−) HNSCC, whereas in the oral cavity and in other head and neck sites, reported results are contradictory . The ability to identify these factors would enable us to prospectively select patients for treatment adaptation. Functional imaging techniques show great promise. Diffusion-weighted imaging (DWI) with apparent diffusion coefficient (ADC) maps provide a quantitative index of water diffusivity for each voxel, allowing visualization of molecular diffusion in tissues and providing indirect information on tissue microstructure . Many studies have demonstrated the prognostic value of pretreatment ADC in patients with HNSCC . However, most of them were mainly measured upon several slices of region of interest which may not represent the full spectrum of histology within a tumor. The approach of ADC histogram analysis using whole tumor region of interest yields diffusion metrics with additional information on the distribution of ADCs and the heterogeneity of water diffusivity within tissue. This method is capable of differentiating brain tumors and evaluating prognostic value . Tozer found that whole tumor ADC histograms may predict low-grade glioma subtype between astrocytoma and oligodendroglioma; Choi reported that ADC histogram analysis had incremental prognostic value over MGMT promoter methylation status in patients with glioblastoma. In HNSCCs, Ahn et al. reported that pretreatment ADC histogram analysis in HNSCCs can be useful in differentiating histologic tumor grades .
To our best knowledge, there have been no reports of histogram analysis of ADC maps in predicting HNSCC outcome. Therefore, the purpose of this study was to investigate the prognostic value of ADC histogram analysis in HNSCC and develop a prognostic model incorporating the clinical and ADC histogram parameters.
Materials and Methods
Patients and Clinical Data
Get Radiology Tree app to read full this article<
Get Radiology Tree app to read full this article<
MRI Acquisition
Get Radiology Tree app to read full this article<
Image Analysis
Get Radiology Tree app to read full this article<
Get Radiology Tree app to read full this article<
Statistical Analysis
Get Radiology Tree app to read full this article<
Get Radiology Tree app to read full this article<
Get Radiology Tree app to read full this article<
Results
Get Radiology Tree app to read full this article<
TABLE 1
Patient Characteristics
Variable_N_ (%) Association with OS ( P Value) Sex Male 65 (68%) Female 31 (32%).000 Age (y) \* ≤63 72 (75%) >63 24 (25%) .412 AJCC stage † I–II 30 (31%) III–IV 66 (69%).000 Smoking status Yes 38 (40%) No 58 (60%) .112 Tumor volume ‡ ≤3.6 cm 3 67 (70%) >3.6 cm 3 29 (30%).000 Tumor site Oral cavity 88 (92%) Oropharynx 8 (8%) .743 Tumor treatment 1 vs 2 .515 2 vs 3 .607 1 vs 3 § .999
AJCC, American Joint Committee on Cancer; OS, overall survival.
P values in bold denote statistical significance.
Get Radiology Tree app to read full this article<
Get Radiology Tree app to read full this article<
Get Radiology Tree app to read full this article<
Get Radiology Tree app to read full this article<
Get Radiology Tree app to read full this article<
Get Radiology Tree app to read full this article<
Get Radiology Tree app to read full this article<
TABLE 2
Two Prediction Models for OS
Clinical Model Clinical-imaging Model HR 95% CI_P_ Value HR 95% CI_P_ Value Kurtosis / / / 0.58 0.37–0.900.016 ADC 90 / / / 1.00 1.00–1.000.001 Sex 0.45 0.21–0.950.037 0.37 0.18–0.820.003 TNM Stage 7.45 1.70–31.520.006 8.43 1.98–35.810.013
ADC, apparent diffusion coefficient; CI, confidence interval; HR, hazard ratio; OS, overall survival; TNM, tumor node metastasis.
P values in bold denote statistical significance.
Get Radiology Tree app to read full this article<
Get Radiology Tree app to read full this article<
Get Radiology Tree app to read full this article<
Get Radiology Tree app to read full this article<
Discussion
Get Radiology Tree app to read full this article<
Get Radiology Tree app to read full this article<
Get Radiology Tree app to read full this article<
Get Radiology Tree app to read full this article<
Get Radiology Tree app to read full this article<
Get Radiology Tree app to read full this article<
Acknowledgments
Get Radiology Tree app to read full this article<
Get Radiology Tree app to read full this article<
References
1. Marur S., Forastiere A.A.: Head and neck squamous cell carcinoma: update on epidemiology, diagnosis, and treatment. Mayo Clin Proc 2016; 91: pp. 386-396.
2. Bentzen S.M., Gregoire V.: Molecular imaging-based dose painting: a novel paradigm for radiation therapy prescription. Semin Radiat Oncol 2011; 21: pp. 101-110.
3. Salazar C.R., Smith R.V., Garg M.K., et. al.: Human papillomavirus-associated head and neck squamous cell carcinoma survival: a comparison by tumor site and initial treatment. Head Neck Pathol 2014; 8: pp. 77-87.
4. Le Bihan D., Breton E., Lallemand D., et. al.: Separation of diffusion and perfusion in intravoxel incoherent motion MR imaging. Radiology 1988; 168: pp. 497-505.
5. Xu J.F., Wu X.W., Wang W.Q., et. al.: Value of diffusion-weighted magnetic resonance imaging on the follow-up of nasopharyngeal carcinoma after radiotherapy. J Xray Sci Technol 2014; 22: pp. 605-612.
6. Hatakenaka M., Nakamura K., Yabuuchi H., et. al.: Pretreatment apparent diffusion coefficient of the primary lesion correlates with local failure in head-and-neck cancer treated with chemoradiotherapy or radiotherapy. Int J Radiat Oncol Biol Phys 2011; 81: pp. 339-345.
7. Hatakenaka M., Shioyama Y., Nakamura K., et. al.: Apparent diffusion coefficient calculated with relatively high B-values correlates with local failure of head and neck squamous cell carcinoma treated with radiotherapy. AJNR Am J Neuroradiol 2011; 32: pp. 1904-1910.
8. Tozer D.J., Jager H.R., Danchaivijitr N., et. al.: Apparent diffusion coefficient histograms may predict low-grade glioma subtype. NMR Biomed 2007; 20: pp. 49-57.
9. Choi Y.S., Ahn S.S., Kim D.W., et. al.: Incremental prognostic value of ADC histogram analysis over MGMT promoter methylation status in patients with glioblastoma. Radiology 2016; 281: pp. 175-184.
10. Ahn S.J., Choi S.H., Kim Y.J., et. al.: Histogram analysis of apparent diffusion coefficient map of standard and high B-value diffusion MR imaging in head and neck squamous cell carcinoma: a correlation study with histological grade. Acad Radiol 2012; 19: pp. 1233-1240.
11. Newson R.B.: Comparing the predictive powers of survival models using Harrell’s C or Somers’ D. Stata J 2010; 10: pp. 339-358.
12. Lambrecht M., Van Calster B., Vandecaveye V., et. al.: Integrating pretreatment diffusion weighted MRI into a multivariable prognostic model for head and neck squamous cell carcinoma. Radiother Oncol 2014; 110: pp. 429-434.
13. Noij D.P., Pouwels P.J., Ljumanovic R., et. al.: Predictive value of diffusion-weighted imaging without and with including contrast-enhanced magnetic resonance imaging in image analysis of head and neck squamous cell carcinoma. Eur J Radiol 2015; 84: pp. 108-116.
14. Suo S., Zhang K., Cao M., et. al.: Characterization of Breast Masses as Benign or Malignant at 3.0t Mri with Whole-Lesion Histogram Analysis of the Apparent Diffusion Coefficient. J Magn Reson Imaging 2016; 43: pp. 894-902.
15. Xue H., Ren C., Yang J., et. al.: Histogram analysis of apparent diffusion coefficient for the assessment of local aggressiveness of cervical cancer. Arch Gynecol Obstet 2014; 290: pp. 341-348.
16. Donati O.F., Mazaheri Y., Afaq A., et. al.: Prostate cancer aggressiveness: assessment with whole-lesion histogram analysis of the apparent diffusion coefficient. Radiology 2014; 271: pp. 143-152.
17. Tsuchiya N., Doai M., Usuda K., et. al.: Non-small cell lung cancer: whole-lesion histogram analysis of the apparent diffusion coefficient for assessment of tumor grade, lymphovascular invasion and pleural invasion. PLoS ONE 2017; 12: e0172433
18. Eltzschig H.K., Carmeliet P.: Hypoxia and inflammation. N Engl J Med 2011; 364: pp. 656-665.
19. Just N.: Improving tumour heterogeneity MRI assessment with histograms. Br J Cancer 2014; 111: pp. 2205-2213.
20. Suo S.T., Chen X.X., Fan Y., et. al.: Histogram analysis of apparent diffusion coefficient at 3.0 T in urinary bladder lesions: correlation with pathologic findings. Acad Radiol 2014; 21: pp. 1027-1034.
21. Zhang Y.D., Wang Q., Wu C.J., et. al.: The histogram analysis of diffusion-weighted intravoxel incoherent motion (IVIM) imaging for differentiating the Gleason grade of prostate cancer. Eur Radiol 2015; 25: pp. 994-1004.
22. Xu X.Q., Hu H., Su G.Y., et. al.: Utility of histogram analysis of ADC maps for differentiating orbital tumors. Diagn Interv Radiol 2016; 22: pp. 161-167.