
Rationale and Objectives
Before using a new diagnostic imaging device regularly in a clinic, it should be studied using patients and radiologists. Often such studies report diagnostic performance in terms of sensitivity, specificity, area under the receiver operating characteristic curve (AUC), or differences thereof. In this report we look at how these studies differ from actual future clinical practice and how those differences may affect reported performance measures.
Materials and Methods
We review signal detection (receiver operating characteristic) theory and decision theory. We compare diagnostic measures from several published studies in medical imaging and examine how they relate to theory and each other.
Results
We see that clinical decisions can be modeled using signal detection and decision theories. Sensitivity and specificity are inextricably linked with clinical factors, such as prevalence and costs. Imaging devices are used in many different ways in clinical practice, so that sensitivities, specificities, and AUCs measured in studies of new diagnostic imaging devices will differ from those in actual future clinical use.
Conclusions
Measured sensitivities, specificities, and the directions of changes thereof are not necessarily consistent or reproducible across studies of new diagnostic devices. A change in the AUC, which should be independent of clinical costs or prevalence, is a consistent measure across similar studies, and a positive change in AUC is indicative of additional diagnostic information that will be available to radiologists in a future clinical environment.
New diagnostic imaging devices are typically tested by means of one or more performance studies before they are regularly used in a clinical environment. The kind of study performed may vary from device to device, but if the device is substantially different from other devices previously used in the clinic, then we should perform a study that demonstrates the clinical efficacy of the device. As stated by Fryback and Thornbury , “Diagnostic accuracy efficacy is not simply a function of the image. It is a joint function of the images and of an observer, such as a radiologist.” Therefore, these studies should measure the ability of radiologists to use the device to differentiate actual patients who have a condition or disease from those who do not. This study may have only one arm where the radiologists use only the new device to determine disease or condition. This study may have two arms and compare the diagnostic performance of the radiologists when using standard diagnostics against their performance when using the new imaging device in addition to or instead of the standard diagnostics. In both study arms, we can collect ratings from the radiologists that indicate their confidence in the presence of disease for each patient. We may also have the radiologists recommend a course of action for each patient given the diagnostic data.
As with all studies, we would like to infer as much as possible, in particular how the device will be used when making actual clinical decisions. We would like to know at what sensitivity, specificity, or recall rate it will be used for different possible courses of action in future clinical patient management. We could assume that the sensitivity or specificity measured in the study will be the same as that in future clinical practice. However, as we will see, theory and experience tell us that this is not a correct assumption. We cannot expect that sensitivities, specificities, or differences thereof as measured in studies of new devices will be consistent with future clinical practice, or even consistent between the studies themselves. Because clinical utility depends on sensitivity and specificity, we should not expect that we can estimate the clinical utility of the new device given the results of the study. Unfortunately, making predictions, particularly about the use of diagnostics in future medical practice, is difficult.
Get Radiology Tree app to read full this article<
Get Radiology Tree app to read full this article<
Methods and theory
Signal Detection and ROC Theory
Get Radiology Tree app to read full this article<
Get Radiology Tree app to read full this article<
Get Radiology Tree app to read full this article<
Get Radiology Tree app to read full this article<
Get Radiology Tree app to read full this article<
Get Radiology Tree app to read full this article<
Get Radiology Tree app to read full this article<
Get Radiology Tree app to read full this article<
Get Radiology Tree app to read full this article<
Decision Theory
Get Radiology Tree app to read full this article<
Get Radiology Tree app to read full this article<
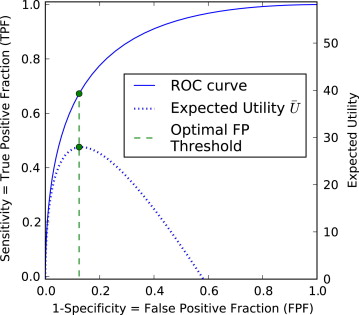
U¯¯¯=U0+(UTP⋅TPF+UFN⋅FNF)π+(UFP⋅FPF+UTN⋅TNF)(1−π) U
¯
=
U
0
+
(
U
T
P
·
TPF
+
U
F
N
·
FNF
)
π
+
(
U
F
P
·
FPF
+
U
T
N
·
TNF
)
(
1
−
π
)
where π is the prevalence of the disease in the population, and the U values are utilities for each kind of decision (ie, benefits and costs expressed in commensurate units). Because FNF = 1 − TPF and TNF = 1 − FPF, the second and third terms of Equation 1 are often combined, and the fourth and fifth terms are combined, and a simplified version of the equation is sometimes used:
U¯¯¯=−C0+BD⋅TPF⋅π−CN⋅FPF⋅(1−π) U
¯
=
−
C
0
+
B
D
·
TPF
·
π
−
C
N
·
FPF
·
(
1
−
π
)
The total average utility (benefit minus cost) is U¯¯¯ U
¯ . C__0 is the overhead cost, including the average cost of performing the diagnostic test on a patient. B__D is the relative benefit of identifying a diseased patient as diseased rather than nondiseased. C__N is the relative cost of misidentifying nondiseased patients as diseased rather than nondiseased, which would include the cost of overtreatment. For a successful diagnostic program, the total average utility should be positive if all costs and benefits are positive and taken into account.
Get Radiology Tree app to read full this article<
Get Radiology Tree app to read full this article<
Get Radiology Tree app to read full this article<
Get Radiology Tree app to read full this article<
Get Radiology Tree app to read full this article<
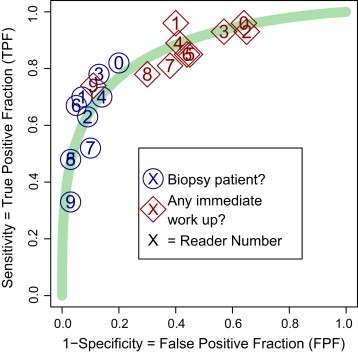
Example: A Study of the Use of Mammography by Radiologists
Get Radiology Tree app to read full this article<
Get Radiology Tree app to read full this article<
Get Radiology Tree app to read full this article<
Get Radiology Tree app to read full this article<
Get Radiology Tree app to read full this article<
Get Radiology Tree app to read full this article<
Get Radiology Tree app to read full this article<
Get Radiology Tree app to read full this article<
Conclusions
Get Radiology Tree app to read full this article<
Results: Examples of how studies of new diagnostic imaging devices differ from future clinical practice
Get Radiology Tree app to read full this article<
Get Radiology Tree app to read full this article<
Decisions Made with Imaging Diagnostics
Get Radiology Tree app to read full this article<
Get Radiology Tree app to read full this article<
Get Radiology Tree app to read full this article<
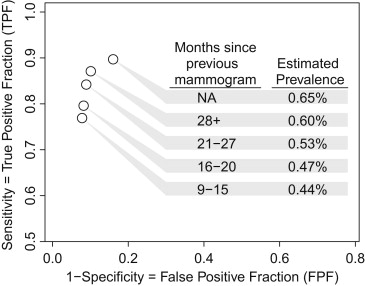
Study Prevalence
Get Radiology Tree app to read full this article<
Get Radiology Tree app to read full this article<
Get Radiology Tree app to read full this article<
Radiologists Blinded to Patient Attributes
Get Radiology Tree app to read full this article<
Get Radiology Tree app to read full this article<
Get Radiology Tree app to read full this article<
Repeated Use of a Diagnostic Modality
Get Radiology Tree app to read full this article<
Get Radiology Tree app to read full this article<
Get Radiology Tree app to read full this article<
Get Radiology Tree app to read full this article<
Get Radiology Tree app to read full this article<
Get Radiology Tree app to read full this article<
Perceived Costs in a Study
Get Radiology Tree app to read full this article<
Get Radiology Tree app to read full this article<
Get Radiology Tree app to read full this article<
Differing Experience with Device
Get Radiology Tree app to read full this article<
Get Radiology Tree app to read full this article<
Get Radiology Tree app to read full this article<
Get Radiology Tree app to read full this article<
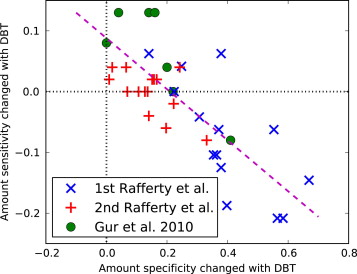
Table 1
Mean Recall True-Positive Fraction (TPF), False-Positive Fraction (FPF), and Area Under the Receiver Operating Characteristic Curve (AUC) from Three Studies of the Hologic Breast Tomosynthesis (DBT) Unit
Study TPF FPF AUC DM DM+DBT Change DM DM+DBT Change DM DM+DBT Change Rafferty et al, 1 87 80 −7 55 17 −38 82 89 +7 (4–11) Rafferty et al, 2 85 86 +1 49 30 −19 83 90 +7 (4–10) Gur et al 83 91 +8 25 10 −15 89 96 +7 (2–12)
Every study examined the diagnostic performance of digital mammography (DM) alone and DM plus DBT. The table presents the values and differences as percentages. Values in parentheses are approximate 95% confidence intervals. The data are from Figures 2 and 3 of Rafferty et al and Table 1 of Gur et al .
Get Radiology Tree app to read full this article<
Get Radiology Tree app to read full this article<
Get Radiology Tree app to read full this article<
Get Radiology Tree app to read full this article<
Discussion
Get Radiology Tree app to read full this article<
Get Radiology Tree app to read full this article<
Get Radiology Tree app to read full this article<
References
1. Fryback D.G., Thornbury J.R.: The efficacy of diagnostic imaging. Med Decis Making 1991; 11: pp. 88-94.
2. Metz C.E.: Basic principles of ROC analysis. Semin Nucl Med 1978; 7: pp. 283-298.
3. Samuelson F.W., Gallas B.D., Myers K.J., et. al.: The importance of ROC data. Acad Radiol 2011; 18: pp. 257-258. and reply 259–261
4. Obuchowski N.A.: Receiver operating characteristic curves and and their use in radiology. Radiology 2003; 229: pp. 3-8.
5. Swets J.A.: The relative operating characteristic in psychology. Science 1973; 182: pp. 1000.
6. Swets J.A.: Measuring the accuracy of diagnostic systems. Science 1988; 240: pp. 1285-1293.
7. Green D.M., Swets J.A.: Signal Detection Theory and Psychophysics.1966.John Wiley & SonsNew York
8. Egan J.P.: Signal Detection Theory and ROC Analysis.1975.Academic PressNew York
9. Zweig M.H., Campbell G.: Receiver-operating characteristic (ROC) plots: A fundamental evaluation tool in clinical medicine. Clin Chem 1993; 39: pp. 561-577.
10. Barrett H.H., Abbey C.K., Clarkson E.: Objective assessment of image quality. III. ROC metrics, ideal observers, and likelihood-generating functions. J Opt Soc Am 1998; 15: pp. 1520-1535.
11. Shen F., Clarkson E.: Using Fisher information to approximate ideal observer performance on detection tasks for lumpy-background images. J Opt Soc Am 2006; 23: pp. 2406-2414.
12. Wagner R.F., Metz C.E., Campbell G.: Assessment of medical imaging systems and computer aids: A tutorial review. Acad Radiol 2007; 14: pp. 723-748.
13. Swets J.A., Tanner W.P., Birdsall T.G.: Decision processes in perception. Psychol Rev 1961; 68: pp. 301-340.
14. Tversky A., Kahneman D.: Advances in prospect theory: Cumulative representation of uncertainty. J Risk Uncertainty 1992; 5: pp. 297-323.
15. Maddox W.T., Dodd J.L.: On the relation between base-rate and cost-benefit learning in simulated medical diagnosis. J Exp Psychol Learning Memory Cogn 2001; 27: pp. 1367-1384.
16. Wagner R.F., Beam C.A., Beiden S.V.: Reader variability in mammography and its implications for expected utility over the population of readers and cases. Med Decis Making 2004; 24: pp. 561-572.
17. Reyna V.: A theory of medical decision making and health: fuzzy trace theory. Med Decis Making 2008; 28: pp. 850-865.
18. Abbey C.K., Eckstein M.P., Boone J.M.: An equivalent relative utility metric for evaluating screening mammography. Med Decis Making 2010; 30: pp. 113-122.
19. Swets J.A.: Form of empirical ROCs in discrimination and diagnostic tasks: Implications for theory and measurement of performance. Psychol Bull 1986; 99: pp. 181-198.
20. Tanner W.P., Swets J.A.: A decision-making theory of visual detection. Psychol Rev 1954; 61: pp. 401-409.
21. Egan J.P., Schulman A.I., Greenberg G.Z.: Operating characteristics determined by binary decisions and by ratings. J Acoust Soc Am 1959; 31: pp. 768-773.
22. Lee W., Janke M.: Categorizing externally distributed stimulus samples for unequal molar probabilities. Psychol Rep 1965; 17: pp. 79-90.
23. Pitz G.F., Reinhold H.: Payoff effects in sequential decision-making. J Exp Psychol 1968; 77: pp. 249-257.
24. Ulehla Z.J.: Optimality of perceptual decision criteria. J Exp Psychol 1966; 71: pp. 564-569.
25. Maddox W.T., Dodd J.L.: Toward a unified theory of decision criterion learning in perceptual categorization. J Exp Anal Behav 2002; 78: pp. 567-595.
26. Wolfe J.M., Wert M.J.V.: Varying target prevalence reveals two, dissociable decision criteria in visual search. Curr Biol 2010; 20: pp. 121-124.
27. Wolfe J.M., Horowitz T.S., Kenner N.M.: Rare items often missed in visual searches. Nature 2005; 435: pp. 439-440.
28. Wolfe J.M., Horowitz T.S., Wert M.J.V., et. al.: Low target prevalence is a stubborn source of errors in visual search tasks. Exp Psychol 2007; 136: pp. 623-638.
29. Elmore J.G., Wells C.K., Lee C.H., et. al.: Variability in radiologists’ interpretations of mammograms. N Engl J Med 1994; 331: pp. 1493-1499.
30. D’Orsi C.J., Swets D.A.: Variability in the interpretation of mammograms. N Engl J Med 1995; 332: pp. 1172.
31. Gallas B.D., Chan H.-P., D’Orsi C.J., et. al.: Evaluating imaging and computer-aided detection and diagnosis devices at the FDA. Acad Radiol 2012; 19: pp. 463-477.
32. Gur D., Rockette H.E., Warfel T., et. al.: From the laboratory to the clinic: the prevalence effect. Acad Radiol 2003; 10: pp. 1324-1326.
33. Gur D., Rockette H.E., Armfield D.R., et. al.: Prevalence effect in a laboratory environment. Radiology 2003; 228: pp. 10-14.
34. Rafferty E.A., Park J.M., Philpotts L.E., et. al.: Assessing radiologist performance using combined digital mammography and breast tomosynthesis compared with digital mammography alone: results of a multicenter, multireader trial. Radiology 2012; 266: pp. 104-113.
35. Gur D., Abrams G.S., Chough D.M., et. al.: Digital breast tomosynthesis: observer performance study. Am J Roentgenol 2009; 193: pp. 586-591.
36. Gur D., Bandos A.I., Fuhrman C.R., et. al.: The prevalence effect in a laboratory environment: Changing the confidence ratings. Acad Radiol 2007; 14: pp. 49-53.
37. Egglin T.K.P., Feinstein A.R.: Context bias, a problem in diagnostic radiology. JAMA 1996; 276: pp. 1752-1755.
38. Evans K.K., Tambouret R.H., Evered A., et. al.: Prevalence of abnormalities influences cytologists’ error rates in screening for cervical cancer. Arch Pathol Lab Med 2011; 135: pp. 1557-1560.
39. Rosenberg R.D., Yankaskas B.C., Abraham L.A., et. al.: Performance benchmarks for screening mammography. Radiology 2006; 241: pp. 55-66.
40. Sickles E.A., Miglioretti D.L., Ballard-Barbash R., et. al.: Performance benchmarks for diagnostic mammography. Radiology 2005; 235: pp. 775-790.
41. Yankaskas B.C., Taplin S.H., Ichikawa L., et. al.: Association between mammography timing and measures of screening performance in the united states. Radiology 2005; 234: pp. 363-373.
42. Breast Cancer Surveillance Consortium, Breast Cancer Surveillance Consortium, 2008. URL: http://breastscreening.cancer.gov .
43. Gur D., Bandos A.I., Cohen C.S., et. al.: The laboratory effect: comparing radiologists performance and variability during prospective clinical and laboratory mammography interpretations. Radiology 2008; 249: pp. 47-53.
44. The National Lung Screening Trial Research Team: Reduced lung-cancer mortality with low-dose computed tomographic screening. N Engl J Med 2011; 365: pp. 395-409.
45. Gur D., Wallace L.P., Klym A.H., et. al.: Trends in recall, biopsy, and positive biopsy rates for screening mammography in an academic practice. Radiology 2005; 235: pp. 396-401.
46. Dean J.C., Ilvento C.C.: Improved cancer detection using computer-aided detection with diagnostic and screening mammography: prospective study of 104 cancers. AJR Am J Roentgenol 2006; 187: pp. 20-28.
47. Giger M.L., Chan H.-P., Boone J.: Anniversary report: History and status of CAD and quantitative image analysis: the role of medical physics and AAPM. Med Physics 2008; 35: pp. 5799-5820.
48. Gur D., Sumkin J.H., Rockette H.E., et. al.: Changes in breast cancer detection and mammography recall rates after the introduction of a computer-aided detection system. J Natl Cancer Inst 2003; 96: pp. 185-190.
49. Gur D., Bandos A.I., Rockette H.E., et. al.: Is an ROC-type response truly always better than a binary response in observer performance studies?. Acad Radiol 2010; 17: pp. 639-645.