
Rationale and Objectives
Emphysema is characterized by lung tissue destruction and trapped gas. On computed tomographic (CT) images, this may be expressed by widespread areas with high specific gas volume (SV g ). SV g is highly sensitive to very low attenuation values, which frequently occur in the CT images of patients with severe emphysema. The purpose of the present work was to study if and how different reconstruction settings and different scanners significantly influence SV g distribution, particularly in the very low attenuation range.
Materials and Methods
Two sets of CT images taken from two different CT scanners at two different lung volumes in 10 healthy volunteers and 18 subjects with severe emphysema were analyzed. Images were reconstructed using two different settings of reconstruction parameters: (1) thin slice thickness and sharp filter and (2) thick slice thickness and smooth filter. For each set of images, average values of SV g and their variation (ΔSV g ) from total lung capacity to residual volume were calculated in the whole lung.
Results
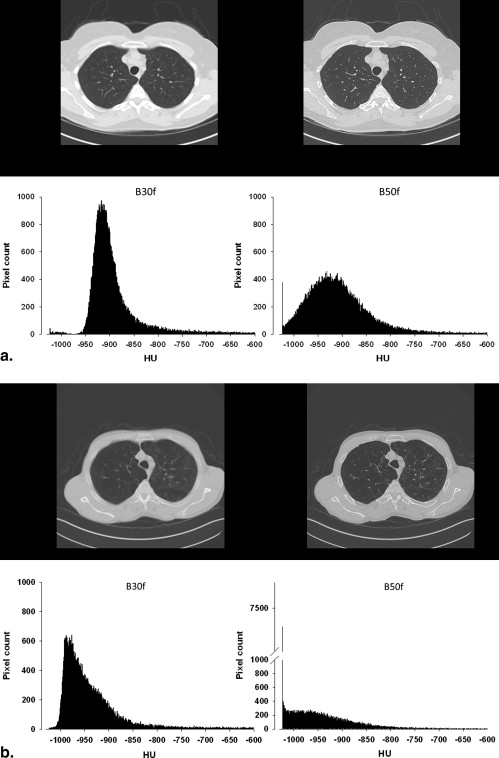
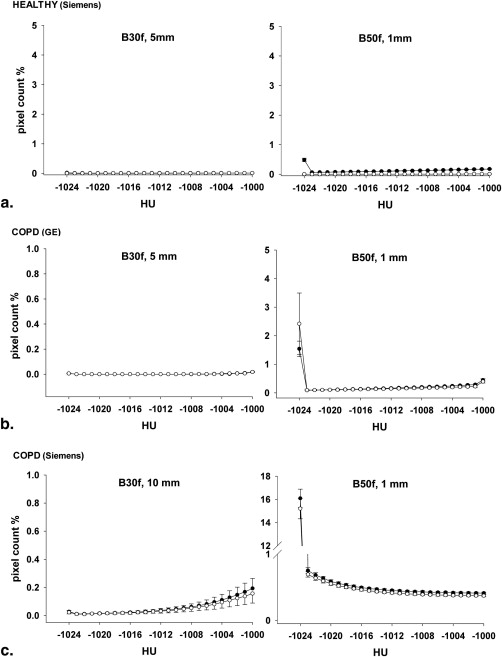
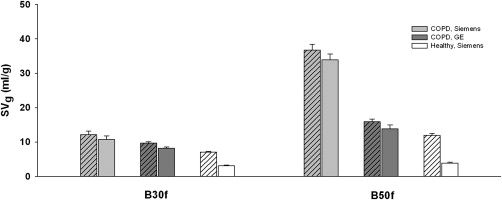
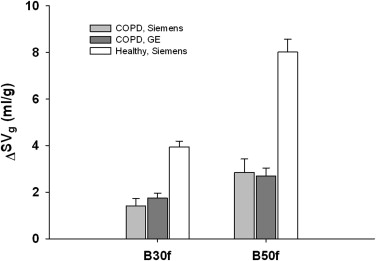
Very low attenuation values are always present in CT images when reconstructed with thin slice thickness and a sharp filter and in very large numbers in patients with severe emphysema. SV g values were in general significantly higher in patients with emphysema than in healthy subjects, at both total lung capacity and residual volume ( P < .001), and were significantly influenced by the reconstruction filter ( P < .001) and CT scanner ( P < .001). ΔSV g was lower in patients with emphysema than in healthy subjects ( P < .001) and was significantly affected by the reconstruction setting but not by the CT scanner.
Conclusions
The disproportionate effect of low-attenuation pixels on SV g likely causes overestimation of the severity of emphysema and trapped gas. This can be significantly reduced, however, by using thick slices and a smooth filter for image reconstruction. ΔSV g is generally robust for quantifying the functional impairment of the lung in severe emphysema.
Emphysema is characterized by the destruction of lung tissue in the distal airspaces. This is visualized by areas of abnormally low attenuation on computed tomographic (CT) images , whose pattern and distribution vary widely from one patient to another.
Coxson et al proposed a simple method to convert lung density into specific gas volume (SV g ), which is the volume of gas per gram of lung tissue. SV g can be suitably used to study emphysematous lungs on a regional basis and has a significant advantage in identifying trapped gas. Recently, we showed in a pig model of regional airway obstruction that SV g determined at different lung volumes provides a useful method for clearly identifying and quantifying the extent and severity of trapped gas . These methods and findings have important potential clinical implications for the assessment of human subjects undergoing lung volume reduction surgery or minimally invasive interventions such as transbronchial stents or endobronchial lung volume reduction .
Get Radiology Tree app to read full this article<
Open full size image
Figure 1
Relationship between Hounsfield units (HU) and corresponding value of specific gas volume (SV g ) for very low attenuation values, where −1024 HU represents zero x-ray attenuation corresponding to an infinite value of SV g (division by zero in equation (2), see text). Clearly, low-attenuation voxels have disproportionately high SV g .
Get Radiology Tree app to read full this article<
Get Radiology Tree app to read full this article<
Materials and methods
Subjects and Specimens
Get Radiology Tree app to read full this article<
CT Imaging
Get Radiology Tree app to read full this article<
Get Radiology Tree app to read full this article<
Get Radiology Tree app to read full this article<
CT Image Analysis
Get Radiology Tree app to read full this article<
Get Radiology Tree app to read full this article<
SVg=specificvolume(tissue&gas)−specificvolume(tissue), SV
g
=
specific
volume
(
tissue
&
gas
)
−
specific
volume
(
tissue
)
,
where specific volume (milliliters per gram) is the inverse of density (grams per milliliter). The specific volume of the lung (tissue and gas) was measured from the CT image as
SV(tissue&gas)(mL/g)=1024HU(mg/mL)+1024. SV
(
tissue
&
gas
)
(
mL
/
g
)
=
1024
HU
(
mg
/
mL
)
+
1024
.
On the basis of existing literature , the specific volume of tissue was assumed to be
SVtissue=1/1.065mL/g. SV
tissue
=
1
/
1.065
mL
/
g
.
In equation (2) , HU is the CT raw data rescaled into HUs according to the linear transformation
HU=rawpixelvalue×rescaleslope+rescaleintercept. HU
=
raw
pixel
value
×
rescale
slope
+
rescale
intercept
.
In the CT scanners used in the present study (Siemens and GE), rescale intercept is equal to −1024, so this value represents zero density.
Get Radiology Tree app to read full this article<
Get Radiology Tree app to read full this article<
Statistical Analysis
Get Radiology Tree app to read full this article<
Results
Get Radiology Tree app to read full this article<
Table 1
CT Volumes and Emphysema Index Values in Healthy Subjects
Subject CT Volume (L) RV/TLC (%) Emphysema Index (%) TLC ∗ RV ∗ TLC † RV † TLC ‡ RV ‡ 1 6.13 1.76 28.74 25 2 45 1 2 5.83 1.11 19.02 23 1 43 1 3 4.33 1.63 37.68 13 1 8 1 4 5.48 2.90 53.01 23 5 38 3 5 9.20 2.51 27.33 27 3 41 1 6 5.44 1.27 23.27 20 1 34 1 7 3.70 0.86 23.16 14 0 6 1 8 4.65 1.65 35.54 17 0 12 1 9 5.46 1.23 22.52 24 0 33 1 10 4.41 1.14 25.88 25 0 42 0 Mean 5.46 1.61 29.62 21 1 30 1 SD 1.52 0.65 10.06 5 2 15 1 SE 0.48 0.21 3.18 2 0 5 0
CT, computed tomographic; RV, residual volume; SD, standard deviation; SE, standard error; TLC, total lung capacity.
Get Radiology Tree app to read full this article<
Get Radiology Tree app to read full this article<
Get Radiology Tree app to read full this article<
Table 2
CT Volumes and Emphysema Index Values in Patients with Emphysema
Patient Scanner CT Volume (L) RV/TLC (%) Emphysema Index (%) TLC ∗ RV ∗ TLC † RV † TLC ‡ RV ‡ 1 Siemens 7.81 6.67 85.38 57 53 76 70 2 Siemens 5.69 4.58 80.51 53 49 70 63 3 Siemens 8.00 7.12 88.93 55 54 71 69 4 GE 5.46 4.74 86.87 38 32 61 52 5 GE 4.88 3.88 79.56 33 24 53 42 6 Siemens 7.39 6.39 86.42 44 40 54 43 7 GE 4.73 3.51 74.07 19 12 37 18 8 Siemens 7.56 5.73 75.76 47 42 60 46 9 Siemens 7.33 5.29 72.15 47 40 63 44 10 GE 5.73 4.50 78.46 39 30 55 43 11 GE 5.87 3.73 63.64 40 27 60 39 12 GE 4.75 3.72 78.39 37 30 58 47 13 Siemens 8.85 7.34 82.94 49 44 64 55 14 Siemens 5.26 5.14 97.66 42 41 45 50 15 Siemens 7.13 4.77 66.88 44 37 57 34 16 Siemens 7.89 6.47 82.01 46 42 59 48 17 GE 8.94 6.95 77.79 37 27 61 45 18 GE 5.44 3.56 65.48 34 19 59 31 Mean 6.60 5.23 79.05 42 36 59 47 SD 1.42 1.32 8.68 9 11 9 13 SE 0.33 0.30 1.99 2 3 2 3
CT, computed tomographic; RV, residual volume; SD, standard deviation; SE, standard error; TLC, total lung capacity.
Get Radiology Tree app to read full this article<
Get Radiology Tree app to read full this article<
Get Radiology Tree app to read full this article<
Get Radiology Tree app to read full this article<
Get Radiology Tree app to read full this article<
Get Radiology Tree app to read full this article<
Get Radiology Tree app to read full this article<
Get Radiology Tree app to read full this article<
Get Radiology Tree app to read full this article<
Get Radiology Tree app to read full this article<
Get Radiology Tree app to read full this article<
Get Radiology Tree app to read full this article<
Get Radiology Tree app to read full this article<
Get Radiology Tree app to read full this article<
Get Radiology Tree app to read full this article<
Get Radiology Tree app to read full this article<
Get Radiology Tree app to read full this article<
Discussion
Get Radiology Tree app to read full this article<
Get Radiology Tree app to read full this article<
Get Radiology Tree app to read full this article<
Get Radiology Tree app to read full this article<
Get Radiology Tree app to read full this article<
Get Radiology Tree app to read full this article<
Get Radiology Tree app to read full this article<
Get Radiology Tree app to read full this article<
Conclusions
Get Radiology Tree app to read full this article<
Get Radiology Tree app to read full this article<
References
1. Goldin J.G.: Imaging the lungs in patients with pulmonary emphysema. J Thorac Imaging 2009; 24: pp. 163-170.
2. Coxson H.O., Rogers R.M., Whittall K.P., et. al.: A quantification of the lung surface area in emphysema using computed tomography. Am J Respir Crit Care Med 1999; 159: pp. 851-856.
3. Salito C., Aliverti A., Gierada D.S., et. al.: Quantification of trapped gas with CT and 3 He MR imaging in a porcine model of isolated airway obstruction. Radiology 2009; 253: pp. 380-389.
4. Choong C.K., Macklem P.T., Pierce J.A., et. al.: Airway bypass improves the mechanical properties of explanted emphysematous lungs. Am J Respir Crit Care Med 2008; 178: pp. 902-905.
5. Venuta F., Rendina E.A., Coloni G.F.: Endobronchial treatment of emphysema with one-way valves. Thorac Surg Clin 2009; 19: pp. 255-260.
6. Berger R.L., Decamp M.M., Criner G.J., et. al.: Lung volume reduction therapies for advanced emphysema: an update. Chest 2010; 138: pp. 407-417.
7. Kemerink G.J., Kruize H.H., Lamers R.J., et. al.: Density resolution in quantitative computed tomography of foam and lung. Med Phys 1996; 23: pp. 1697-1708.
8. Fromson B.H., Denison D.M.: Quantitative features in the computed tomography of healthy lungs. Thorax 1988; 43: pp. 120-126.
9. Boedeker K.L., McNitt-Gray M.F., Rogers S.R., et. al.: Emphysema: effect of reconstruction algorithm on CT imaging measures. Radiology 2004; 232: pp. 295-301.
10. Hu S., Hoffman E.A., Reinhardt J.M.: Automatic lung segmentation for accurate quantitation of volumetric X-ray CT images. IEEE Trans Med Imaging 2001; 20: pp. 490-498.
11. Hedlund L.W., Vock P., Effmann E.L.: Evaluating lung density by computed tomography. Semin Respir Med 1983; 5: pp. 76-87.
12. Kemerink G.J., Lamers R.J., Thelissen G.R., et. al.: CT densitometry of the lungs: scanner performance. J Comput Assist Tomogr 1996; 20: pp. 24-33.
13. Newell J.D., Hogg J.C., Snider G.L.: Report of a workshop: quantitative computed tomography scanning in longitudinal studies of emphysema. Eur Respir J 2004; 23: pp. 769-775.
14. Gierada D.S., Bierhals A.J., Choong C.K., et. al.: Effects of CT section thickness and reconstruction kernel on emphysema quantification relationship to the magnitude of the CT emphysema index. Acad Radiol 2010; 17: pp. 146-156.
15. Yuan R., Mayo J.R., Hogg J.C., et. al.: The effects of radiation dose and CT manufacturer on measurements of lung densitometry. Chest 2007; 132: pp. 617-623.
16. Fuld M.K., Easley R.B., Saba O.I., et. al.: CT-measured regional specific volume change reflects regional ventilation in supine sheep. J Appl Physiol 2008; 104: pp. 1177-1184.
17. Mathews J.J., Maurer A.H., Steiner R.M., et. al.: New 133Xe gas trapping index for quantifying severe emphysema before partial lung volume reduction. J Nucl Med 2008; 49: pp. 771.