
Rationale and Objectives
The aims of this study were to assess the influence of slice thickness on the ability of radiologists to detect or not detect nodules and to agree or disagree on the diagnosis and also to investigate the potential dependence of these relations on the sizes, average computed tomographic (CT) values, and locations of the nodules.
Materials and Methods
Six radiologists performed qualitative diagnostic readings of multislice CT images with a slice thickness of 2 or 10 mm obtained from 360 subjects. The nodules were diagnosed as nodules for further examination (NFEs), inactive nodules for no further examination (INNFEs), or no abnormality. The results of the diagnoses were cross-tabulated and quantitatively analyzed using the average CT values, sizes, and locations of the nodules with reference to the 2-mm slices. Multivariate logistic regression analyses were used to estimate the significant associations of these parameters with the ability of radiologists to detect or not detect nodules and to agree or disagree on the diagnosis.
Results
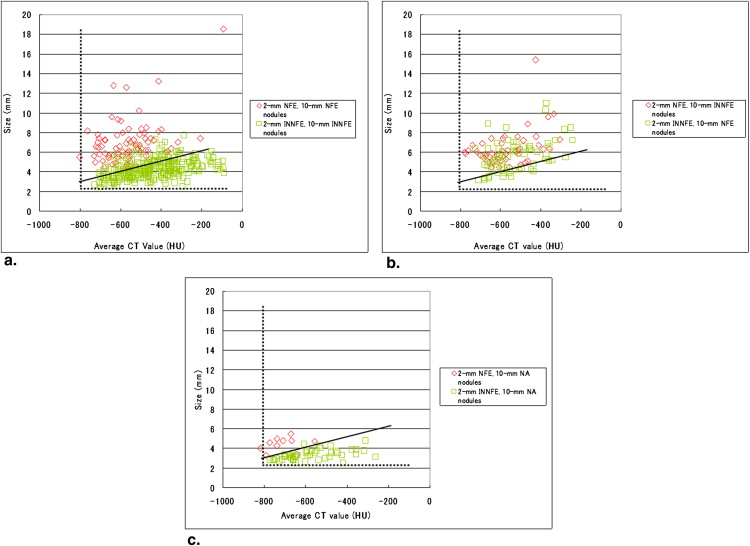
Totals of 130 NFEs and 403 INNFEs for 2-mm slice thickness and 142 NFEs and 338 INNFEs for 10-mm slice thickness were diagnosed. Nodule classifications were as follows: the same diagnosis on both slice thickness images (67.6%), different diagnoses on two slice thickness images (21%), missed on 10-mm slice thickness images (10.6%), and misinterpreted on 10-mm slice thickness images (0.7%). Regarding detection and nondetection, NFE diagnoses were influenced by size (odds ratio [OR], 132.50; 95% confidence interval [CI], 4.77–4711) and the average CT value (OR, 27.20; 95% CI, 3.21–645.3), and INNFE diagnoses were influenced by size (OR, 16.10; 95% CI, 6.18–55.19) and the average CT value (OR, 7.67; 95% CI, 2.19–30.91). Regarding diagnostic agreement and disagreement, the NFE diagnoses were influenced by size (OR, 3.60; 95% CI, 1.29–11.04), nodule distance from the lung border (OR, 2.85; 95% CI, 1.27–6.65), and nodule location in the right upper lobe (OR, 0.07; 95% CI, 0.003–0.477), while the INNFE diagnoses were influenced by the average CT value (OR, 11.84; 95% CI, 3.33–55.86), size (OR, 0.42; 95% CI, 0.25–0.70), and nodule distance from the lung border (OR, 0.41; 95% CI, 0.25–0.66).
Conclusions
The influence of slice thickness on the ability of radiologists to detect or not detect nodules and to agree or disagree on the diagnosis was quantitatively evaluated. Detection and nondetection of NFEs and INNFEs are influenced by size and average CT value. Agreement and disagreement on NFE and INNFE diagnoses are influenced not only by size and average CT value but also, importantly, by the locations of nodules.
Lung cancer has the highest mortality rate of all cancers in Japan. Early detection is necessary to improve the prognosis of this disease. For this reason, several lung cancer screening programs have been conducted . The modalities used for lung cancer screening include chest x-ray, sputum cytology, low-dose x-ray helical computed tomographic (CT) imaging, and multislice CT (MSCT) imaging . Compared to other modalities, CT imaging excels in the imaging of the lungs; therefore, several programs have adopted CT imaging as the modality of choice for lung cancer screening . Recently, Henschke and Yankelevitz provided an update of CT screening for lung cancer in 2007. This update summarizes the diagnostic and prognostic measures available for screening trials to date.
Henschke et al also reported the baseline findings from the Early Lung Cancer Action Project, in which low-dose helical CT scans were performed using 10-mm slice thickness. Currently, baseline and repeat screenings are being performed using MSCT scanners with 1.25-mm slice thickness . Moreover, Swensen et al reported lung cancer CT screening using 5-mm slice thickness, and images with slice thicknesses of 1 to 3 mm are currently being used at the Mayo Clinic.
Get Radiology Tree app to read full this article<
Get Radiology Tree app to read full this article<
Get Radiology Tree app to read full this article<
Get Radiology Tree app to read full this article<
Materials and methods
Get Radiology Tree app to read full this article<
MSCT Images
Get Radiology Tree app to read full this article<
Qualitative Diagnostic Readings
Get Radiology Tree app to read full this article<
Table 1
Diagnostic Criteria for Pulmonary Nodule Diagnosis
A nodule >3 mm in diameter A nodule characterized as
Get Radiology Tree app to read full this article<
Get Radiology Tree app to read full this article<
Get Radiology Tree app to read full this article<
Get Radiology Tree app to read full this article<
Get Radiology Tree app to read full this article<
Cross-tabulation of Diagnosed Nodules
Get Radiology Tree app to read full this article<
Nodule Detection and Nondetection and Diagnostic Agreement and Disagreement
Get Radiology Tree app to read full this article<
Quantitative Analysis of Diagnosed Nodule Features and Locations
Get Radiology Tree app to read full this article<
Get Radiology Tree app to read full this article<
Get Radiology Tree app to read full this article<
Get Radiology Tree app to read full this article<
Statistical Analysis
Get Radiology Tree app to read full this article<
Results
Diagnostic Reading and Nodule Groupings
Get Radiology Tree app to read full this article<
Table 2
Cross-tabulation of Pulmonary Nodule Diagnoses Made by Physicians
Diagnosis Using 2-mm Slice Thickness Diagnosis Using 10-mm Slice Thickness NFE INNFE NA Total NFE 74 46 10 130 INNFE 67 289 47 403 NA 1 3 — 4 Total 142 338 57 537
INNFE, inactive nodule for no further examination; NA, no abnormality; NFE, nodule for further examination.
Table 3
Nodule Groupings and Respective Diagnoses for 2-mm and 10-mm Slice Thickness Images
Nodule Group Diagnoses Number of Nodules (%) 1. Nodule with the same diagnoses for the 2-mm and 10-mm slice thickness images 2 mm NFE, 10 mm NFE 74 (13.8) 2 mm INNFE, 10 mm INNFE 289 (53.8) 2. Nodules with different diagnoses for the 2-mm and 10-mm slice thickness images 2 mm NFE, 10 mm INNFE 46 (8.6) 2 mm INNFE, 10 mm NFE 67 (12.5) 3. Nodules that were missed on the 10-mm slice thickness images 2 mm NFE, 10 mm NA 10 (1.9) 2 mm INNFE, 10 mm NA 47 (8.7) 4. Nodules that were misinterpreted on the 10-mm slice thickness images 2 mm NA, 10 mm NFE 1 (0.2) 2 mm NA, 10 mm INNFE 3 (0.6)
INNFE, inactive nodule for no further examination; NA, no abnormality; NFE, nodule for further examination.
Get Radiology Tree app to read full this article<
Quantitative Analysis
Get Radiology Tree app to read full this article<
Get Radiology Tree app to read full this article<
Get Radiology Tree app to read full this article<
Get Radiology Tree app to read full this article<
Get Radiology Tree app to read full this article<
Get Radiology Tree app to read full this article<
Get Radiology Tree app to read full this article<
Get Radiology Tree app to read full this article<
Statistical Analysis
Get Radiology Tree app to read full this article<
Table 4
Relationships Among Features and Locations of Nodules and Detection or Nondetection of NFEs
Parameter Detected Nondetected OR 95% CI_P_ CT value (HU) ≤−700 16 6 1.00 Reference — >−700 104 4 27.20 3.21–645.3 .0085 Size (mm) ≤5 14 9 1.00 Reference — >5 106 1 132.50 14.77–4711 .0040 Location ∗ Left lower lobe 26 1 — — — Left upper lobe 19 3 — — — Right lower lobe 31 0 — — — Right middle lobe 12 0 — — — Right upper lobe 32 6 — — — Distance from lung border (mm) ≤3 59 6 1.00 Reference — >3 61 4 7.67 0.95–173.88 .0965
Hosmer-Lemeshow test = 0.7076, df = 2, P = .7022.
CI, confidence interval; CT, computed tomographic; HU, Hounsfield units; NFE, nodule for further examination; OR, odds ratio.
Get Radiology Tree app to read full this article<
Table 5
Relationships Among Features and Locations of Nodules and Detection or Nondetection of INNFEs
Parameter Detected Nondetected OR 95% CI_P_ CT value (HU) ≤−700 5 8 1.00 Reference — >−700 351 39 7.67 2.19–30.91 .0020 Size (mm) ∗ ≤4 132 43 1.00 Reference — >4 224 4 16.10 6.18–55.19 <.0001 Location Left lower lobe 69 6 0.30 0.01–2.22 .3128 Left upper lobe 68 16 0.12 0.0058–0.74 .3916 Right lower lobe 70 6 0.23 0.01–1.75 .0598 Right middle lobe 20 1 1.00 Reference — Right upper lobe 129 18 0.17 0.008–1.06 .1163 Distance from lung border (mm) ≤3 212 28 1.00 Reference — >3 144 19 0.89 0.43–1.85 .7579
Hosmer-Lemeshow test = 0.2309, df = 2, P = .8910.
CI, confidence interval; CT, computed tomographic; HU, Hounsfield units; INNFE, inactive nodule for no further examination; OR, odds ratio.
Get Radiology Tree app to read full this article<
Get Radiology Tree app to read full this article<
Get Radiology Tree app to read full this article<
Table 6
Relationships Among Features and Locations of Nodules and Agreement or Disagreement on NFE Diagnosis
Parameter Agree Disagree OR 95% CI_P_ CT value (HU) ≤−700 10 12 1.00 Reference — >−700 64 44 1.17 0.40–3.38 .7693 Size (mm) ≤5 7 16 1.00 Reference — >5 67 40 3.60 1.29–11.04 .0177 Location Left lower lobe 19 8 0.26 0.01–1.84 .2400 Left upper lobe 9 13 0.12 0.005–0.86 .0698 Right lower lobe 19 12 0.18 0.009–1.17 .1286 Right middle lobe 11 1 1.00 Reference — Right upper lobe 16 22 0.07 0.003–0.477 .0210 Distance from lung border (mm) ≤3 30 35 1.00 Reference — >3 44 21 2.85 1.27–6.65 .0125
Hosmer-Lemeshow test = 4.9741, df = 8, P = .7603.
CI, confidence interval; CT, computed tomographic; HU, Hounsfield units; NFE, nodule for further examination; OR, odds ratio.
Table 7
Relationships Among Features and Locations of Nodules and Agreement or Disagreement on INNFE Diagnosis
Parameters Agree Disagree OR 95% CI_P_ CT value (HU) ≤−700 3 10 1.00 Reference — >−700 286 104 11.84 3.33–55.86 .0003 Size (mm) ≤5 229 74 1.00 Reference — >5 60 40 0.42 0.24–0.70 .0009 Location Left lower lobe 61 14 0.84 0.22–2.80 .7800 Left upper lobe 52 32 0.33 0.09–1.02 .0600 Right lower lobe 51 25 0.54 0.17–1.88 .3119 Right middle lobe 16 5 1.00 Reference — Right upper lobe 109 38 0.62 0.17–1.88 .4307 Distance from lung border (mm) ≤3 189 51 1.00 Reference — >3 100 63 0.41 0.25–0.66 .0002
Hosmer-Lemeshow test = 5.7330, df = 4, P = .2200.
CI, confidence interval; CT, computed tomographic; HU, Hounsfield units; INNFE, inactive nodule for no further examination; OR, odds ratio.
Get Radiology Tree app to read full this article<
Discussion
Get Radiology Tree app to read full this article<
Get Radiology Tree app to read full this article<
Get Radiology Tree app to read full this article<
Get Radiology Tree app to read full this article<
Get Radiology Tree app to read full this article<
Get Radiology Tree app to read full this article<
Conclusions
Get Radiology Tree app to read full this article<
References
1. Kaneko M., Eguchi K., Ohmatsu H., et. al.: Peripheral lung cancer: screening and detection with low-dose spiral CT versus radiography. Radiology 1996; 201: pp. 798-802.
2. Sone S., Takashima S., Li F., et. al.: Mass screening for lung cancer with mobile spiral computed tomography scanner. Lancet 1998; 351: pp. 1242-1245.
3. Sobue T., Moriyama N., Kaneko M., et. al.: Screening for lung cancer with low-dose helical computed tomography: Anti-Lung Cancer Association Project. J Clin Oncol 2002; 20: pp. 911-920.
4. Sluimer I., Schilham A., Prokop M., et. al.: Computer analysis of computed tomography scans of the lung: a survey. IEEE Trans Med Imaging 2006; 25: pp. 385-405.
5. Henschke C.I., Yankelevitz D.: CT screening for lung cancer: update 2007. Oncologist 2008; 13: pp. 65-78.
6. Henschke C.I., McCauley D., Yankelevitz D., et. al.: Early lung cancer action project: a summary of the findings on baseline screening. Oncologist 2001; 6: pp. 147-152.
7. New York Early Lung Cancer Action Project Investigators: CT screening for lung cancer: diagnoses resulting from the New York Early Lung Cancer Action Project. Radiology 2007; 243: pp. 239-249.
8. Swensen S.J., Jett J.R., Hartman T.E., et. al.: Lung cancer screening with CT: Mayo Clinic experience. Radiology 2003; 226: pp. 756-761.
9. Kakinuma R., Kaneko M., Ohmatsu H., et. al.: Practice of low-dose helical CT screening for lung cancer [article in Japanese]. Respir Circ 2008; 56: pp. 457-463.
10. Nawa T., Nakagawa T., Kusano S., et. al.: Lung cancer screening using low-dose spiral CT. Chest 2002; 122: pp. 15-20.
11. MacMahon H., Austin J.H., Gamsu G., et. al.: Guidelines for management of small pulmonary nodules detected on CT scans: a statement from the Fleischner Society. Radiology 2005; 237: pp. 395-400.
12. Japanese Society of CT Screening. Single slice helical CT lung cancer CT screening criteria and guidelines for observation [in Japanese]. Available at: http://www.jscts.org/pdf/guideline/GL0104.pdf . Accessed June 22, 2010.
13. Naidich D.P., Rusinek H., McGuiness G., et. al.: Variables affecting pulmonary nodule detection with computed tomography: evaluation with three-dimensional computer simulation. J Thorac Imaging 1993; 8: pp. 291-299.
14. Fischbach F., Knollmann F., Griesshaber V., et. al.: Detection of pulmonary nodules by multislice computed tomography: improved detection rate with reduced slice thickness. Eur Radiol 2003; 13: pp. 2378-2383.
15. Nishioka D., Kubo M., Kawata Y., et. al.: The comparative evaluation of lung test based on 2 and 10mm thickness multi-slice CT image. SPIE Med Imaging 2004; 5370: pp. 896-903.
16. Sinsuat M., Shimamura I., Saita S., et. al.: Comparative evaluation of physicians’ pulmonary nodule detection with reduced slice thickness at CT screening. SPIE Med Imaging 2008; 6916: pp. 691621-1-691621-10.
17. International Commission on Radiological Protection: ICRP publication 103: recommendations of the ICRP.2008.ElsevierNew York
18. ImPACT CT patient dosimetry calculator: version 1.0.0. Available at: http://www.impactscan.org . Accessed September 13, 2010.
19. Kanazawa K., Kawata Y., Niki N., et. al.: Computer-aided diagnosis for pulmonary nodules based on helical CT images. Comput Med Imaging Graph 1998; 22: pp. 157-167.
20. Minami K., Kawata Y., Niki N., et. al.: Classifying pulmonary nodules using dynamic enhanced CT images based on CT number histogram. SPIE Med Imaging 2008; 6915: pp. 69152-1-69152-9.
21. Kawai J., Saita S., Kubo M., et. al.: Automated anatomical labeling algorithm of bronchial branches based on multi-slice CT images. SPIE Med Imaging 2007; 6514: 65143S-1–65143S-8
22. Saita S., Kubo M., Kawata Y., et. al.: Algorithm of pulmonary emphysema extraction using thoracic 3-D CT images. SPIE Med Imaging 2008; 6915: 69152L1–69152L8
23. Hosmer D.W., Lemeshow S.: Assessing the fit of the model.Cressie N.A.C.Fisher N.I.Johnstone I.M. et. al.Applied Logistic Regression.2000.John WileyHoboken, NJ:pp. 143-202.
24. Kawata Y., Niki N., Ohmatsu H., et. al.: Example-based assisting approach for pulmonary nodule classification in three-dimensional thoracic computed tomography images. Acad Radiol 2003; 10: pp. 1402-1415.