
Rationale and Objectives
Many imaging modalities and methodologies exist for evaluating the pulmonary airways. Individually, each modality provides insight to the state of the airways; however, alone they do not necessarily provide a comprehensive description. The goal of this work is to integrate complementary medical imaging datasets to form a synergistic description of the airways.
Materials and Methods
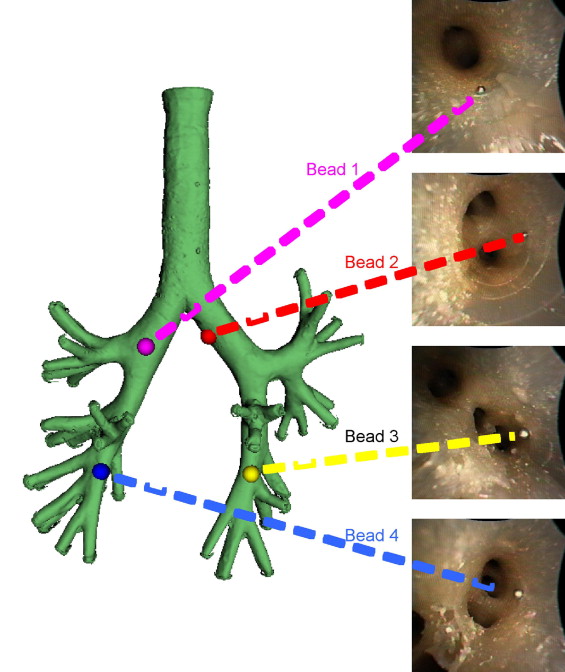
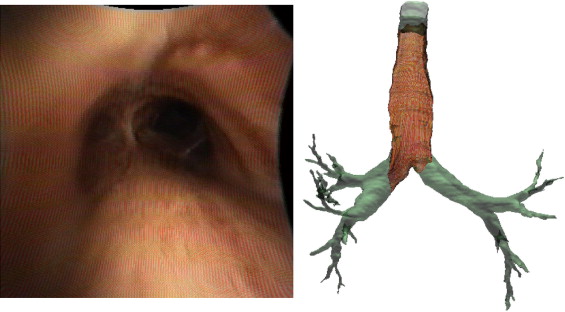
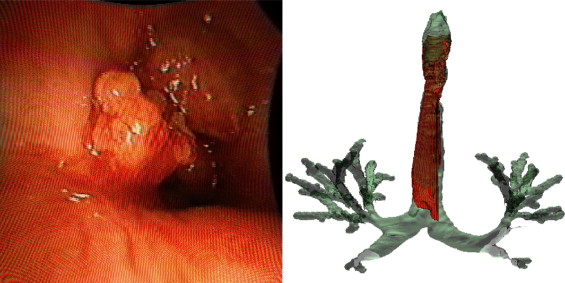
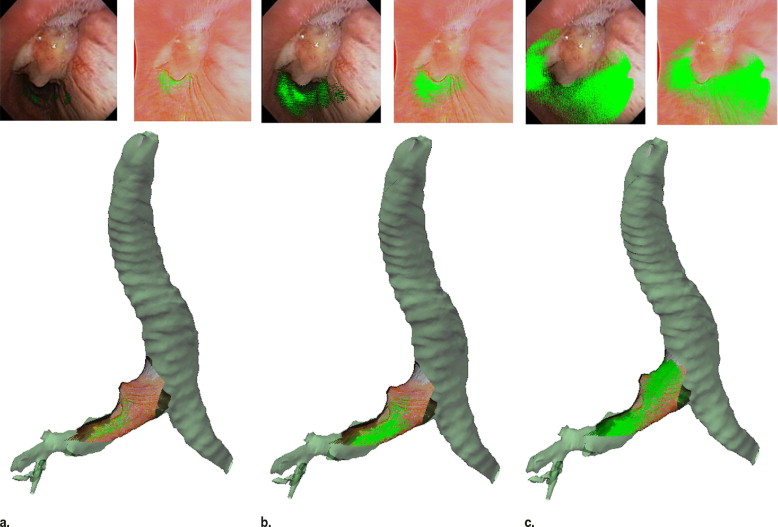
Two digital bronchoscopic techniques were used to evaluate the pulmonary mucosa. A digital color bronchoscopic system was used to detect mucosal color alterations, and a fluorescence detection system was used to assess the microvasculature of the bronchial mucosa. Study participants were also imaged with a multidetector row computed tomographic (MDCT) scanner. Virtual bronchoscopic and image registration techniques were exploited to combine three-dimensional surface renderings, extracted from the MDCT data, together with the two-dimensional digital bronchoscopic images. Validation of the fusion process was performed on a rubber phantom of an adult airway with 4 embedded metal beads.
Results
The fusion of the MDCT extracted airway tree and the digital bronchoscopic datasets were presented for three study participants. In addition, the detected accuracy of the registration method to reliably align the MDCT and bronchoscopic image datasets was determined to be 1.98 mm in the phantom airway model.
Conclusion
We have demonstrated that merging of three distinct digital datasets to provide a single synergistic description of the airways is possible. This is a pilot project in the field of eidomics, the process of combining digital image datasets and image-based processes together. We anticipate that in the future eidomics will provide a universal and predictive imaging language that will change health care delivery.
Pulmonary airway diseases, such as chronic obstructive pulmonary disease (COPD), including emphysema and chronic bronchitis, and asthma, are the fourth leading cause of death in the world ( ). Increased mucus production and airway inflammation are generally associated with COPD and asthma, and persistence of this chronic irritation can, in many cases, lead to permanent damage. Lung cancer is the leading cause of cancer related death in the United States, accounting for 29% of all cancer deaths ( ). Despite recent efforts to reduce the mortality associated with this disease, patient prognosis remains poor, with the current 5-year survival rate under 15% ( ). The prevalence and high mortality rate associated with lung cancer and other pulmonary airway diseases gives impetus to the need for new highly accurate and sensitive screening tools with the objective of early detection and diagnosis. As a result, many imaging modalities currently exist, including chest x-ray ( ), computed tomography (CT) ( ), magnetic resonance imaging (MRI), positron emission tomography (PET), and white light bronchoscopy. In addition, many more new novel imaging techniques, such as optical coherence tomography ( ), confocal microscopy ( ), digital color bronchoscopy ( ), fluorescence bronchoscopy ( ), and autofluorescence bronchoscopy ( ), are being developed. These existing and emerging technologies may provide invaluable insights to one or more facets of the disease assault on the affected tissue; however, many cases do not comprehensively reveal all of the structural and functional changes that occur.
The purpose of this research is to extract and utilize the informative aspects from two-dimensional (2D) and three-dimensional (3D) imaging modalities and combine these to form a comprehensive synergistic dataset. Digital image datasets are full of complex information, and due to the ever increasing number of imaging modalities available, physicians must often rely on computer-aided methods to interrogate and possibly interpret these large image sets. Many times physicians do not have the opportunity to look at the images but rely instead on written reports. As images convey an extraordinary amount of information, subtleties visible only to the master clinician may often be missed as a result. It is clear that the investigating physician must view the image data. Eidomics ( “ eido ” Greek for image structure, and “ omics ” English for biology) is the process of combining digital image datasets with informative image-based manipulations, which may be powered by artificial intelligence, and displaying the conglomerate of information-rich results with superior end-user visualization tools. Such visualization tools may include dynamic interactive simulations or animations. The eidomic model may additionally incorporate other patient specific information, or a priori information derived from image databases, to better predict disease behavior.
Get Radiology Tree app to read full this article<
Materials and methods
Get Radiology Tree app to read full this article<
Get Radiology Tree app to read full this article<
Airway Imaging Modalities
MDCT
Get Radiology Tree app to read full this article<
Color bronchoscope
Get Radiology Tree app to read full this article<
Get Radiology Tree app to read full this article<
Fluorescence bronchoscopy
Get Radiology Tree app to read full this article<
Get Radiology Tree app to read full this article<
Get Radiology Tree app to read full this article<
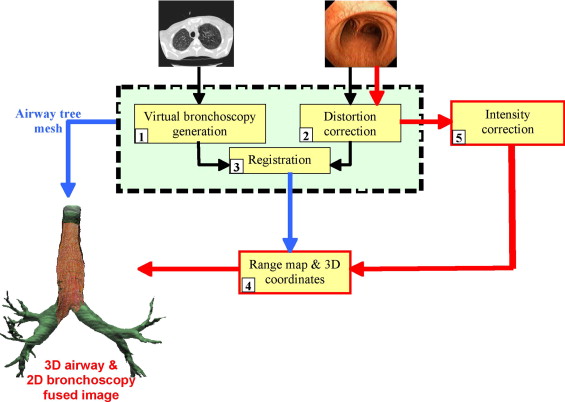
The Fusion Process
Virtual bronchoscopy generation
Get Radiology Tree app to read full this article<
Distortion correction of digital bronchoscope images
Get Radiology Tree app to read full this article<
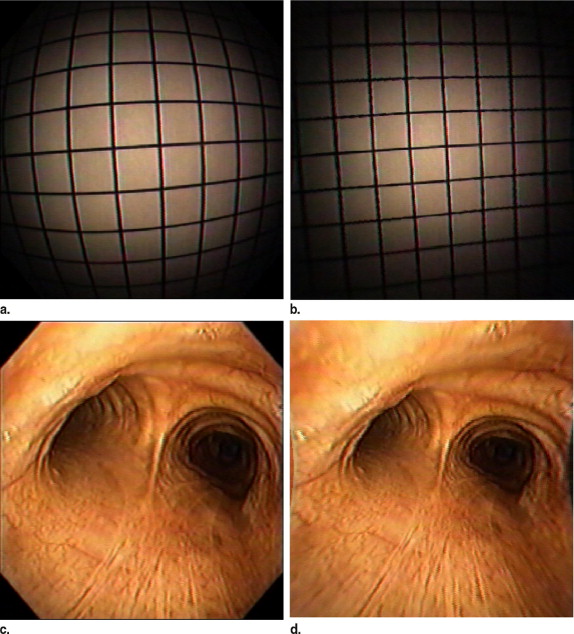
Get Radiology Tree app to read full this article<
Virtual and digital bronchoscopy registration
Get Radiology Tree app to read full this article<
Get Radiology Tree app to read full this article<
l(u(x),v(T(x)))≡h(u(x))+h(v(T(x)))−h(u(x),v(T(x))). l
(
u
(
x
)
,
v
(
T
(
x
)
)
)
≡
h
(
u
(
x
)
)
+
h
(
v
(
T
(
x
)
)
)
−
h
(
u
(
x
)
,
v
(
T
(
x
)
)
)
.
The first term on the right side of the above equation represents the entropy of the reference image (digital bronchoscopic image) and thus is fixed; the second term is the entropy of the image to be registered (the virtual bronchoscopic image), and the third term is the joint entropy of the two. To find the best alignment of the two images we need to find T that maximizes l() . This will occur when the second term is at a maximum to ensure that the virtual image has a variety of grayscale values, and the third term a minimum, with consistent grouping between the two images. The registration method used, although based on this approach, was modified by adding weighting factors to favor the darker image intensities, such as bifurcation regions of the airways ( ). The reasoning behind the intensity weighting in the entropy calculations is that the darker image regions generally have less noise than the lighter regions. The light regions often exhibit image singularities or noise in the digital color bronchoscopic images. This noise may be a result of such things as bright illumination source reflections from surface fluid in the airways, or image blurring from rapid bronchoscope or airway movement. Alternatively, the darker image regions are generally indicative of major airway wall structure, such as direction or significant surface landmarks. The determined weights are applied to the entropy terms used in the mutual information calculation. The digital color bronchoscopic images are converted to grayscale intensity images for the registration process. Grayscale values are determined by converting the red, green, blue (RGB) images to the hue, saturation, intensity (HSI) color space and using the I values only.
Get Radiology Tree app to read full this article<
Get Radiology Tree app to read full this article<
Determining range values and real world coordinates
Get Radiology Tree app to read full this article<
Get Radiology Tree app to read full this article<
p′=⎡⎣⎢⎢⎢⎢10000100001−1d0000⎤⎦⎥⎥⎥⎥⎡⎣⎢⎢⎢⎢xyz1⎤⎦⎥⎥⎥⎥=⎡⎣⎢⎢⎢⎢x′y′z′z′d⎤⎦⎥⎥⎥⎥. p
’
=
[
1
0
0
0
0
1
0
0
0
0
1
0
0
0
−
1
d
0
]
[
x
y
z
1
]
=
[
x
’
y
’
z
’
z
’
d
]
.
The perspective projection transformation, M , used to map 3D objects to the screen is defined by near (zNear) and far (zFar) clipping planes as only a segment of the volume is visualized at any given time.
M=⎡⎣⎢⎢⎢⎢⎢faspect0000f0000A−100B0⎤⎦⎥⎥⎥⎥⎥ M
=
[
f
a
s
p
e
c
t
0
0
0
0
f
0
0
0
0
A
B
0
0
−
1
0
]
where
A=zFar+zNearzNear−Zfar A
=
z
F
a
r
+
z
N
e
a
r
z
N
e
a
r
−
Z
f
a
r
and
B=2⋅zFar⋅zNearzNear−zFar. B
=
2
·
z
F
a
r
·
z
N
e
a
r
z
N
e
a
r
−
z
F
a
r
.
In the above equation, f=cot(fovy2) f
=
cot
(
f
o
v
y
2
) , where fovy is the field of view angle defined in degrees, and aspect is the ratio of width to height.
Get Radiology Tree app to read full this article<
Get Radiology Tree app to read full this article<
z=2⋅zFar⋅zNearz′(zNear−zFar)+zFar+zNear. z
=
2
⋅
z
F
a
r
⋅
z
N
e
a
r
z
′
(
z
N
e
a
r
−
z
F
a
r
)
+
z
F
a
r
+
z
N
e
a
r
.
We can then determine x and y from similar triangles as:
x=x′⋅z⋅aspectf,andy=y′⋅z⋅aspectf. x
=
x
′
⋅
z
⋅
a
s
p
e
c
t
f
,
a
n
d
y
=
y
′
⋅
z
⋅
a
s
p
e
c
t
f
.
Get Radiology Tree app to read full this article<
Get Radiology Tree app to read full this article<
Intensity correction of digital color bronchoscopy images and display
Get Radiology Tree app to read full this article<
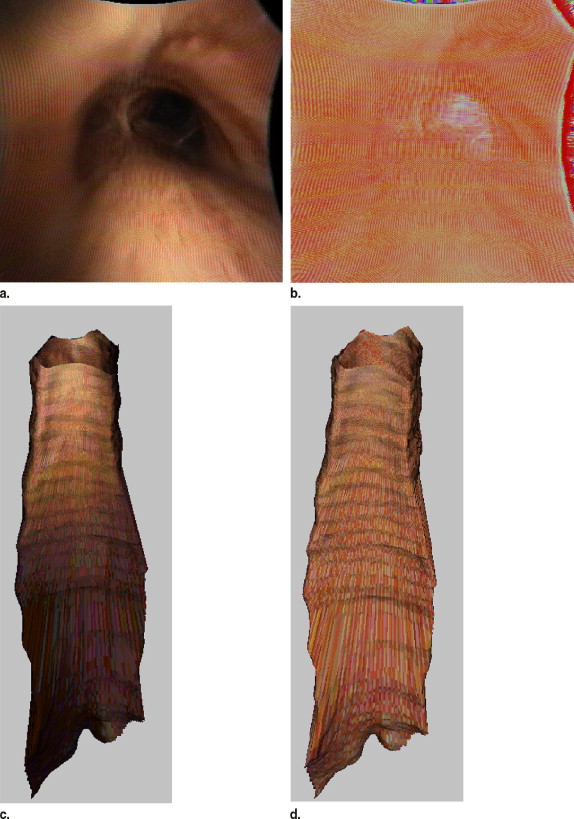
Get Radiology Tree app to read full this article<
Experimental Methods
Get Radiology Tree app to read full this article<
Validation in airway phantom
Get Radiology Tree app to read full this article<
Get Radiology Tree app to read full this article<
Get Radiology Tree app to read full this article<
Results
Get Radiology Tree app to read full this article<
Get Radiology Tree app to read full this article<
Get Radiology Tree app to read full this article<
Get Radiology Tree app to read full this article<
Validation in Airway Phantom
Get Radiology Tree app to read full this article<
Discussion
Get Radiology Tree app to read full this article<
Get Radiology Tree app to read full this article<
Get Radiology Tree app to read full this article<
Get Radiology Tree app to read full this article<
Get Radiology Tree app to read full this article<
References
1. Kochanek K.D., Murphy S.L., Anderson R.N., et. al.: Deaths: final data for 2002. Nat Vital Statistics Rep 2004; 53: pp. 1-116.
2. Jemal A., Siegel R., Ward E., et. al.: Cancer statistics, 2007. Cancer J Clinic 2007; 57: pp. 43-66.
3. Fontana R.S.: The Mayo Lung Project. Cancer 2000; 89: pp. 2352-2355.
4. Wilkinson N.W., Loewen G.M., Klippenstein D.L., et. al.: The evolution of lung cancer screening. J Surg Oncol 2003; 84: pp. 234-238.
5. Hoffman E.A., Simon B.A., McLennan G.: State of the art. Proceedings of the American Thoracic Society 2006; 3: pp. 519-532.
6. Sone W., Takashima S., Li F., et. al.: Mass screening for lung cancer with mobile spiral computed tomography scanner. Lancet 1998; 351: pp. 1242-1245.
7. Yun S.H., Tearney G.J., Vakoc B.J., et. al.: Comprehensive volumetric optical microscopy in vivo. Nature Med 2006; 12: pp. 1429-1433.
8. Thiberville L., Moreno-Swirc S., Vercauteren T., et. al.: In vivo imaging of the bronchial wal microstructure using fibered confocal fluorescence microscopy. Am J Respir Crit Care Med 2007; 175: pp. 22-31.
9. Suter M., Reinhardt J.M., Riker D., et. al.: Macro-optical color assessment of the pulmonary airways with subsequent 3D MDCT assisted display. J Biomed Optics 2005; 10: pp. 1-11.
10. Rooney C.P., Suter M., McLennan G., et. al.: Laser fluorescence bronchoscopy for detection of fluorescent reporter genes in airway epithelia. Gene Therapy 2002; 9: pp. 1639-1644.
11. Suter M.J., McLennan G., Reinhardt J.M., et. al.: Bronchoscopic imaging of pulmonary mucosal vasculature responses to inflammatory mediators. J Biomed Optics 2005; 10: pp. 1-5.
12. Feller-Kopman D., Lunn W., Ernst A.: Autofluorescence bronchoscopy and endobronchial ultrasound: a practical review. Ann Thorac Surg 2005; 80: pp. 2395-2401.
13. Lam S., MacAulay C., leRiche J.C., et. al.: Detection and localization of early lung cancer by fluorescence bronchoscopy. Cancer 2000; 89: pp. 2468-2473.
14. Sherbondy A.J., Kiraly A.P., Austin A.L., et. al.: Virtual bronchoscopic approach for combining 3D CT and endoscopic video. Proceedings SPIE Medl Imag 2000 2000; 3978: pp. 104-116.
15. Zhang C, Helferty JP, McLennan G, et al. Nonlinear distortion correction in endoscope video Images. IEEE Proceedings of International Conference on Image Processing. Vancouver, BC, Canada, September, 10–13, 2000; 439–442.
16. Helferty J.P.: Image-guided endoscopy and its aplication to pulmonary medicine [PhD].2002.The Pennsylvania State UniversityUniversity Park
17. Helferty J.P., Sherbondy A.J., Kiraly A.P., et. al.: Image-Guided Endoscopy for Lung-Cancer Assessment. IEEE International Conference on Image Processing 2001; II: pp. 307-310.
18. Bricault I., Ferretti G., Cinquin P.: Registration of real and CT-derived virtual bronchoscopic images to assist transbronchial biopsy. IEEE Trans Med Imag 1998; 17: pp. 703-714.
19. Suter MJ, Reinhardt JM, Sonka M, et al. Three dimensional true color topographical analysis of the pulmonary airways. SPIE Conference on Medical Imaging. San Diego, CA, 2004; 189–198.
20. Tschirren J, Palagyi K, Reinhardt JM, et al. Segmentation, skeletonization, and branchpoint matching - a fully automated quantitative evaluation of human intrathoracic airway trees. In: 5th International Conference on Medical Image Computing and Computer Assisted Intervention. Tokyo, 2002.
21. Tschirren J, Hoffman EA, McLennan G, et al. Branchpoint labeling and matching in human airway trees. SPIE Medical Imaging. San Diego, 2003.
22. Hoffman E.A., McLennan G.: Needs for assessment of pulmonary structure/function relationships and clinical outcomes measures: quantitative volumetric CT of the lung. Acad Radiol 1997; 4: pp. 758-776.
23. Hoffman E.A., Reinhardt J.M., Sonka M., et. al.: Characterization of the interstitial lung diseases via density-based and texture-based analysis of computed tomography images of lung structure and function. Acad Radiol 2003; 10: pp. 1104-1118.
24. Wanner A.: Circulation of the airway mucosa. J Appl Physiol 1989; 67: pp. 917-925.
25. Bjarnhall G., Maepea O., Sperber G.O., et. al.: Analysis of mean retinal transit time from fluorescein angiography in human eyes: normal values and reproducibility. Acata Ophthalmol Scand 2002; 80: pp. 652-655.
26. Browning D.J.: Fundus photographic, fluorescein angiographic, and indocyanine green angiographic signs in successful laser chorioretinal venous anastomosis for central retinal vein occlusion. Ophthalmology 1999; 106: pp. 2261-2268.
27. Asari K.V., Kumar S., Radhakrishnan D.: A new approach for nonlinear distortion correction in endoscopic images based on least squares estimation. IEEE Trans Med Imag 1999; 18: pp. 345-354.
28. Viola P., Wells W.M.: Alignment by maximization of mutual information. Int J Comp Vis 1997; 24: pp. 137-154.
29. Wells W.M., Viola P., Atsumi H., et. al.: Multi-modal volume registration by maximization of mutual information. Medl Image Analysis 1996; 1: pp. 35-51.
30. Nelder J.A., Mead R.: A simplex method for function minimization. Comput J 1965; 7: pp. 308-313.