
Rationale and objectives
Tumor volume change has potential as a biomarker for diagnosis, therapy planning, and treatment response. Precision was evaluated and compared among semiautomated lung tumor volume measurement algorithms from clinical thoracic computed tomography data sets. The results inform approaches and testing requirements for establishing conformance with the Quantitative Imaging Biomarker Alliance (QIBA) Computed Tomography Volumetry Profile.
Materials and Methods
Industry and academic groups participated in a challenge study. Intra-algorithm repeatability and inter-algorithm reproducibility were estimated. Relative magnitudes of various sources of variability were estimated using a linear mixed effects model. Segmentation boundaries were compared to provide a basis on which to optimize algorithm performance for developers.
Results
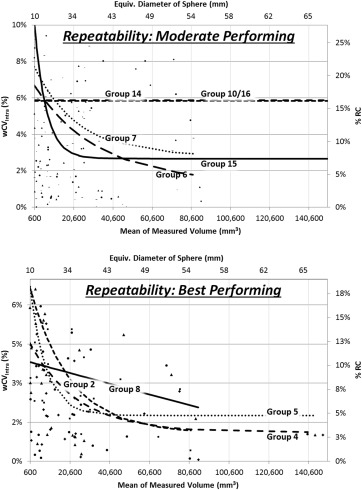
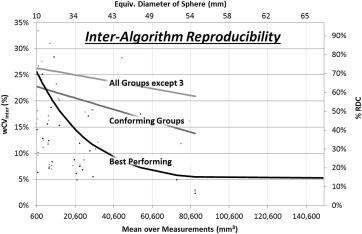
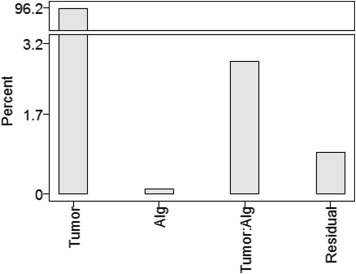
Intra-algorithm repeatability ranged from 13% (best performing) to 100% (least performing), with most algorithms demonstrating improved repeatability as the tumor size increased. Inter-algorithm reproducibility was determined in three partitions and was found to be 58% for the four best performing groups, 70% for the set of groups meeting repeatability requirements, and 84% when all groups but the least performer were included. The best performing partition performed markedly better on tumors with equivalent diameters greater than 40 mm. Larger tumors benefitted by human editing but smaller tumors did not. One-fifth to one-half of the total variability came from sources independent of the algorithms. Segmentation boundaries differed substantially, not ony in overall volume but also in detail.
Conclusions
Nine of the 12 participating algorithms pass precision requirements similar to what is indicated in the QIBA Profile, with the caveat that the present study was not designed to explicitly evaluate algorithm profile conformance. Change in tumor volume can be measured with confidence to within ±14% using any of these nine algorithms on tumor sizes greater than 10 mm. No partition of the algorithms was able to meet the QIBA requirements for interchangeability down to 10 mm, although the partition comprising best performing algorithms did meet this requirement for a tumor size of greater than approximately 40 mm.
Lung tumor volume change assessed with computed tomography (CT) has potential as a quantitative imaging biomarker to improve diagnosis, therapy planning, and monitoring of treatment response . Tumor volume change as a predictor of outcome has been of interest for some time .
To establish confidence in algorithmic analysis for CT volumetry as a rigorously defined assay useful for clinical and research purposes, volume measurement algorithms need to be characterized in terms of both bias and variability. Measurement error on serial CT scans can be affected by a number of interrelated factors, including imaging parameters, tumor characteristics, and/or measurement procedures . These effects must be understood and quantified. A number of technical studies have been performed toward this goal .
Get Radiology Tree app to read full this article<
Get Radiology Tree app to read full this article<
Get Radiology Tree app to read full this article<
Materials and methods
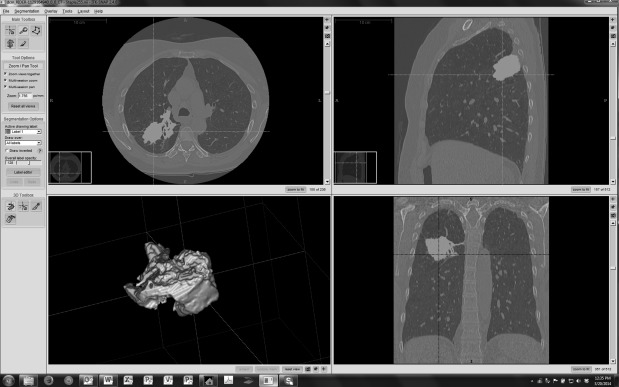
Data collection
Get Radiology Tree app to read full this article<
Get Radiology Tree app to read full this article<
Get Radiology Tree app to read full this article<
Get Radiology Tree app to read full this article<
Get Radiology Tree app to read full this article<
Get Radiology Tree app to read full this article<
Get Radiology Tree app to read full this article<
Statistical methods
Estimation of variability
Get Radiology Tree app to read full this article<
RC=1.962σ2ε−−−√=2.77σε, RC
=
1.96
2
σ
ε
2
=
2.77
σ
ε
,
where σ2ε σ
ε
2 is the within-tumor variance. The range in which two measurements on the same tumor were expected to fall for 95% of replicated measurements was given by [−RC, +RC] . In this study, we computed the within-tumor variance, and thus RC based on the difference between the test and retest measurements for each algorithm, respectively.
Get Radiology Tree app to read full this article<
Get Radiology Tree app to read full this article<
Get Radiology Tree app to read full this article<
Get Radiology Tree app to read full this article<
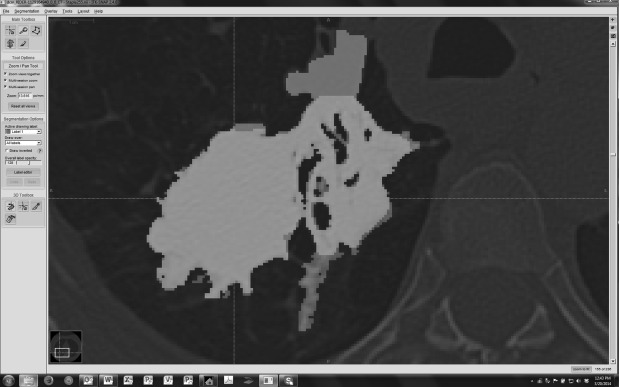
Comparison of segmentation boundaries
Get Radiology Tree app to read full this article<
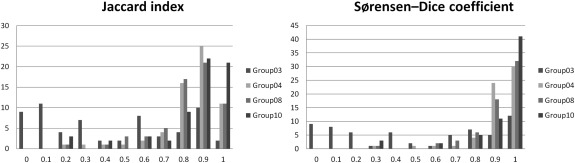
Jaccard=TPTP+FP+FN,Sørensen−Dice=2×TP2×TP+FP+FN. Jaccard
=
TP
TP
+
FP
+
FN
,
Sørensen
-
Dice
=
2
×
TP
2
×
TP
+
FP
+
FN
.
The Jaccard index includes a penalty for FP voxels, that is, when the candidate segmentation is larger than the reference segmentation. The Sørensen-Dice coefficient also penalizes FPs, but penalizes more strongly segmentations that have missed TPs. We computed and presented both types of overlap metrics to allow easier and wider comparison to results from other studies.
Get Radiology Tree app to read full this article<
Get Radiology Tree app to read full this article<
Results
Precision of volume measurements
Get Radiology Tree app to read full this article<
Get Radiology Tree app to read full this article<
Get Radiology Tree app to read full this article<
Table 1
Basic Descriptive Statistics for Measured Tumor Volume
Metric Volume (mm 3 ) Equivalent Sphere Diameter (mm) Arithmetic mean 24,100 36 Geometric mean 8320 25 Median 9110 26 Range 160,000 67
Get Radiology Tree app to read full this article<
Get Radiology Tree app to read full this article<
Get Radiology Tree app to read full this article<
Get Radiology Tree app to read full this article<
Intra-algorithm repeatability across test-retest repetitions within groups
Get Radiology Tree app to read full this article<
Table 2
Intra-algorithm Repeatability Coefficient (RC) Results
Group Using all 740 Readings 34 Anomalous Readings Excluded All Tumors Pooled Small Large RC (mm 3 ) RC (mm 3 ) %RC wCV intra RC (mm 3 ) RC (mm 3 ) Group 02 7557 1871 13% 5% 141 1866 Group 03 14.060 13,568 100% 36% 1321 13,501 Group 04 1801 1830 14% 5% 175 1825 Group 05 3007 2177 14% 5% 245 2163 Group 06 3418 3472 20% 7% 160 3469 Group 07 3495 3551 20% 7% 210 3545 Group 08 2935 2982 13% 5% 147 2.979 Group 11 41,411 39,885 50% 18% 441 39,883 Group 12 43,101 37,868 48% 18% 601 37,863 Group 14 11,081 11,259 21% 7% 161 11,257 Group 15 2226 2261 24% 9% 321 2238 Group 10/16 ∗ 7522 7643 22% 8% 215 7639
Get Radiology Tree app to read full this article<
Get Radiology Tree app to read full this article<
Inter-algorithm reproducibility across groups
Get Radiology Tree app to read full this article<
Table 3
Inter-algorithm Reproducibility Coefficient (RDC) Results
Partition RDC %RDC All but Group 3 25,284 mm 3 84% Conforming groups 16,057 mm 3 70% Best performers 9290 mm 3 58%
Get Radiology Tree app to read full this article<
Linear mixed effects model for estimating algorithm versus other sources of error
Get Radiology Tree app to read full this article<
Get Radiology Tree app to read full this article<
Get Radiology Tree app to read full this article<
Stratified reproducibility analyses
Get Radiology Tree app to read full this article<
Table 4
Number of Tumors Analyzed in Each Strata
Analysis Strata N Overall All 31 Small 8 Large 23 Profile = yes All 20 Small 7 Large 13 Profile = no All 11 Small 0 Large 11 With editing All 31 Small 8 Large 23 Without editing All 31 Small 8 Large 23
Profile = yes or no indicates whether the tumor met the measurability requirements as described previously. With/without editing defines whether postsegmentation contours could be adjusted by a user.
Get Radiology Tree app to read full this article<
Get Radiology Tree app to read full this article<
Table 5
Summary of Reproducibility Coefficient Results for Stratified Subgroups of Tumors and Algorithms
Strata RDC of Small Tumors RDC of Large Tumors Alg/Residual Variance (All Tumors) Combined 1290 mm 3 28,205 mm 3 3:1 Profile = yes 1290 mm 3 6369 mm 3 2:1 Profile = no (None in sample) 41,074 mm 3 10:2 With editing 1343 mm 3 26,760 mm 3 4:1 Without editing 1234 mm 3 33,004 mm 3 2:1
“Alg/Residual Variance” indicates the relative contributions of the two factors to the total variability.
Get Radiology Tree app to read full this article<
Analysis of segmentation boundaries
Get Radiology Tree app to read full this article<
Get Radiology Tree app to read full this article<
Merging and plotting of histograms by metric and group
Get Radiology Tree app to read full this article<
Get Radiology Tree app to read full this article<
Discussion
Get Radiology Tree app to read full this article<
Get Radiology Tree app to read full this article<
Get Radiology Tree app to read full this article<
Get Radiology Tree app to read full this article<
Get Radiology Tree app to read full this article<
Get Radiology Tree app to read full this article<
Get Radiology Tree app to read full this article<
Get Radiology Tree app to read full this article<
Get Radiology Tree app to read full this article<
Get Radiology Tree app to read full this article<
Acknowledgments
Get Radiology Tree app to read full this article<
Appendix
Algorithm descriptions
Get Radiology Tree app to read full this article<
Participating Group Description/Workflow
Three groups (Groups 01, 09, and 13) initially applied but did not submit results.
Get Radiology Tree app to read full this article<
Get Radiology Tree app to read full this article<
Get Radiology Tree app to read full this article<
Get Radiology Tree app to read full this article<
References
1. Biomarkers Definitions Working Group: Biomarkers and surrogate endpoints: preferred definitions and conceptual framework. Clin Pharmacol Ther 2001; 69: pp. 89-95.
2. Woodcock J., Woosley R.: The FDA critical path initiative and its influence on new drug development. Annu Rev Med 2008; 59: pp. 1-12.
3. Gurland J., Johnson R.O.: Case for using only maximum diameter in measuring tumors. Cancer Chemother Rep 1966; 50: pp. 119-124.
4. Moertel C.G., Hanley J.A.: The effect of measuring error on the results of therapeutic trials in advanced cancer. Cancer 1976; 38: pp. 388-394.
5. Royal H.D.: Technology assessment: scientific challenges. AJR Am J Roentgenol 1994; 163: pp. 503-507.
6. QIBA-Performance-Working-Group: Review of statistical methods for technical performance assessment. Stat Methods Med Res 2015; 24: pp. 27-67.
7. Gavrielides M.A., Kinnard L.M., Myers K.J., et. al.: Noncalcified lung nodules: volumetric assessment with thoracic CT. Radiology 2009; 251: pp. 26-37.
8. Li Q., Gavrielides M.A., Zeng R., et. al.: Volume estimation of low-contrast lesions with CT: a comparison of performances from a phantom study, simulations and theoretical analysis. Phys Med Biol 2015; 60: pp. 671.
9. Kinnard L.M., Gavrielides M.A., Myers K.J., et. al.: Volume error analysis for lung nodules attached to pulmonary vessels in an anthropomorphic thoracic phantom. Proc SPIE 2008; 6915: pp. 69152Q.
10. Gavrielides M.A., Zeng R., Kinnard L.M., et. al.: A template-based approach for the analysis of lung nodules in a volumetric CT phantom study. Proc SPIE 2009; 7260: pp. 726009.
11. Winer-Muram H.T., Jennings S.G., Meyer C.A., et. al.: Effect of varying CT section width on volumetric measurement of lung tumors and application of compensatory equations. Radiology 2003; 229: pp. 184-194.
12. Ravenel J.G., Leue W.M., Nietert P.J., et. al.: Pulmonary nodule volume: effects of reconstruction parameters on automated measurements—a phantom study. Radiology 2008; 247: pp. 400-408.
13. Borradaile K., Ford R.: Discordance between BICR readers.2010.Appl Clin Trials Nov 1: p. Epub. Available at: http://www.appliedclinicaltrialsonline.com/discordance-between-bicr-readers-0
14. Gavrielides M.A., Zeng R., Myers K.J., et. al.: Benefit of overlapping reconstruction for improving the quantitative assessment of CT lung nodule volume. Acad Radiol 2013; 20: pp. 173-180.
15. Gavrielides M.A., Zeng R., Kinnard L.M., et. al.: Information-theoretic approach for analyzing bias and variance in lung nodule size estimation with CT: a phantom study. IEEE Trans Med Imaging 2010; 29: pp. 1795-1807.
16. Gavrielides M.A., Kinnard L.M., Myers K.J., et. al.: A resource for the assessment of lung nodule size estimation methods: database of thoracic CT scans of an anthropomorphic phantom. Opt Express 2010; 18: pp. 15244-15255.
17. Das M., Ley-Zaporozhan J., Gietema H.A., et. al.: Accuracy of automated volumetry of pulmonary nodules across different multislice CT scanners. Eur Radiol 2007; 17: pp. 1979-1984.
18. Bolte H., Riedel C., Muller-Hulsbeck S., et. al.: Precision of computer-aided volumetry of artificial small solid pulmonary nodules in ex vivo porcine lungs. Br J Radiol 2007; 80: pp. 414-421.
19. Cagnon C.H., Cody D.D., McNitt-Gray M.F., et. al.: Description and implementation of a quality control program in an imaging-based clinical trial. Acad Radiol 2006; 13: pp. 1431-1441.
20. Goodsitt M.M., Chan H.P., Way T.W., et. al.: Accuracy of the CT numbers of simulated lung nodules imaged with multi-detector CT scanners. Med Phys 2006; 33: pp. 3006-3017.
21. Oda S., Awai K., Murao K., et. al.: Computer-aided volumetry of pulmonary nodules exhibiting ground-glass opacity at MDCT. AJR Am J Roentgenol 2010; 194: pp. 398-406.
22. McNitt-Gray M.F., Bidaut L.M., Armato S.G., et. al.: Computed tomography assessment of response to therapy: tumor volume change measurement, truth data, and error. Transl Oncol 2009; 2: pp. 216-222.
23. Keil S., Plumhans C., Behrendt F.F., et. al.: Semi-automated quantification of hepatic lesions in a phantom. Invest Radiol 2009; 44: pp. 82-88.
24. Gavrielides M.A., Li Q., Zeng R., et. al.: Minimum detectable change in lung nodule volume in a phantom CT study. Acad Radiol 2013; 20: pp. 1364-1370.
25. Nietert P.J., Ravenel J.G., Leue W.M., et. al.: Imprecision in automated volume measurements of pulmonary nodules and its effect on the level of uncertainty in volume doubling time estimation. Chest 2009; 135: pp. 1580-1587.
26. Prionas N.D., Ray S., Boone J.M.: Volume assessment accuracy in computed tomography: a phantom study. J Appl Clin Med Phys 2010; 11: pp. 3037.
27. Chen B., Barnhart H., Richard S., et. al.: Quantitative CT: technique dependence of volume estimation on pulmonary nodules. Phys Med Biol 2012; 57: pp. 1335-1348.
28. Chen B., Barnhart H., Richard S., et. al.: Volumetric quantification of lung nodules in CT with iterative reconstruction (ASiR and MBIR). Med Phys 2013; 40: pp. 111902.
29. Willemink M.J., Leiner T., Budde R.P., et. al.: Systematic error in lung nodule volumetry: effect of iterative reconstruction versus filtered back projection at different CT parameters. AJR Am J Roentgenol 2012; 199: pp. 1241-1246.
30. Xie X., Willemink M.J., Zhao Y., et. al.: Inter- and intrascanner variability of pulmonary nodule volumetry on low-dose 64-row CT: an anthropomorphic phantom study. Br J Radiol 2013; 86: pp. 20130160.
31. Linning E., Daqing M.: Volumetric measurement pulmonary ground-glass opacity nodules with multi-detector CT: effect of various tube current on measurement accuracy—a chest CT phantom study. Acad Radiol 2009; 16: pp. 934-939.
32. Petrick N., Kim H.J., Clunie D., et. al.: Comparison of 1D, 2D, and 3D nodule sizing methods by radiologists for spherical and complex nodules on thoracic CT phantom images. Acad Radiol 2014; 21: pp. 30-40.
33. Buckler A.J., Bresolin L., Dunnick N.R., et. al.: A collaborative enterprise for multi-stakeholder participation in the advancement of quantitative imaging. Radiology 2011; 258: pp. 906-914.
34. CT-Volumetry-Technical-Committee: QIBA profile: CT tumor volume change v2.2 reviewed draft (publicly reviewed version).2012. Available at: http://rsna.org/uploadedFiles/RSNA/Content/Science_and_Education/QIBA/QIBA-CT%20Vol-TumorVolumeChangeProfile_v2.2_ReviewedDraft_08AUG2012.pdf
35. McNitt-Gray M.F., Kim G.H., Zhao B., et. al.: Determining the variability of lesion size measurements from CT patient data sets acquired under “no change” conditions. Transl Oncol 2015; 8: pp. 55-64.
36. Zhao B., James L.P., Moskowitz C.S., et. al.: Evaluating variability in tumor measurements from same-day repeat CT scans of patients with non-small cell lung cancer. Radiology 2009; 252: pp. 263-272.
37. QI-Bench, free and open-source informatics tooling used to characterize the performance of quantitative medical imaging. Available at: http://www.qi-bench.org/ . Accessed June 30, 2013.
38. Barnhart H.X., Barboriak D.P.: Applications of the repeatability of quantitative imaging biomarkers: a review of statistical analysis of repeat data sets. Transl Oncol 2009; 2: pp. 231-235.
39. Bland M.: How should I calculate a within-subject coefficient of variation?.2006. cited 2015; Available at: https://www-users.york.ac.uk/∼mb55/meas/cv.htm
40. Warfield S.K., Zou K.H., Wells W.M.: Simultaneous truth and performance level estimation (STAPLE): an algorithm for the validation of image segmentation. IEEE Trans Med Imaging 2004; 23: pp. 903-921.
41. Rohlfing T., Russakoff D.B., Maurer C.R.: Performance-based classifier combination in atlas-based image segmentation using expectation-maximization parameter estimation. IEEE Trans Med Imaging 2004; 23: pp. 983-994.
42. Jaccard P.: The distribution of the flora in the alpine zone. New Phytol 1912; 11: pp. 37-50.
43. Sorensen R.: A method of establishing groups of equal amplitude in plant sociology based on similarity of species and its application to analyses of the vegetation on Danish commons. Nord Med 1948; 40: pp. 2389.
44. Dice L.: Measures of the amount of ecologic association between species. Ecology 1945; 26: pp. 297-302.
45. Reeves A.P., Chan A.B., Yankelevitz D.F., et. al.: On measuring the change in size of pulmonary nodules. IEEE Trans Med Imaging 2006; 25: pp. 435-450.
46. Petrou M., Quint L.E., Nan B., et. al.: Pulmonary nodule volumetric measurement variability as a function of CT slice thickness and nodule morphology. AJR Am J Roentgenol 2007; 188: pp. 306-312.