
Rationale and Objectives
The clinical utility of interactive computer-aided diagnosis (ICAD) systems depends on clinical relevance and visual similarity between the queried breast lesions and the ICAD-selected reference regions. The objective of this study is to develop and test a new ICAD scheme that aims improve visual similarity of ICAD-selected reference regions.
Materials and Methods
A large and diverse reference library involving 3,000 regions of interests was established. For each queried breast mass lesion by the observer, the ICAD scheme segments the lesion, classifies its boundary spiculation level, and computes 14 image features representing the segmented lesion and its surrounding tissue background. A conditioned k-nearest neighbor algorithm is applied to select a set of the 25 most “similar” lesions from the reference library. After computing the mutual information between the queried lesion and each of these initially selected 25 lesions, the scheme displays the six reference lesions with the highest mutual information scores. To evaluate the automated selection process of the six “visually similar” lesions to the queried lesion, we conducted a two-alternative forced-choice observer preference study using 85 queried mass lesions. Two sets of reference lesions selected by one new automated ICAD scheme and the other previously reported scheme using a subjective rating method were randomly displayed on the left and right side of the queried lesion. Nine observers were asked to decide for each of the 85 queried lesions which one of the two reference sets was “more visually similar” to the queried lesion.
Results
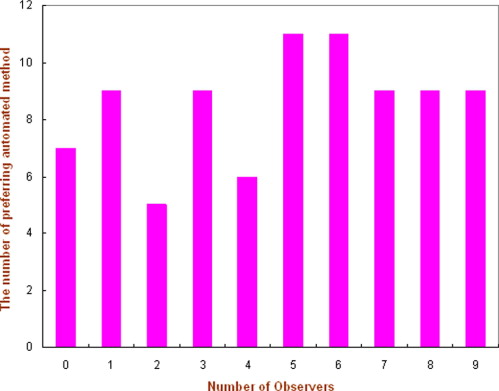
In classification of mass boundary spiculation levels, the overall agreement rate between the automated scheme and an observer is 58.8% (Kappa = 0.31). In observer preference study, the nine observers preferred on average the reference lesion sets selected by the automated scheme as being more visually similar than the set selected by the subjective rating approach in 53.2% of the queried lesions. The results were not significantly different for the two methods ( P = .128).
Conclusions
This study suggests that using the new automated ICAD scheme, the interobserver variability related issues can thus be avoided. Furthermore, the new scheme maintains the similar performance level as the previous scheme using the subjective rating method that can select reference sets that are significantly more visually similar ( P < .05) than when using traditional ICAD schemes in which the mass boundary spiculation levels are not accurately detected and quantified.
Computer-aided detection (CAD) of breast abnormalities is rapidly becoming a well accepted clinical practice to assist radiologists interpreting screening mammograms ( ). Studies have found that radiologists’ attitude toward and acceptance of CAD-cued microcalcification clusters and masses are substantially different ( ). Because of the high sensitivity (eg, >98%) ( ), a large number of radiologists heavily rely on CAD-cued results when searching for and identifying microcalcification clusters depicted on mammograms ( ). This practice substantially improves the efficiency of radiologists when interpreting screening mammograms and helps radiologists detect more subtle cancers associated with microcalcifications ( ). However, the lower CAD sensitivity for mass detection and the higher false-positive rates reduce radiologists’ confidence in CAD-cued masses ( ). As a result, although CAD schemes could potentially detect a larger fraction of false-negative cancers depicted as subtle masses ( ), radiologists frequently discard CAD-cued subtle masses in clinical practice ( ). A recent study reported that using current commercialized CAD systems did not increase cancer detection rate, but significantly increase recall (false-positive) rate in clinical practice ( ). To improve CAD performance and increase radiologists’ confidence in CAD-cued masses, investigators have been developing interactive CAD (ICAD) schemes to identify visually similar and clinically relevant mass lesions ( ). After a suspected mass lesion is queried by the observer, ICAD scheme segments the queried lesion and computes the likelihood of this region being associated with cancer based on comparisons with sets of “similar” lesions CAD-selected from a reference library. These “similar” lesions with verified outcome are displayed on the ICAD workstation and used as a “visual aid” to assist the radiologist in his or her decision-making. Preliminary observer performance studies suggest that using an ICAD concept could improve radiologists’ performance in classifying between malignant and benign masses ( ) as well as increase their confidence in the CAD-cued results ( ).
Although providing observers with a visual aid is a promising concept, to be effectively used, the reference lesions selected by ICAD must be considered as “clinically relevant” and “visually similar” to the queried suspected lesion. Previous studies demonstrated that because of the substantial difference between computer vision and human vision, ICAD-selected “similar” lesions are often not considered by observers as “visually similar” ( ). As a result, when observers believe that ICAD scheme selected a “poor” set of reference images for comparison, they are likely to ignore this visual aid.
Get Radiology Tree app to read full this article<
Get Radiology Tree app to read full this article<
Get Radiology Tree app to read full this article<
Get Radiology Tree app to read full this article<
Materials and Methods
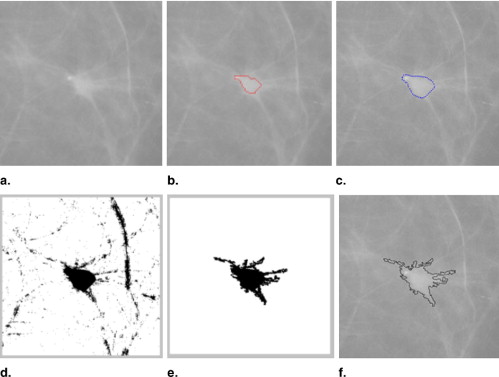
Automated Detection and Classification of Mass Region Spiculation Levels
Get Radiology Tree app to read full this article<
Get Radiology Tree app to read full this article<
Get Radiology Tree app to read full this article<
Get Radiology Tree app to read full this article<
Get Radiology Tree app to read full this article<
Get Radiology Tree app to read full this article<
Classification of Three Spiculation Levels of Reference Lesions
Get Radiology Tree app to read full this article<
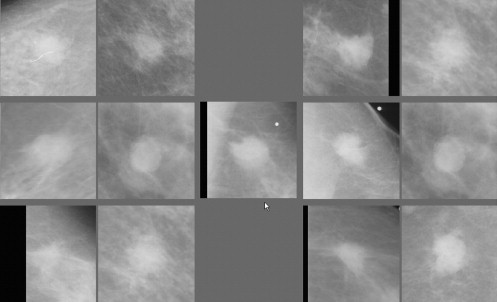
A New Scheme to Select and Display Similar Reference Lesions
Get Radiology Tree app to read full this article<
d(yq,xi)=∑nr=1(fr(yq)−fr(xi))2−−−−−−−−−−−−−−−−−−√ d
(
y
q
,
x
i
)
=
∑
r
=
1
n
(
f
r
(
y
q
)
−
f
r
(
x
i
)
)
2
Get Radiology Tree app to read full this article<
Get Radiology Tree app to read full this article<
Get Radiology Tree app to read full this article<
I(X;Y)=∑x∑yP(X,Y)log2P(X,Y)P(X)P(Y) I
(
X
;
Y
)
=
∑
x
∑
y
P
(
X
,
Y
)
log
2
P
(
X
,
Y
)
P
(
X
)
P
(
Y
)
where P ( X,Y ) is the joint probability density function (PDF) of the two ROIs, P ( X ) and P ( Y ) are the marginal PDFs. We used a histogram approach to compute the PDFs. In this approach, the joint PDF is estimated by computing the fraction of pixels in a particular pixel values bin in the two-dimensional histogram divided by the total number of pixels inside the ROI ( ). Before computing these PDFs, normalization of local histogram is applied to preprocess each paired ROIs in an attempt to reduce image noise and compensate the irregular variation or shift of the pixel value distributions. Specifically, the mean (μ) and the standard deviation (σ) of the pixel value distributions are calculated for each ROI. The interval ( μ – 2σ , μ + 2σ ) is divided into 128 pixel value bins. All pixels with values falling outside the interval range are assigned to the nearest ending bin during histogram calculation. After MI computation between the queried lesion and each of the reference lesions initially selected by the KNN classifier, the 25 “similar reference lesions” are resorted based on the computed MI values. The first N reference regions (eg, n = 6) with the highest MI values in the sorted list are finally selected as the reference lesions “most similar” to the queried one. These lesions are displayed on an ICAD workstation for observers to visually compare between the queried lesion and the CAD-selected reference lesions. This aims at assisting radiologists in their decision making for diagnosis of the queried suspected mass lesion.
Get Radiology Tree app to read full this article<
An Observer Preference Study
Get Radiology Tree app to read full this article<
Get Radiology Tree app to read full this article<
Get Radiology Tree app to read full this article<
Get Radiology Tree app to read full this article<
Get Radiology Tree app to read full this article<
Results
Get Radiology Tree app to read full this article<
Table 1
Agreement Between the Number of Reference Regions Classified into One of Three Spiculation Categories as Subjectively Rated by an Observer and the New Automated Scheme
Spiculation Level None/Minimal Moderate Severe/Significant Total (Observer) None/minimal 499 410 9 918 Moderate 415 983 197 1595 Severe/significant 4 202 281 487 Total (scheme) 918 1595 487 3000
Get Radiology Tree app to read full this article<
Get Radiology Tree app to read full this article<
Table 2
Fraction (%) of Cases for Which Each Observer Preferred the Reference Set Selected by the Automated Scheme as Being “More Visually Similar” to the Queried Regions
Number of the Observer 1 2 3 4 5 Average Radiologists 63.5% (54/85) 45.9% (39/85) 54.1% (46/85) 47.1% (40/85) 51.8% (44/85) 52.5% Nonclinicians 50.6% (43/85) 50.6% (43/85) 56.5% (48/85) 58.8% (50/85) N/A 54.1%
Get Radiology Tree app to read full this article<
Get Radiology Tree app to read full this article<
Get Radiology Tree app to read full this article<
Discussion
Get Radiology Tree app to read full this article<
Get Radiology Tree app to read full this article<
Get Radiology Tree app to read full this article<
Get Radiology Tree app to read full this article<
Get Radiology Tree app to read full this article<
Get Radiology Tree app to read full this article<
Get Radiology Tree app to read full this article<
Get Radiology Tree app to read full this article<
References
1. Brem R.F., Baum J., Lechner M.: Improvement in sensitivity of screening mammography with computer-aided detection: a multi-institutional trial. AJR Am J Roentgenol 2003; 181: pp. 687-693.
2. Taplin S.H., Rutter C.M., Lehman C.: Testing the effect of computer-assisted detection on interpretive performance in screening mammography. AJR Am J Roentgenol 2006; 187: pp. 1475-1482.
3. D’Orsi C.J.: Computer-aided detection: there is no free lunch. Radiology 2001; 221: pp. 585-586.
4. Zheng B., Chough D., Cohen C., et. al.: Actual versus intended use of CAD systems in the clinical environment. Proc SPIE 2006; 6146: pp. 9-14.
5. Brem R.F., Hoffmeister J.W., Zisman G., et. al.: A computer-aided detection system for evaluation of breast cancer by mammographic appearance and lesion size. AJR Am J Roentgenol 2005; 184: pp. 893-896.
6. Freer T.M., Ulissey M.J.: Screening mammography with computer-aided detection: prospective study of 12,860 patients in a community breast center. Radiology 2001; 220: pp. 781-786.
7. Warren Burhenne L.J., Wood S.A., D’Orsi C.J., et. al.: Potential contribution of computer-aided detection to the sensitivity of screening mammography. Radiology 2000; 215: pp. 554-562.
8. Gur D., Stalder J.S., Hardesty L.A., et. al.: Computer-aided detection performance in mammographic examination of masses: assessment. Radiology 2004; 223: pp. 418-423.
9. Khoo L.A., Taylor P., Given-Wilson R.M.: Computer-aided detection in the United Kingdom National Breast Screening Programme: prospective study. Radiology 2005; 237: pp. 444-449.
10. Ko J.M., Nicholas M.J., Mendel J.B., et. al.: Prospective assessment of computer-aided detection in interpretation of screening mammograms. AJR Am J Roentgenol 2006; 187: pp. 1483-1491.
11. Fenton J.J., Taplin S.H., Carney P.A., et. al.: Influence of computer-aided detection on performance of screening mammography. N Engl J Med 2007; 356: pp. 1399-1409.
12. Giger M.L., Huo Z., Vyborny C.J., et. al.: Intelligent CAD workstation for breast imaging using similarity to known lesions and multiple visual prompt aids. Proc SPIE 2002; 4684: pp. 768-773.
13. Muramatsu C., Li Q., Suzuki K., et. al.: Investigation of psychophysical measures for evaluation of similar images for mammographic masses: preliminary results. Med Phys 2005; 32: pp. 2295-2304.
14. Zheng B., Lu A., Hardesty L.A., et. al.: A method to improve visual similarity of breast masses for an interactive computer-aided diagnosis environment. Med Phys 2006; 33: pp. 111-117.
15. Tourassi G.D., Harrawood B., Singh S., et. al.: Evaluation of information-theoretic similarity measures for content-based retrieval and detection of masses in mammograms. Med Phys 2007; 34: pp. 140-150.
16. Zheng B., Abrams G., Britton C.A., et. al.: Evaluation of an interactive computer-aided diagnosis scheme for mammography: a pilot study. Proc SPIE 2007; 6515: 1M1–8
17. Zheng B., Abrams G., Leader J.K., et. al.: Mass margins spiculations: agreement between ratings by observers and a computer scheme. Proc SPIE 2007; 6514: 1P1–8
18. Vyborny C.J., Doi T., O’Shaughnessy K.F., et. al.: Breast cancer: importance of spiculation in computer-aided detection. Radiology 2000; 215: pp. 703-707.
19. Kegelmeyer W.P., Pruneda J.M., Bourland P.D., et. al.: Computer-aided mammographic screening for spiculated lesions. Radiology 1994; 191: pp. 331-337.
20. Karssemeijer N., Brake G.: Detection of stellate distortions in mammograms. IEEE Trans Med Imaging 1996; 15: pp. 611-619.
21. Sahiner B., Chan H.P., Petrick N., et. al.: Improvement of mammographic mass characterization using spiculation measures and morphological features. Med Phys 2001; 28: pp. 1455-1465.
22. Zheng B., Chang Y.H., Gur D.: Computerized detection of masses in digitized mammograms using single image segmentation and a multi-layer topographic feature analysis. Acad Radiol 1995; 2: pp. 959-966.
23. Zheng B., Sumkin J.H., Good W.F., et. al.: Applying computer-assisted detection schemes to digitized mammograms after JPEG data compression. Acad Radiol 2000; 7: pp. 595-602.
24. Yezzi A., Kichenassamy S., Kumar A., et. al.: A geometric snake model for segmentation of medical imagery. IEEE Trans Med Imaging 1997; 16: pp. 199-209.
25. Kupinski M.A., Giger M.L.: Automated seeded lesions segmentation on digital mammograms. IEEE Trans Med Imaging 1998; 17: pp. 510-517.
26. Xu C., Prince J.L.: Generalized gradient vector flow external forces for active contours. Signal Proc 1998; 71: pp. 131-139.
27. Cover T.M., Thomas J.A.: 1991.WileyNew York, NY
28. Pluim J.P., Maintz J.B., Viergever M.A.: Mutual-information-based registration of medical images, a survey. IEEE Trans Med Imaging 2003; 22: pp. 986-1004.
29. Tourassi G.D., Vargas-Voracek R., Catarious D.M., et. al.: Computer-assisted detection of mammographic masses: a template matching scheme based on mutual information. Med Phys 2003; 30: pp. 2123-2130.
30. Maes F., Collignon A., Vandermeulen D., et. al.: Multimodality image registration by maximization of mutual information. IEEE Trans Med Imaging 1997; 16: pp. 187-198.
31. Paquerault S., Yarusso L.M., Papaioannou J., et. al.: Radial gradient-based segmentation of mammographic microcalcifications: observer evaluation and effect on CAD performance. Med Phys 2004; 31: pp. 2648-2657.
32. Balassy C., Prokop M., Weber M., et. al.: Flat-panel display (LCD) versus high-resolution gray-scale display (CRT) for chest radiography: an observer preference study. AJR Am J Roentgenol 2005; 184: pp. 752-756.
33. Rosner B.: ed 52000.DuxburyPacific Grove, CA
34. Li L., Zheng Y., Zhang L., et. al.: False-positive reduction in CAD mass detection using a competitive classification strategy. Med Phys 2001; 28: pp. 250-258.
35. Filev P., Hadjiiski L., Sahiner B., et. al.: Comparison of similarity measures for the task of template matching of masses on serial mammograms. Med Phys 2005; 32: pp. 515-529.
36. Huston L., Sukthankar R., Wickremesinghe R., et. al.: Diamond: a storage architecture for early discard in interactive search.2004. Available online from: http://diamond.cs.cmu.edu/papers/fast2004-diamond.pdf . Accessed April 23, 2007.
37. Yang L., Jin R., Sukthankai R., et. al.: Learning distance metrics for interactive search-assisted diagnosis of mammograms. Proc SPIE 2007; 6514: 1H1–11